Silver Broke Out While Gold Pulled Back and Yields Moved Higher
Spot Silver is doing something gold could not do Thursday. The metal is pushing toward $69 while the 30-year yield recovers and gold gives back Wednesday’s gains. The breakout above the swing top confirmed the uptrend and opened room on the chart that the market has not seen in weeks.
Treasury’s buyback announcement knocked yields lower and weakened the dollar on Wednesday. Thursday gave back part of the yield move. Silver kept going because it has a supply deficit underneath it, steady industrial demand pulling metal into manufacturing and a short position that was leaning the wrong way when the reversal started.
At 16:49 GMT, Spot Silver (XAGUSD) was trading at $68.20, up $1.99 or 1.79%. The market reached $68.99 and traded as low as $65.64.

Silver Did Not Need Gold to Lead Thursday
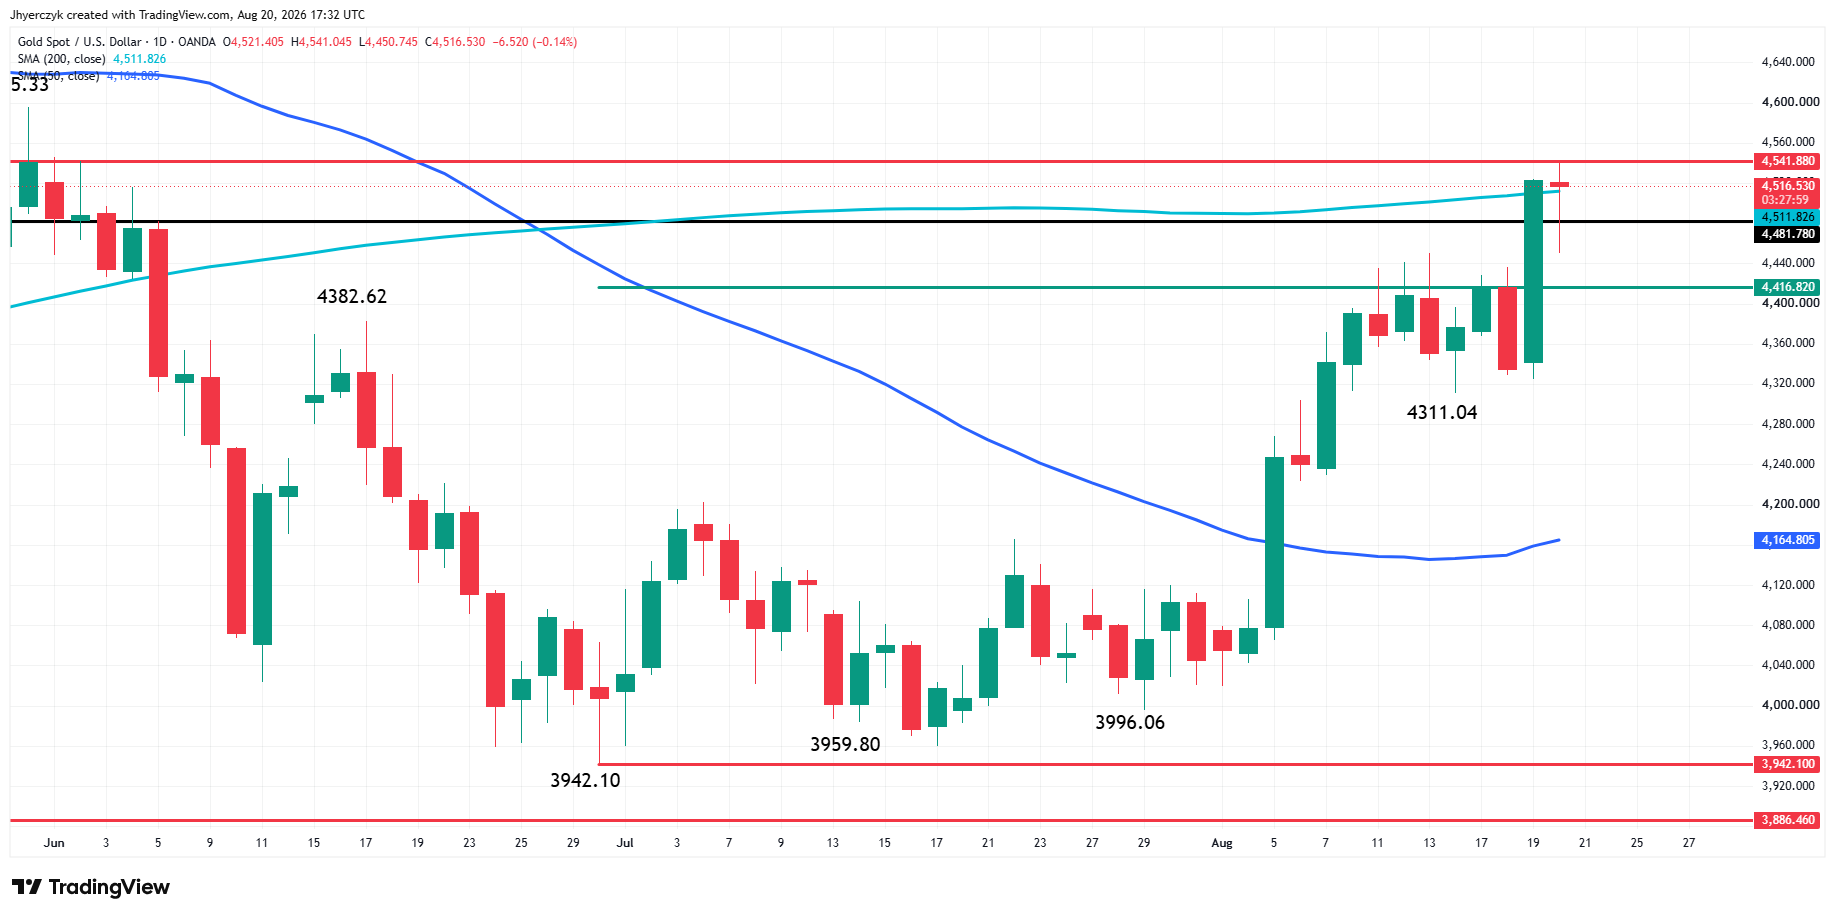
Gold was lower on the session after profit-taking hit a 4% rally. Silver kept running. The two metals are not trading the same story right now.
Gold made its move Wednesday and ran into the 200-day moving average. Traders took profits as yields recovered. Silver was still working through its own breakout, pressing above Wednesday’s high at $67.02 and reaching $68.99 before pulling back. The session low at $65.64 attracted buyers early and the market never looked back.
Silver has two sources of demand working at the same time. It trades with precious metals when yields and the dollar move in its favor. It also trades on industrial consumption from electronics, electric vehicles, solar manufacturing and AI data centers. Gold only has the first one. Silver having both is why it held Thursday when gold could not.
The Supply Deficit Is the Floor Under Every Rally
The silver market is heading for its sixth consecutive annual deficit. Industry forecasts point to a shortfall of about 46.3 million ounces in 2026.
Silver Price Forecast
Every new Silver analysis as it publishes, today's technical signal and key levels, live price — on one page.
See all Silver forecastsMine supply has not responded to higher prices because most silver comes out of the ground as a byproduct of copper, lead and zinc production. A mine operator does not change a development plan because silver moved higher. Recycling brings some metal back. It does not fill the gap.
Shorts Got Caught and the Covering Added Fuel
Speculative traders had built large short positions before the Treasury announcement. The yield and dollar trade had been working for them. Silver was under pressure. That positioning flipped when Treasury stepped into the long-bond market and yields dropped hard on Wednesday.
Once prices turned, shorts had to cover into a market that was already moving. Silver went through yesterday’s high and pressed toward $69 without finding meaningful resistance. Short-covering can produce a fast move. It cannot hold a market by itself. Silver is holding because the rally arrived in a market that already had a deficit and firm industrial demand behind it.
Daily Spot Silver (XAGUSD) Technical Analysis
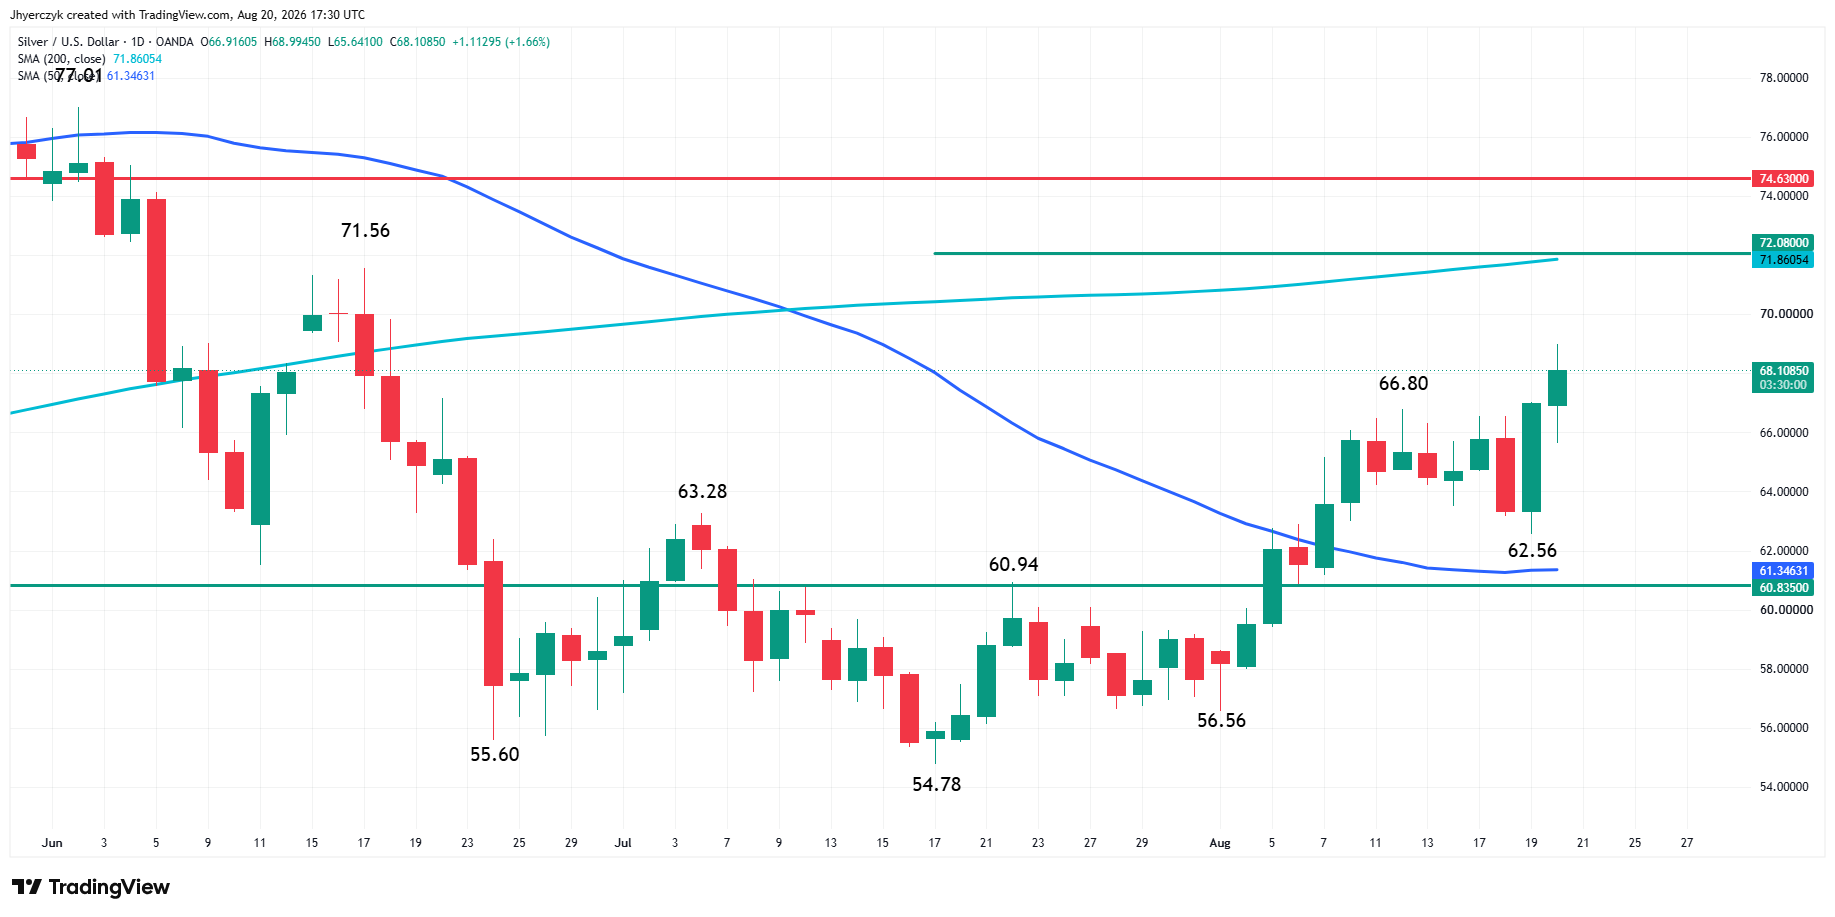
Spot Silver is edging higher at the mid-session on Thursday after breaking out over the swing top at $66.80. The move reaffirmed the uptrend and made $62.56 a new swing bottom. A trade through this level will change the main trend to down.
The daily chart indicates there is plenty of room to the upside with the first target the June 17 main top at $71.56. This is followed by the 200-day moving average at $71.86 and a long-term 50% level at $72.08.
The nearest support pivot is $66.60. This is followed by the swing bottom at $62.56 and the 50-day moving average at $61.35.
The wide distance between support and resistance suggests the market has entered a period of heightened volatility.
What to Watch
Silver held higher Thursday while gold pulled back and the 30-year yield recovered. The Treasury buyback started the move but the supply deficit and industrial demand are carrying it now. The sixth consecutive annual shortfall and 46.3 million ounces of projected deficit in 2026 give buyers a reason to stay on every pullback that gold does not have.
The yield rebound is the risk. Thursday showed the metal can absorb a partial recovery in long yields. A full reversal in yields and the dollar together is the combination that has not been tested yet. The dollar near multi-week lows is doing work on silver’s behalf. That help disappears fast if the currency turns with the bond market.
The breakout above the swing top confirmed the uptrend and the chart has room overhead toward the June high and the 200-day moving average. The distance between support and resistance has widened, which means volatility is expanding in both directions. The swing bottom below is where the trend changes. Silver is trading in the upper half of that range after separating from gold on a day when the yield trade was not cooperating. Shorts already learned this week that the positioning can flip fast. The supply deficit keeps the floor firm. The yield trade decides the ceiling.
More Information in our Economic Calendar.