



Gold Jumped $101 Because the Dollar and Yields Finally Stopped
Gold had been unable to use its war bid all week. The dollar was running. Treasury yields were making multiyear highs. September rate hike odds were elevated. The Middle East headlines were on the screen every day and the metal kept falling. Thursday the dollar pulled back from a nearly three-week high. Treasury yields backed off. Gold moved $101 in a single session.
At 13:08 GMT, Spot Gold (XAUUSD) is trading at $4,489.46, up $101.24 or 2.31%.
The Dollar Broke First and Yields Followed
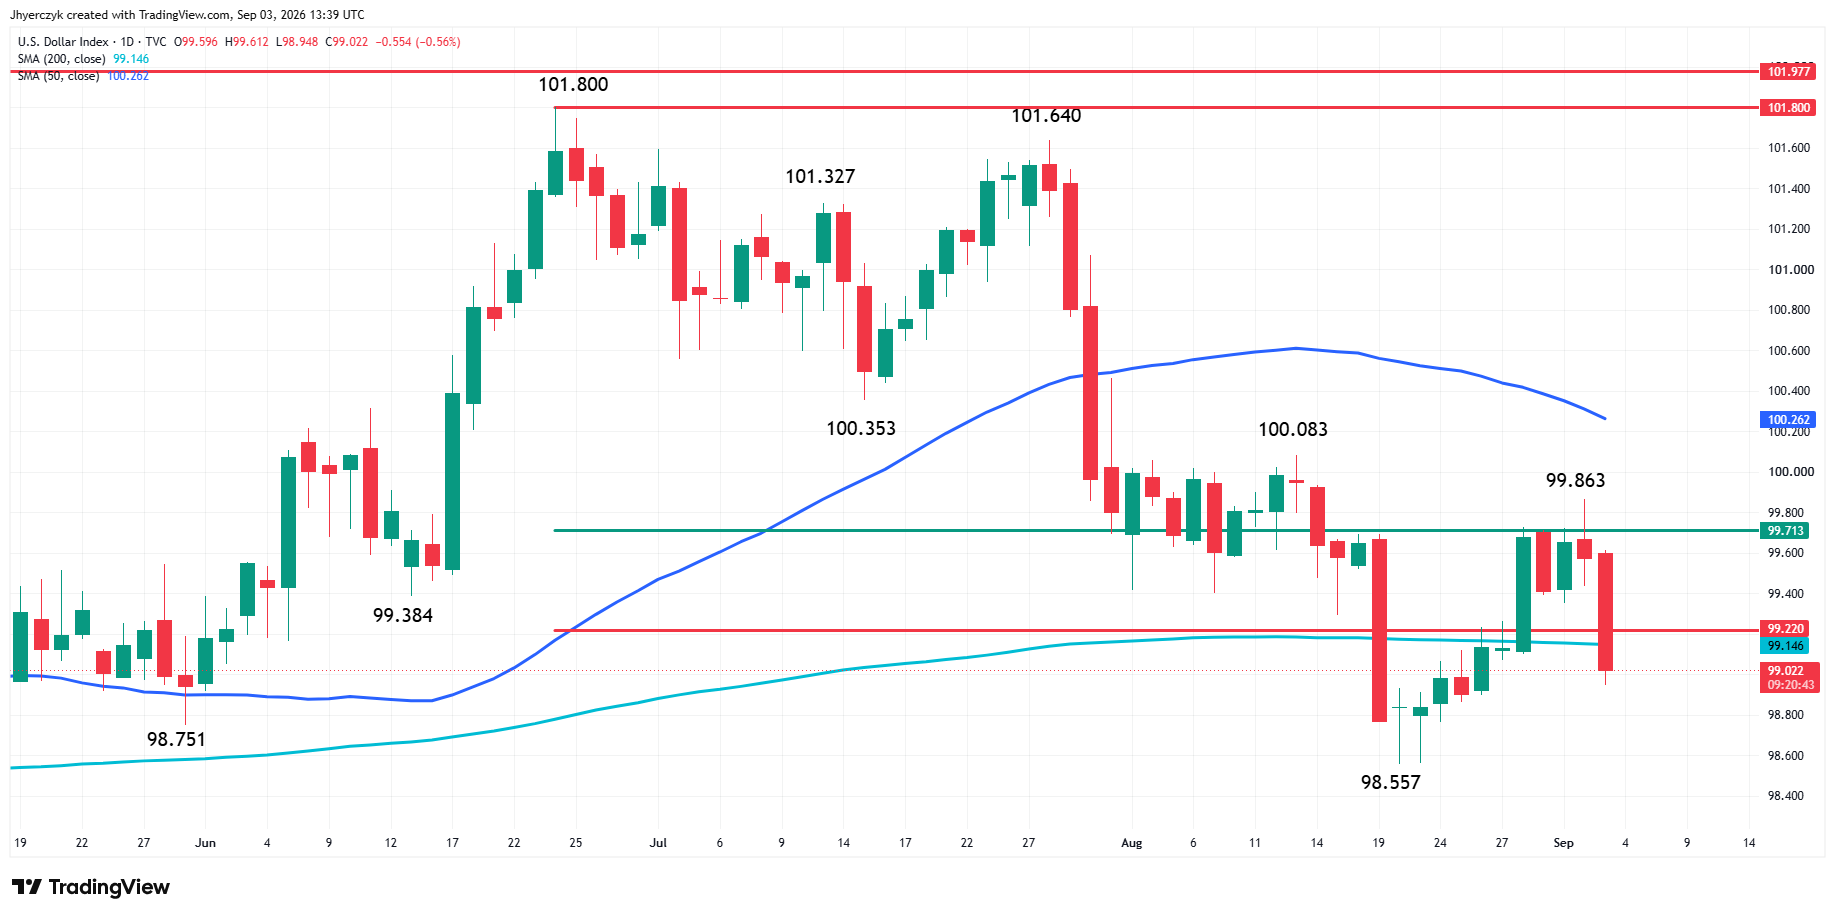
The dollar index had reached a nearly three-week high before backing off Thursday. The 10-year Treasury yield had reached recent highs before easing. The pullback in yields was not large. A few basis points. Gold had been stretched after several sessions of selling and did not need a major bond rally. It needed the 10-year to stop climbing.
Wednesday’s close had already shown the first sign. Gold recovered more than 1% into the close after dropping to $4,282.62 earlier in the session. Thursday turned that into a full rally. September hike odds are still near 60%. Warsh has not softened his message. The bond market has not broken down.
Crude Near Six-Week Highs and the Gulf Is Getting Wider
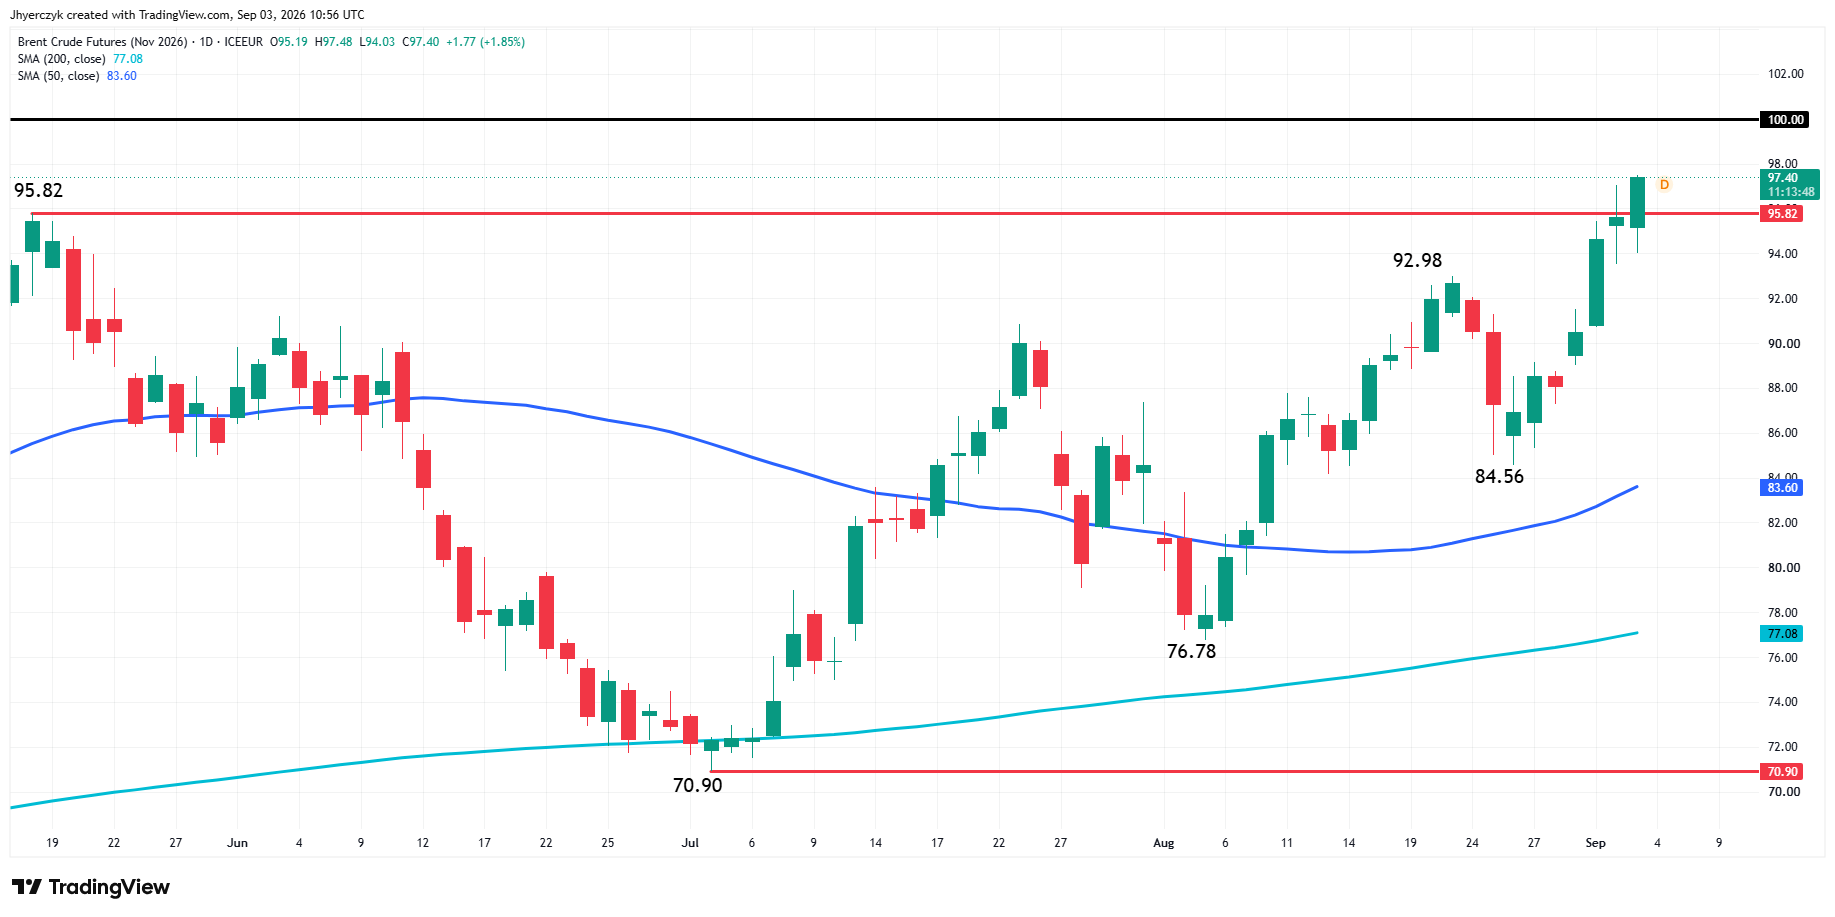
Crude oil remained near six-week highs Thursday. Oil has risen more than 30% from late-February levels. The war around the Strait of Hormuz has entered its seventh month. Missiles and drones targeted U.S. bases in Kuwait, Jordan and Bahrain this week. Israel warned that Iranian energy sites could become targets. The Strait remains restricted. Tanker traffic is still moving under threat.
The fighting is expanding, not cooling. Reports that White House aides want to keep the conflict quieter before November’s midterms have not changed the military picture. Washington has a political reason to limit escalation. Kuwait, Israel and Iran are not reading from that script.
Gold Price Forecast
Every new Gold analysis as it publishes, today's technical signal and key levels, live price — on one page.
See all Gold forecastsADP Was Soft and Friday’s Number Is Larger
Wednesday’s ADP report showed only a moderate rise in private-sector jobs during August. The number did not give the Fed a stronger reason to push rate expectations higher.
Friday’s nonfarm payrolls report lands in the morning. A soft number with weaker wages takes pressure off the September trade. A firm report with stronger wages keeps Warsh’s Jackson Hole message in the price. Gold at $4,489 moved $101 on a dollar pullback and a few basis points off the 10-year. That tells you how compressed the trade had become and how fast it can move in either direction once the data lands.
Daily Spot Gold (XAUUSD) Technical Analysis
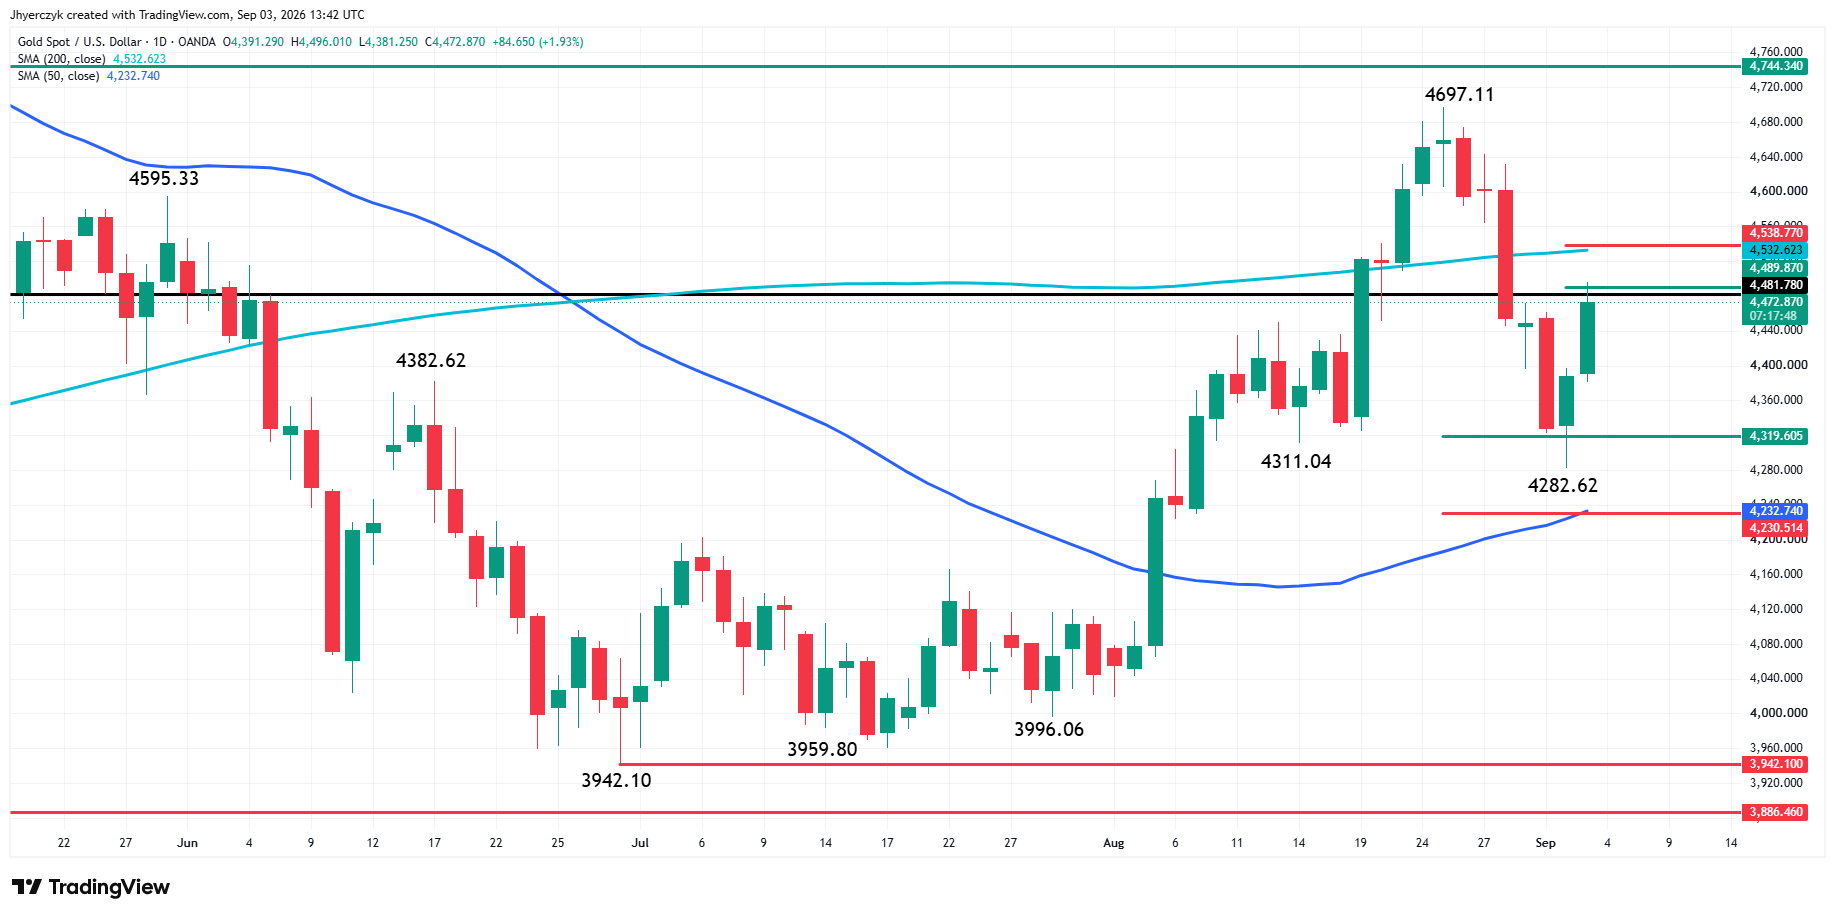
Spot gold is soaring Thursday following Wednesday’s successful test of a key retracement zone at $4,319.60 to $4,230.51.
On Wednesday, sellers pierced the previous swing bottom at $4,311.04, changing the main trend to down. Value buyers emerged as the market tested the retracement zone and neared 50-day moving average support at $4,233.03.
The subsequent bounce produced a potentially bullish closing price reversal bottom at $4,282.62. The chart pattern was confirmed at the opening Thursday. The new short-term range is $4,697.11 to $4,282.62. Its 50% to 61.8% retracement zone is $4,489.87 to $4,538.77.
On Thursday, the market briefly pierced the 50% level with a test of $4,496.01. Overcoming this level with conviction could fuel an acceleration into the 200-day moving average at $4,532.67 and the 61.8% level at $4,538.77. The latter is another potential trigger point for an acceleration to the upside, with the August top at $4,697.11 the next major target.
The market is currently straddling $4,481.78. A close above this level would take gold out of bear-market territory.
The confirmation of Wednesday’s closing price reversal bottom from the key retracement zone has turned near-term momentum bullish. The main trend remains down after the break through $4,311.04, but buyers could still face short-term headwinds at $4,489.87 to $4,538.77. Recapturing the 200-day moving average is the key test for sustaining the rally.
What to Watch
Friday’s payrolls report is running the gold trade. A soft jobs number keeps the dollar and yields backing off and gives gold room to extend toward the 200-day. A firm number with stronger wages puts the pressure back on the metal the same week it rallied $101 off the lows. Oil near six-week highs and the Strait of Hormuz still disrupted keep the haven demand underneath. The data decides whether gold gets to use it again Friday or whether the dollar takes it back.
Wednesday’s reversal bottom at $4,282.62 from the key retracement zone turned near-term momentum bullish. The 50% level at $4,489.87 is sitting right on top of the current price and the 200-day at $4,532.67 is the resistance that matters above it. The 61.8% level at $4,538.77 sits close enough to the 200-day that both are part of the same test. Clearing that cluster opens the August top at $4,697.11. The main trend is still down after the break through $4,311.04 but a close above $4,481.78 takes gold out of bear-market territory. The reversal bottom says buyers showed up at the value zone. Friday’s number decides what they do next.
If you’d like to know more about how to Spot gold, please visit our educational area.