
Gold Posts Best Day Since February on Rate Relief
Gold is having its strongest session since February because the three headwinds that had been sitting on the metal all backed off at the same time. Iran deal talk pulled crude lower and took inflation pressure out of the rate trade.
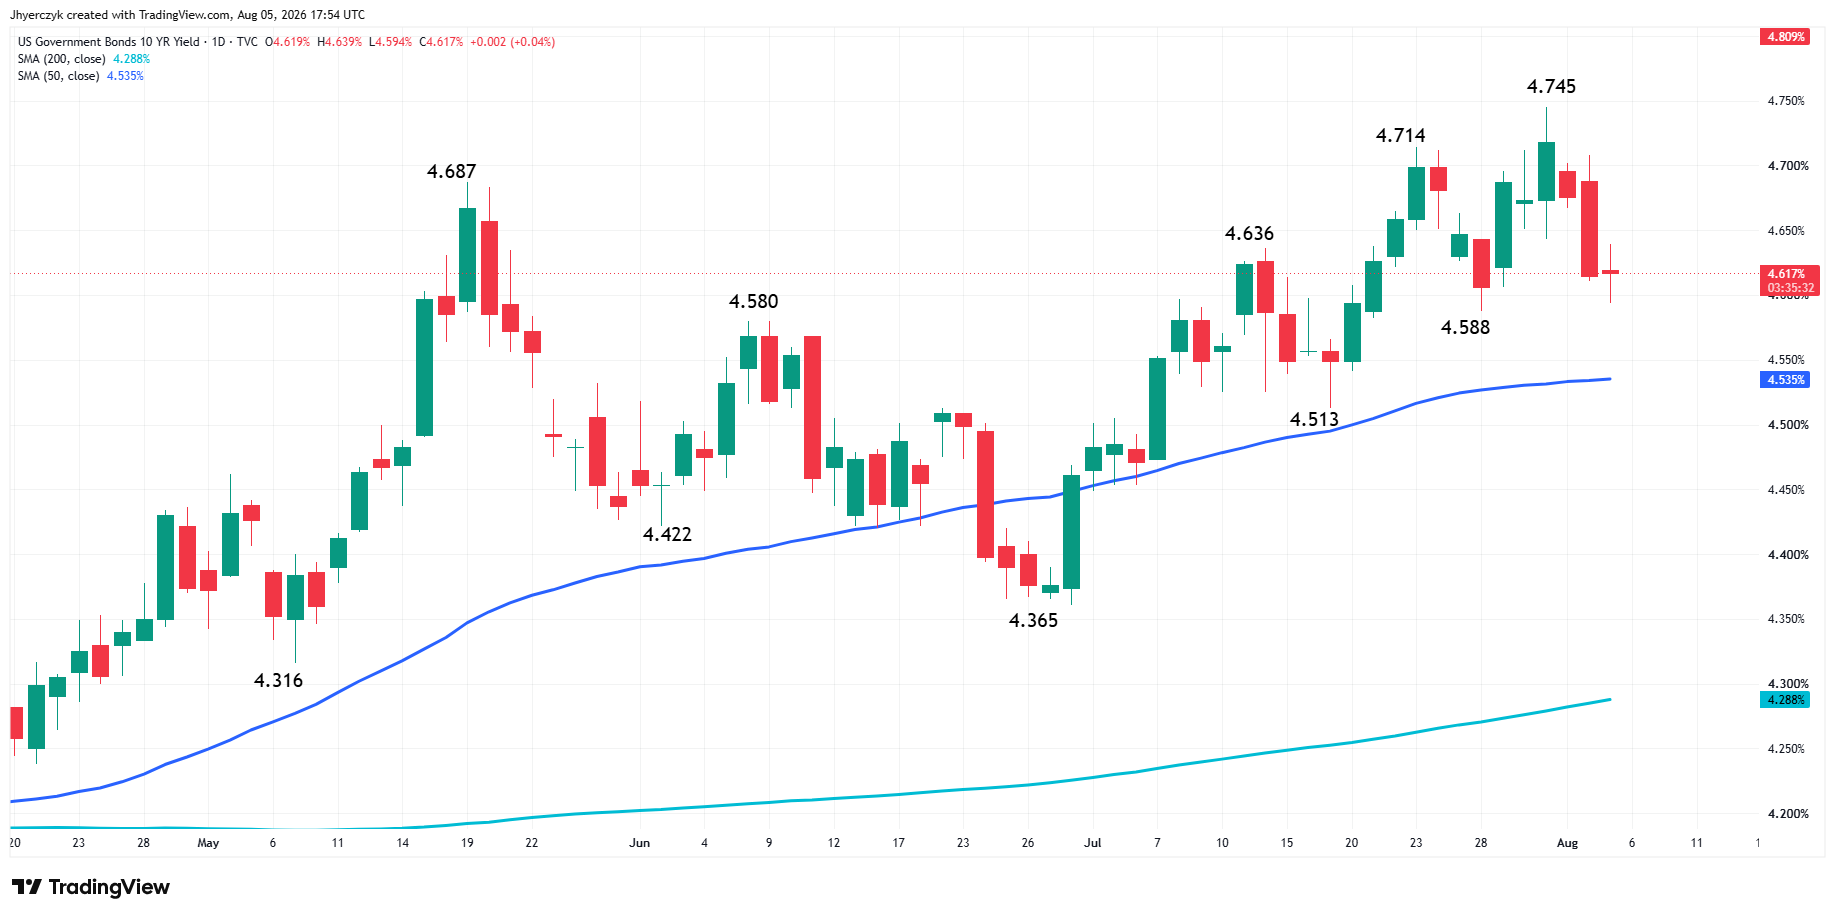
Treasury yields followed oil down with the 10-year near 4.619% and the 30-year at 5.171%. The dollar is sitting near a six-week low at 99.71 after last week’s yen intervention kept long-dollar positions unwinding. The ADP employment report missed at 44,000 against a 75,000 estimate, which gives the Fed less reason to rush.
Gold is still down 24% from its $5,595 record high and 19% since the Iran war began. Central-bank buying has slowed. ETF money left during the second quarter. This is not a return to the January trade. But the macro pressure that kept sellers in control is breaking apart and rate-sensitive money is coming back.
At 17:43 GMT, XAUUSD is trading $4249.84, up $172.79 or +4.24%.

Iran Talks Gave Gold the Opening
President Trump said the administration had very good discussions with Iran during all-day negotiations. Treasury Secretary Bessent said a deal to allow commercial ships through Hormuz could come this week. U.S. Central Command said the southern route was free and open. That is the most specific language Washington has used since the conflict began and the oil market reacted. WTI is near $76. Brent is around $80. Both are well below last week’s levels.
The oil move feeds directly into gold because cheaper crude takes the energy inflation argument away from the hawks. Schmid and Kashkari both said this week that rates need to go higher, but the inflation case they are making gets weaker every day oil stays contained. The market has pulled September hike odds below 60% from nearly 70% at the start of the week. The Fed has not changed its position. The market’s confidence that the Fed will act on it is fading.
The risk has not gone anywhere. Iran talks have produced optimism before without delivering an agreement or normal shipping flows. Crude can snap back on one comment from Tehran and if it does, the inflation premium and the rate trade reassemble fast. Gold is trading a possible de-escalation, not a finished deal.
Gold Price Forecast
Every new Gold analysis as it publishes, today's technical signal and key levels, live price — on one page.
See all Gold forecastsADP Miss Keeps the Pressure Off Before Friday
Private payrolls came in at 44,000 against a 75,000 estimate and down from June’s 95,000. That is not hiring data that supports a September move. Schmid and Kashkari still have the inflation side of the argument but the labor market is not backing them up today.
Friday’s nonfarm payrolls is the number that matters. Strong wages and firm hiring give the hawks what they need. Yields firm, the dollar finds support and gold gives back part of this move. A softer report keeps rate odds under pressure and gives the money that has been returning to gold a reason to stay.
The ADP number on its own does not change the Fed. It changes how much conviction the market has that the Fed will act, and right now that conviction is dropping.
Daily Spot Gold (XAUUSD) Technical Analysis
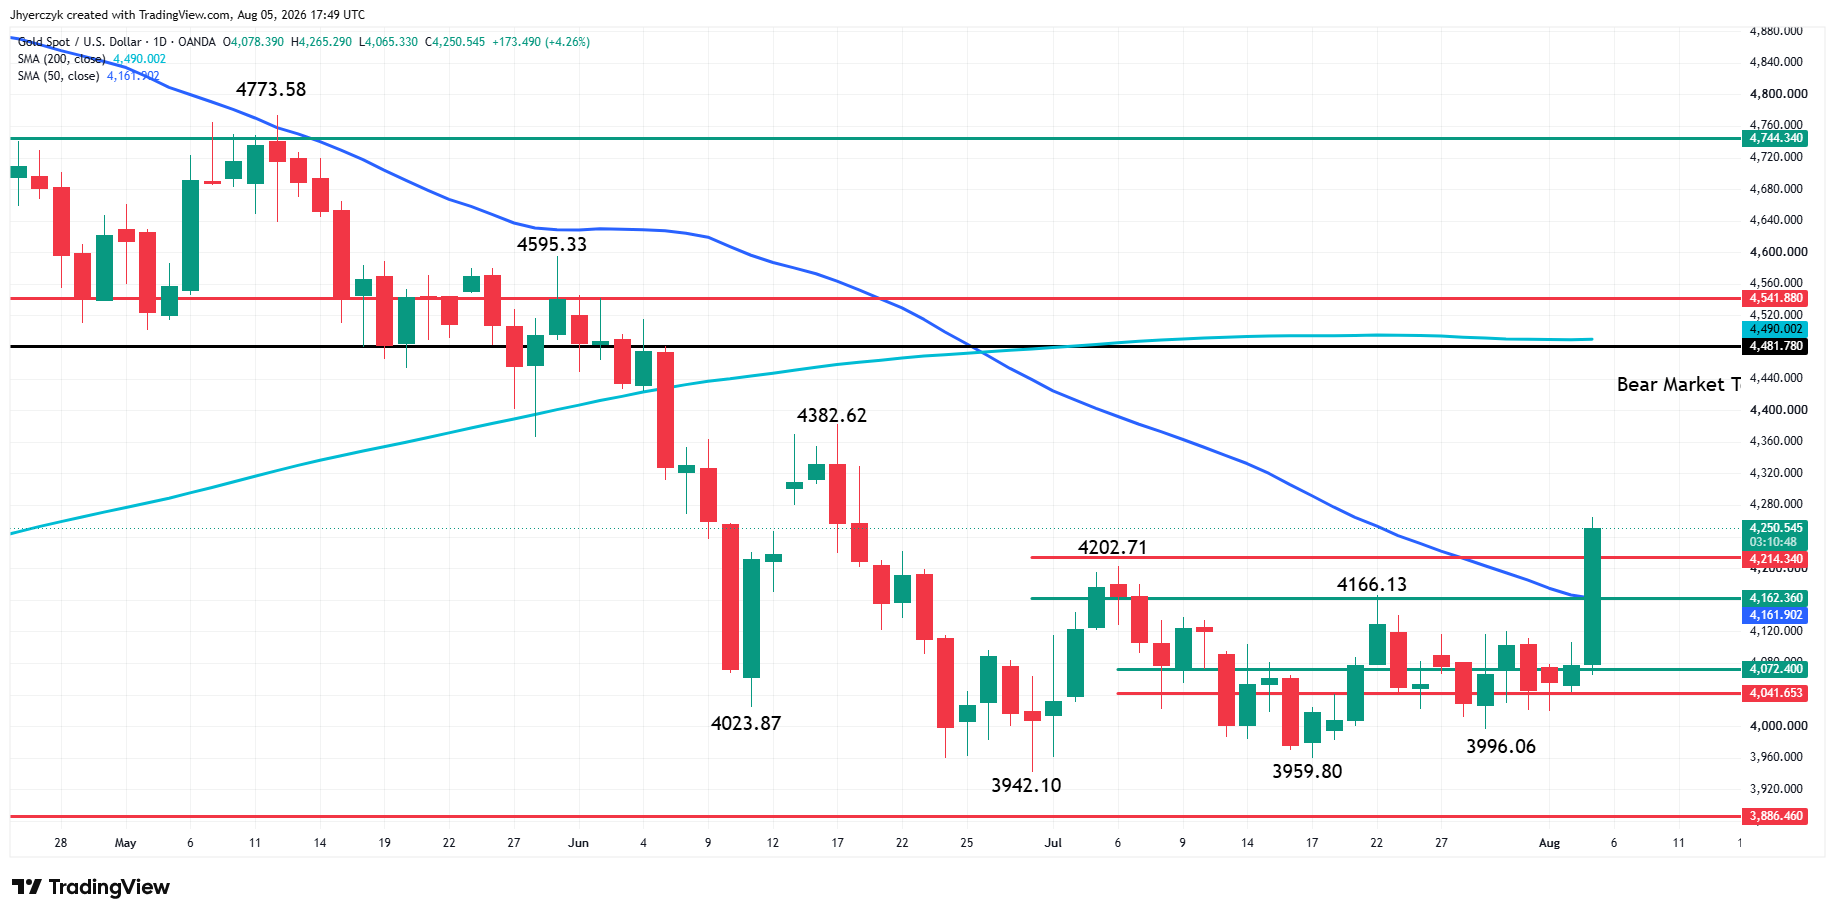
Spot Gold is soaring late Wednesday after crossing to the strong side of the 50-day moving average at $4161.75. The market had spent several weeks consolidating inside an elongated rectangle pattern while straddling the short-term retracement zone at $4072.40 to $4041.65. The breakout triggered a sharp move to the upside.
The rally was fueled by the 50-day moving average breakout and buy stops over swing tops at $4166.13 and $4202.71.
A sustained move over the Fibonacci level at $4214.34 will indicate strong buying. The daily chart shows plenty of room to the upside, with the main top at $4382.62 the next target. Clearing this level could put the 200-day moving average at $4489.98 in play.
On the downside, trader reaction to the 50-day moving average at $4161.75 will continue to influence the near-term direction.
What to Watch
Gold broke out above the 50-day moving average for the first time in weeks and the move has room if the macro relief holds. Iran talks, lower oil and softer yields all have to keep cooperating. If any one of them reverses, especially crude, the inflation argument comes back and the hawks have what they need to rebuild September.
Friday’s payrolls decides whether this is the start of a real recovery or a one-week event. The breakout above the consolidation pattern and the 50-day is technically significant but it happened on macro relief, not a structural change in the gold market. Buyers need the data to confirm what the price is showing or this rally stalls at the first sign of trouble.
If you’d like to know more about how to trade gold, please visit our educational area.