


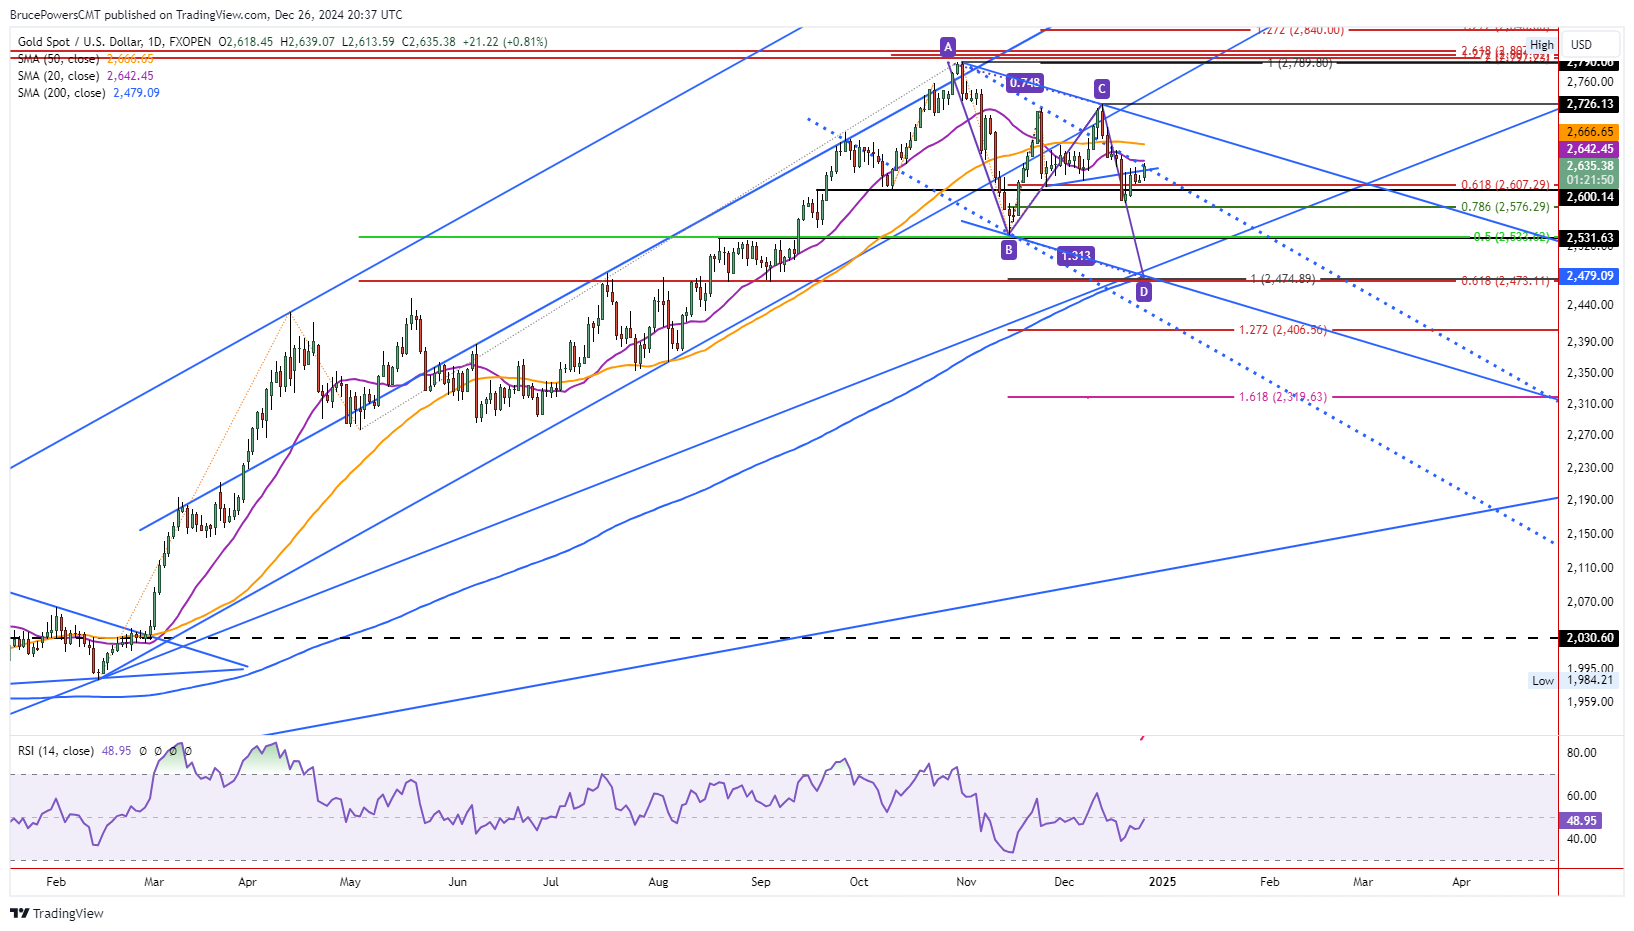
Gold advanced to a five-day high of 2,639 on Thursday and it is on track to close the day at its highest price during that period. This is a sign of short-term strength that included a test of resistance around the 20-Day MA, currently at 2,642. Although the initial downtrend line (blue dots) was breached briefly, the 20-Day MA is usually going to provide a more useful dynamic resistance line as it is calculated.
There have been several days since the drop below the 20-Day line on December 13 that it shows as resistance. Therefore, the 20-Day line can be anticipated to continue as a line of resistance until there is a decisive reclaim of the line.

Faces Key Near-Term Pivot
Also, a key point to consider is that the significance of the near-term downtrend line may have diminished since the recent swing high on December 12 was established. A new downtrend line connects that high from the peak and with a new parallel line across the bottom of the channel.
The fact that the downtrend line and the 20-Day line identify a similar price area could lead to a spike if the 20-Day line is reclaimed. When two different indicators show a similar price level the breakout through the pivot can sometimes show a higher level of interest and enthusiasm than at other times.
Falling Channel Shows Downward Pressure
The new falling trend channel may lower the potential significance of a breakout above the 20-Day line. Also, the same would be true on a reclaim of the 50-Day MA, a little higher at 2,666. This is because the new top downtrend line represents potential resistance. It adds to the significance of the December swing high (C) as it is a lower swing high and part of the developing downtrend price structure. The current situation is that the potential for a bearish continuation of the falling channel remains until there is a rise above the December swing high.
Reclaim of 2,664 Weekly High Could Improve Sentiment
Another key upside price level to be aware of is last week’s high of 2,664. Notice it is very close to the 50-Day MA. Since last week ended with a lower weekly high and lower weekly (not shown) low a sustained rise above resistance from last week would begin to improve the bullish sentiment in gold as it would negate last week’s bearish signal on the weekly time frame.
Gold Price Forecast
Every new Gold analysis as it publishes, today's technical signal and key levels, live price — on one page.
See all Gold forecastsFor a look at all of today’s economic events, check out our economic calendar.


