


Resistance Holds, Pullback Begins
Gold pulled back to a three-day low of $4,583 on Wednesday, confirming a resistance zone near the 50% retracement of a prior downswing. A trend high of $4,697 was reached during Tuesday’s session, with resistance tested near the 50% retracement at $4,689 for the second day. Sellers subsequently regained control, resulting in a lower daily high of $4,674 and a lower low of $4,583, with those levels now defining short-term resistance and support, respectively.
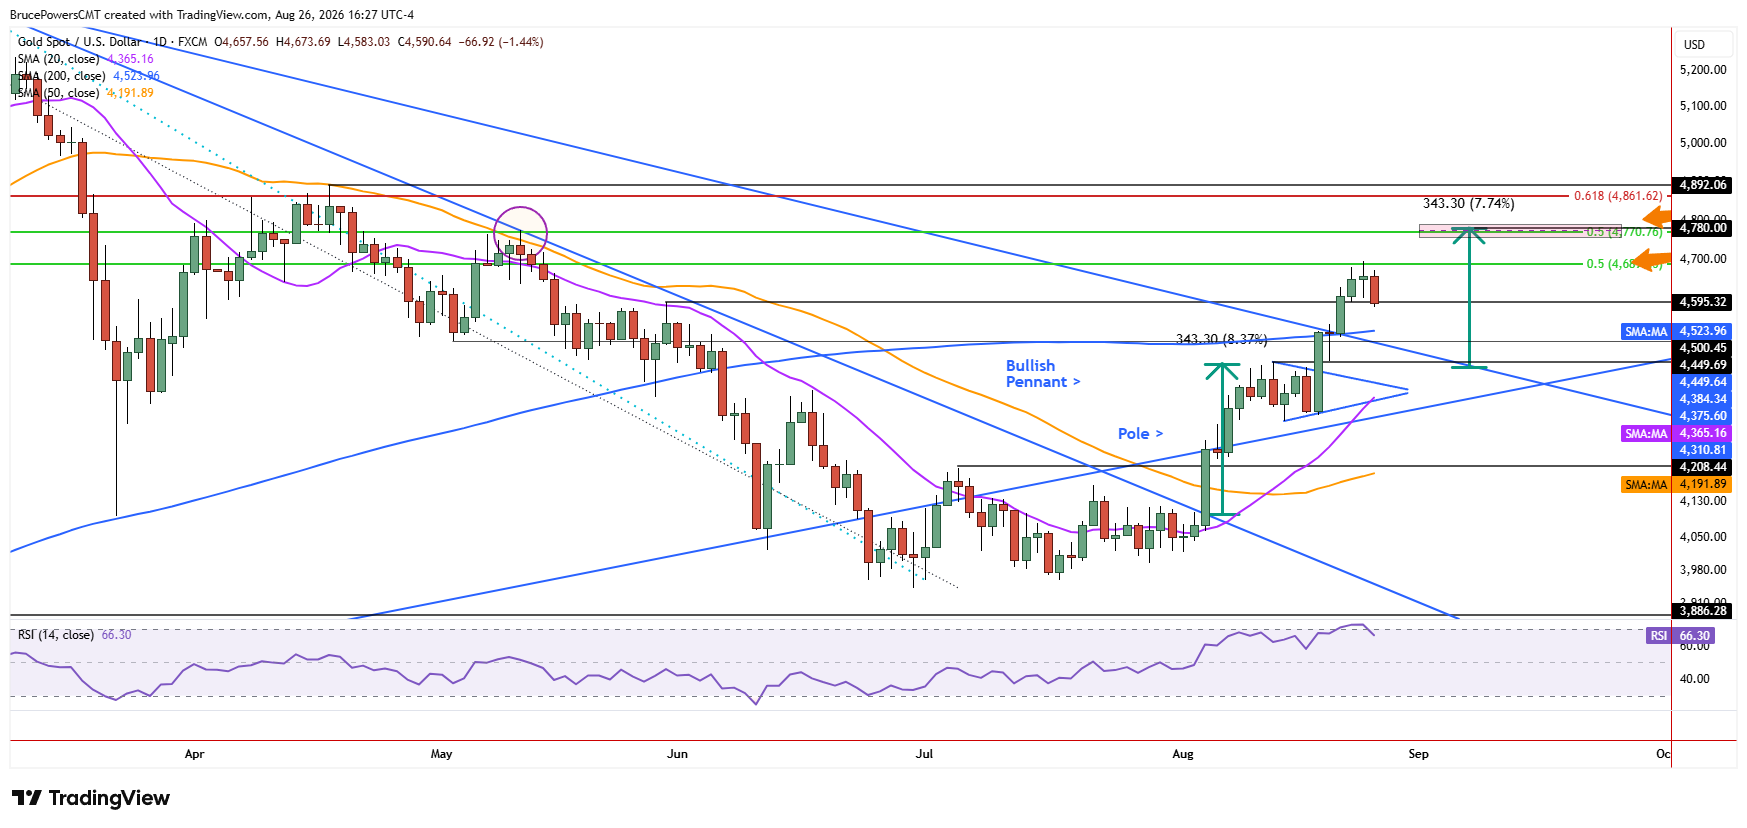
The low for the day was a successful test of support near prior resistance from an interim swing high at $4,595 established in late May. That price zone has marked an area of support over the prior two days. Its recognition during a bearish signal suggests a constructive pullback after gold reached a new high in the second leg up from recent corrective lows.
Support Becomes the Next Test
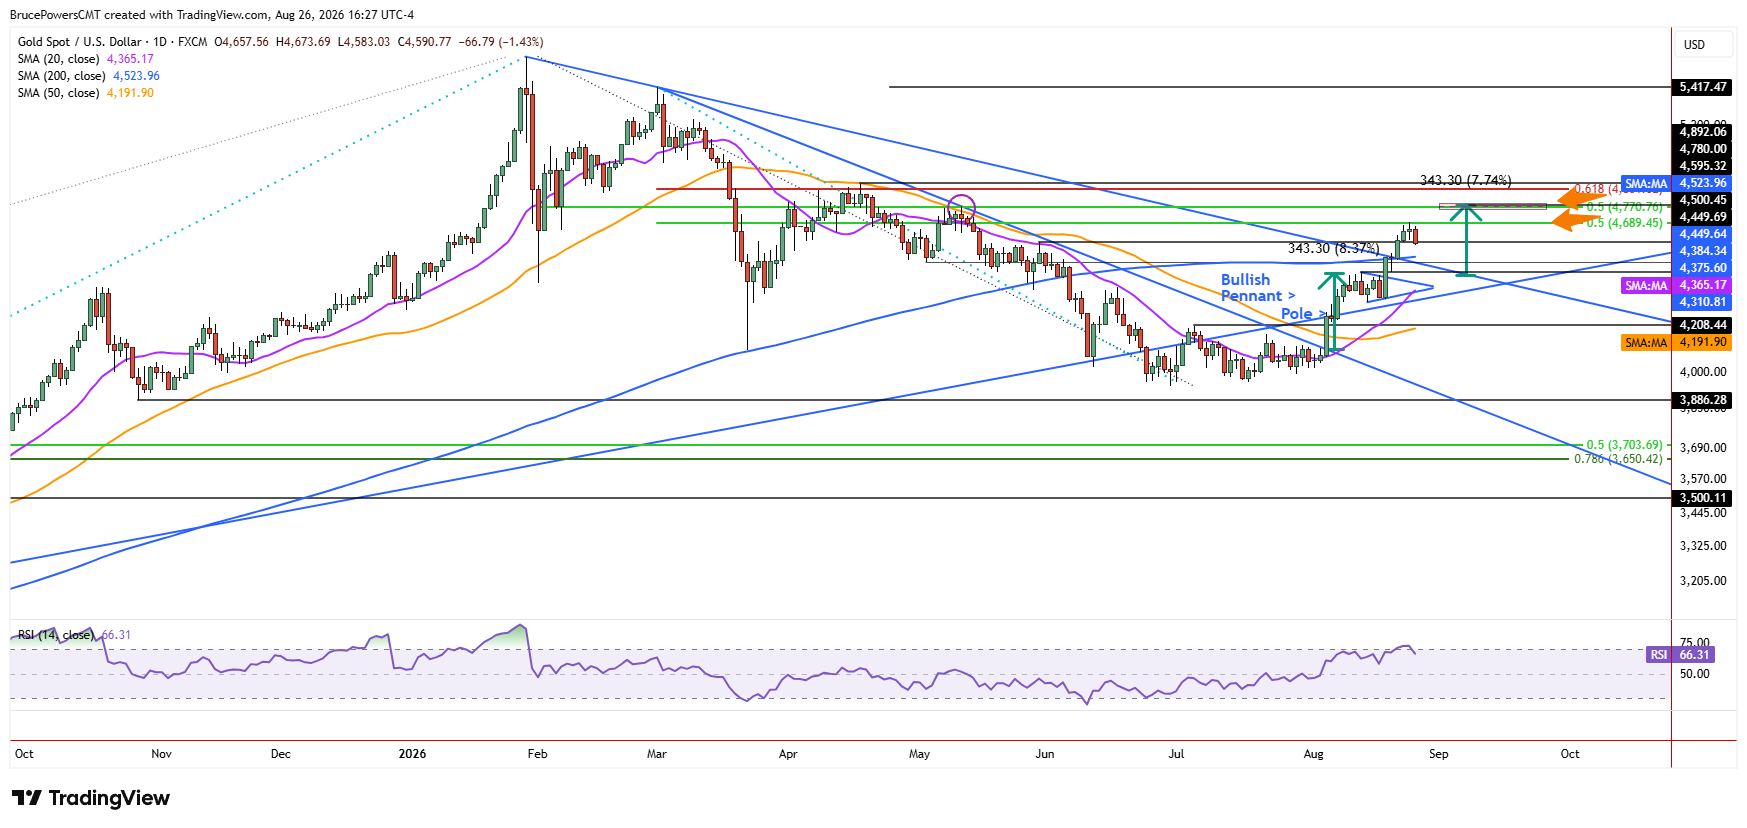
Wednesday’s bearish two-day reversal signal suggests that the first pullback after a breakout above both the downtrend line and 200-day moving average last Friday, may have begun. The next key indication will come from how gold behaves near the 200-day moving average. If the recent breakout is significant, as it seems to be, support above or near that average followed by renewed strength would provide further confirmation.
However, a deeper pullback to test support near the downtrend line would also maintain the developing bullish structure, although it would represent a greater loss of momentum than if support held above the 200-day moving average. There is also a potential support area near the prior high of $4,450 from two weeks ago.
$4,780 Target Remains in Play
The measuring objective from a recent bullish pennant pattern suggests a potential upside target near $4,780. That price area is reinforced by a lower swing high at $4,774 and the 50% retracement of a larger prior downswing at $4,771. Given the recent decisive upside move above the two key trend resistance indicators, a second leg higher following the current pullback remains a possibility. The breakout reflects a potential change in character for gold and provides additional confirmation that the bearish correction may be over.
Whether that bullish shift continues will depend on how well support holds during the current pullback. A successful defense would reinforce the constructive behavior following the sharp advance that began with the August 5 trendline break and could set the stage for another move toward the $4,780 target zone.
Gold Price Forecast
Every new Gold analysis as it publishes, today's technical signal and key levels, live price — on one page.
See all Gold forecastsIf you’d like to know more about how to trade gold and silver, please visit our educational area.