Thursday Dip Sets First Lines
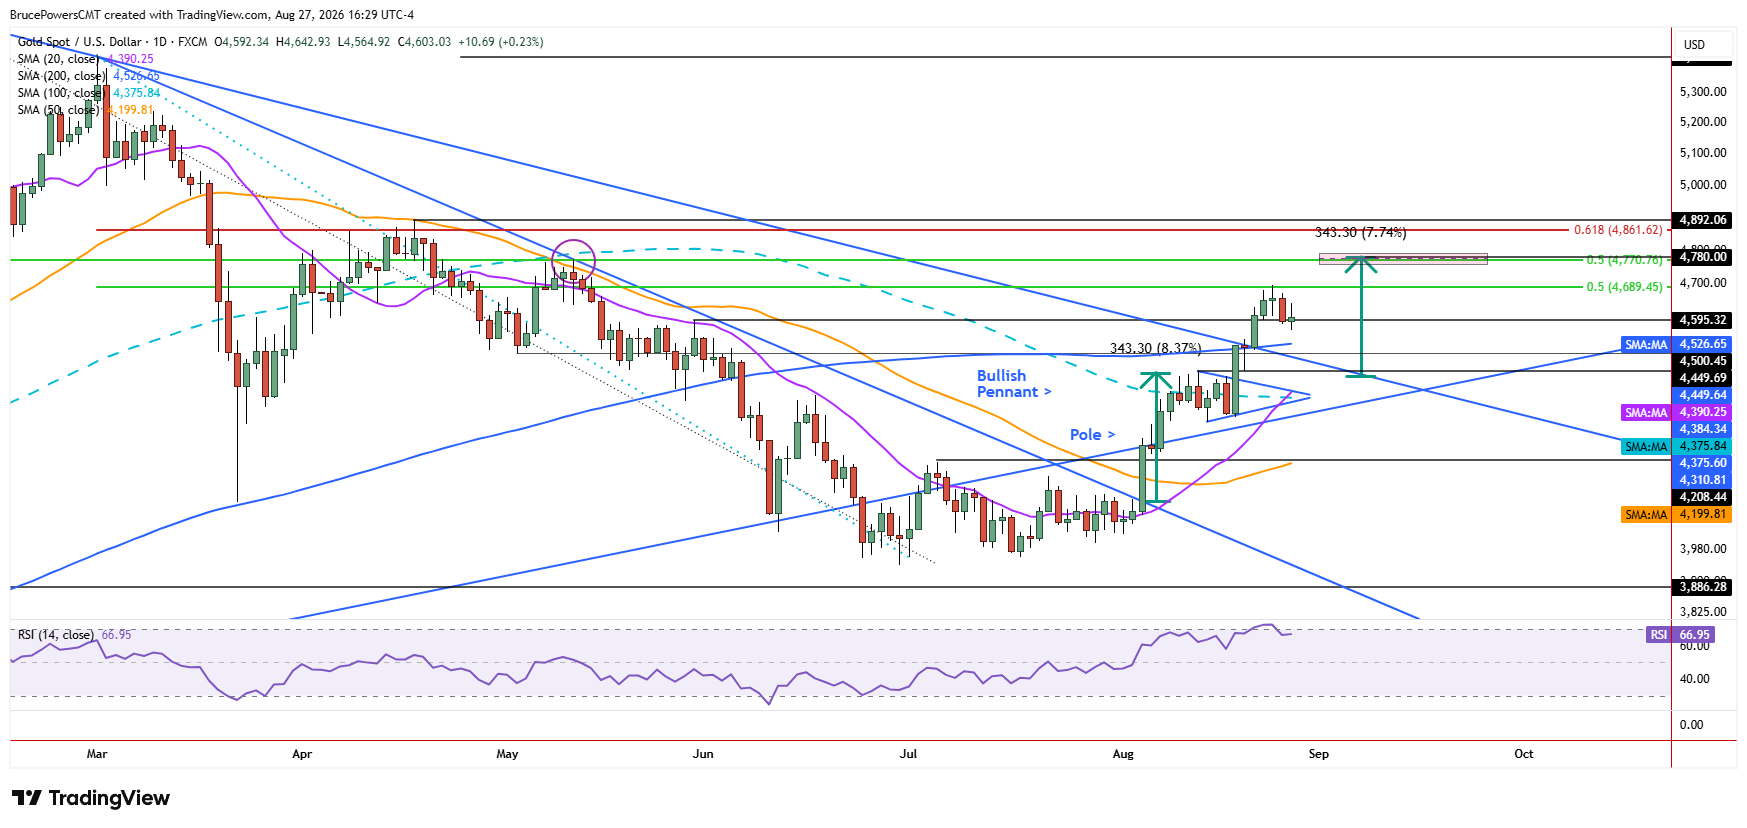
Gold extended its pullback from the recent $4,697 high on Thursday, bringing key support levels into focus as the market tests the strength of its latest advance. A four-day low of $4,565 was established and a lower high of $4,643. Those levels are now short-term support and resistance, respectively. A deeper pullback continues to look likely toward a possible test of support near the 200-day moving average, at $4,527 currently before another leg up.
However, a decisive advance above Thursday’s high could begin to change that view and accelerate the extension of the rising trend toward the next upside target zone. The way gold responds to the current pullback should therefore provide an early indication of whether underlying demand remains strong enough to support another advance.

200-Day Reclaim Shifts Character
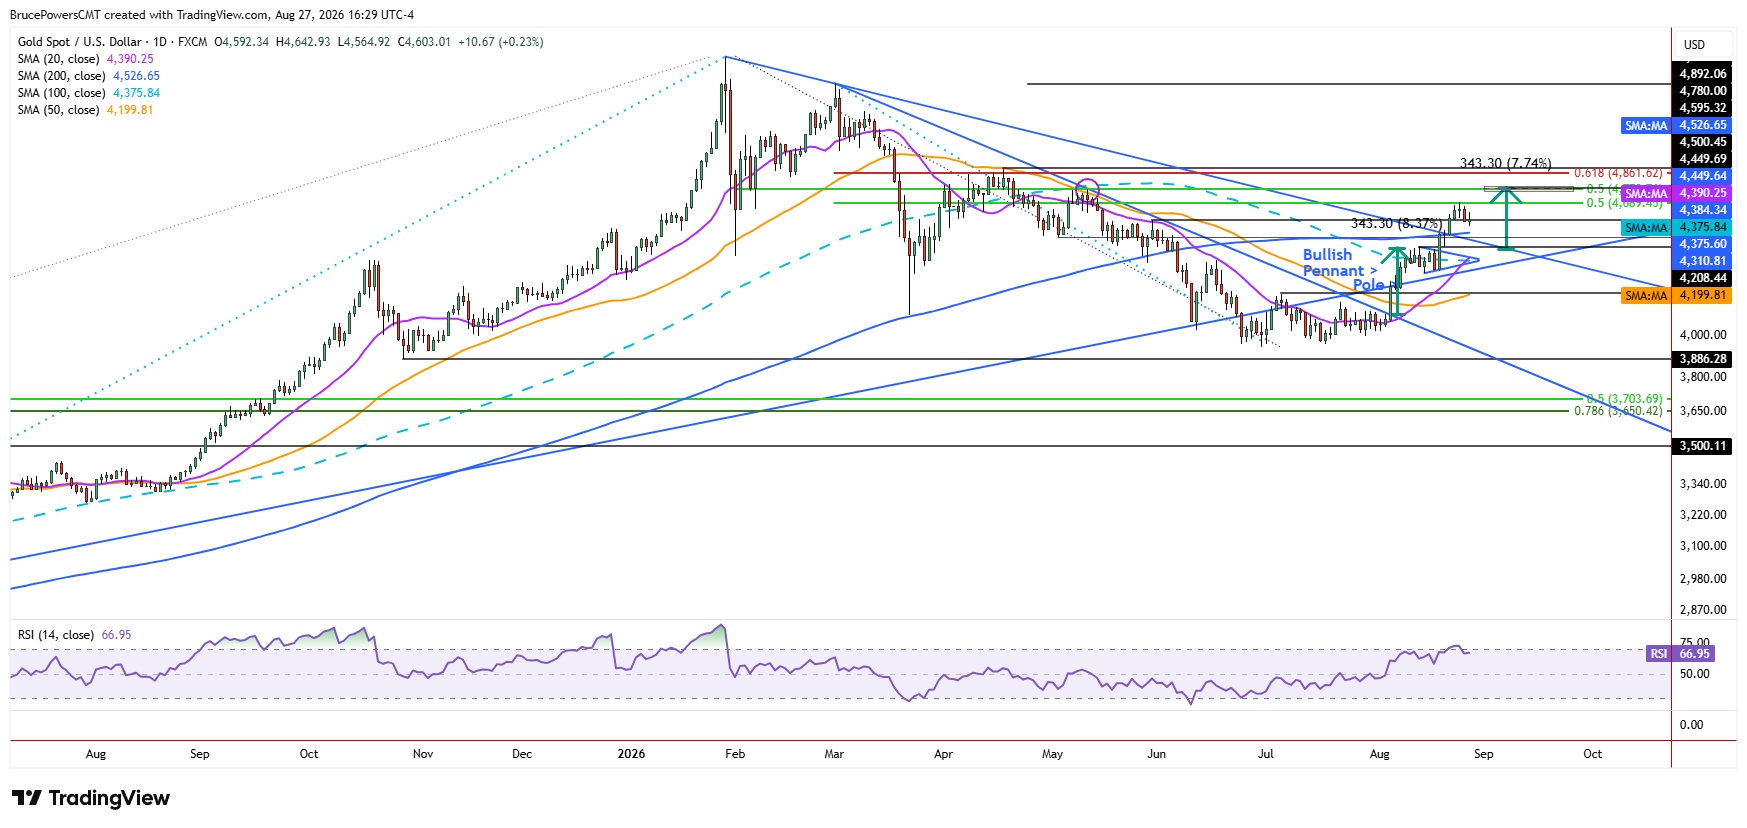
Last week’s recovery of both the downtrend line and 200-day moving average shows a potential change in character for gold, as it continues to emerge from its recent bearish correction. The reclaim of the 200-day moving average shows the long-term trend reasserting itself, with underlying demand improving. That average has defined dynamic support for the bull trend since it was last reclaimed in October 2023. Its successful recovery therefore strengthens the case for a broader bullish trend, even if gold experiences additional short-term weakness.
First Upside Cluster Sits at $4,771–$4,774
This does not mean, however, that gold is headed toward new highs in the near-term. What it does suggest is that bullish momentum exhibited in the current advance may continue toward higher initial targets. The next upside target is defined by the confluence of several indicators, including the 50% retracement of a prior decline at $4,771, a swing high from May at $4,774, and an estimated objective from a bullish pennant pattern, which triggered last week. This concentration of potential resistance makes the $4,771-$4,774 area an important test if the current advance resumes.
Depth of This Dip Is the Tell
The magnitude and duration of the current pullback should help determine the strength of remaining underlying short-term demand. A shorter and shallower correction would show greater underlying strength. Typical price behavior following a break above a falling trendline is that price will pullback to test the area around the line as support. For now, the prior high and top of the flag at $4,450 can be used as a proxy for the line, and it stands on its own as a potential support level if support fails at the 200-day moving average. This leaves the pullback as a key test: holding support would preserve the potential for a leg higher in the relatively near-term.
If you’d like to know more about how to trade gold and silver, please visit our educational area.