
Looking ahead, traders are focusing on the upcoming release of the Empire State Manufacturing Index from the US, which could present short-term trading opportunities.
This anticipation comes ahead of Fed Chair Jerome Powell’s scheduled speech later in the North American session, expected to provide further insights into the Federal Reserve’s monetary policy stance.
Impact of US Dollar Strength on Gold Price Amid Fed Rate Cut Expectations
The US dollar gained strength despite widespread expectations that the Federal Reserve will start cutting interest rates in September, with a strong likelihood of another cut in December. Current market pricing indicates over a 90% chance of a September rate cut, bolstered by a tame US consumer inflation report released last Thursday.
Additionally, the US Bureau of Labor Statistics reported on Friday that the Producer Price Index (PPI) for final demand increased by 2.6% in June, exceeding the expected 2.3%.
Despite the anticipated Fed rate cuts and rising inflation, the US dollar’s strength could limit gold price gains as investors balance economic stability with potential interest rate adjustments.
China’s economy grew by 4.7% in the second quarter of 2024, down from 5.3% in the first quarter, with retail sales rising 2.0% year-over-year in June, below expectations of 3.1%. Additionally, fixed asset investment grew less than expected at 3.9% year-to-date in June, compared to an anticipated 4.0%.
Therefore, US political tensions and China’s economic challenges, including slower Q2 growth and weaker retail sales and investment data, are likely to support higher gold prices due to increased safe-haven demand amidst uncertainty.
Short-Term Forecast
Gold prices are poised above the $2405 pivot point, facing potential volatility. A break above $2405 could lead to a rally towards $2425, while failure to hold may trigger a selloff towards $2378.
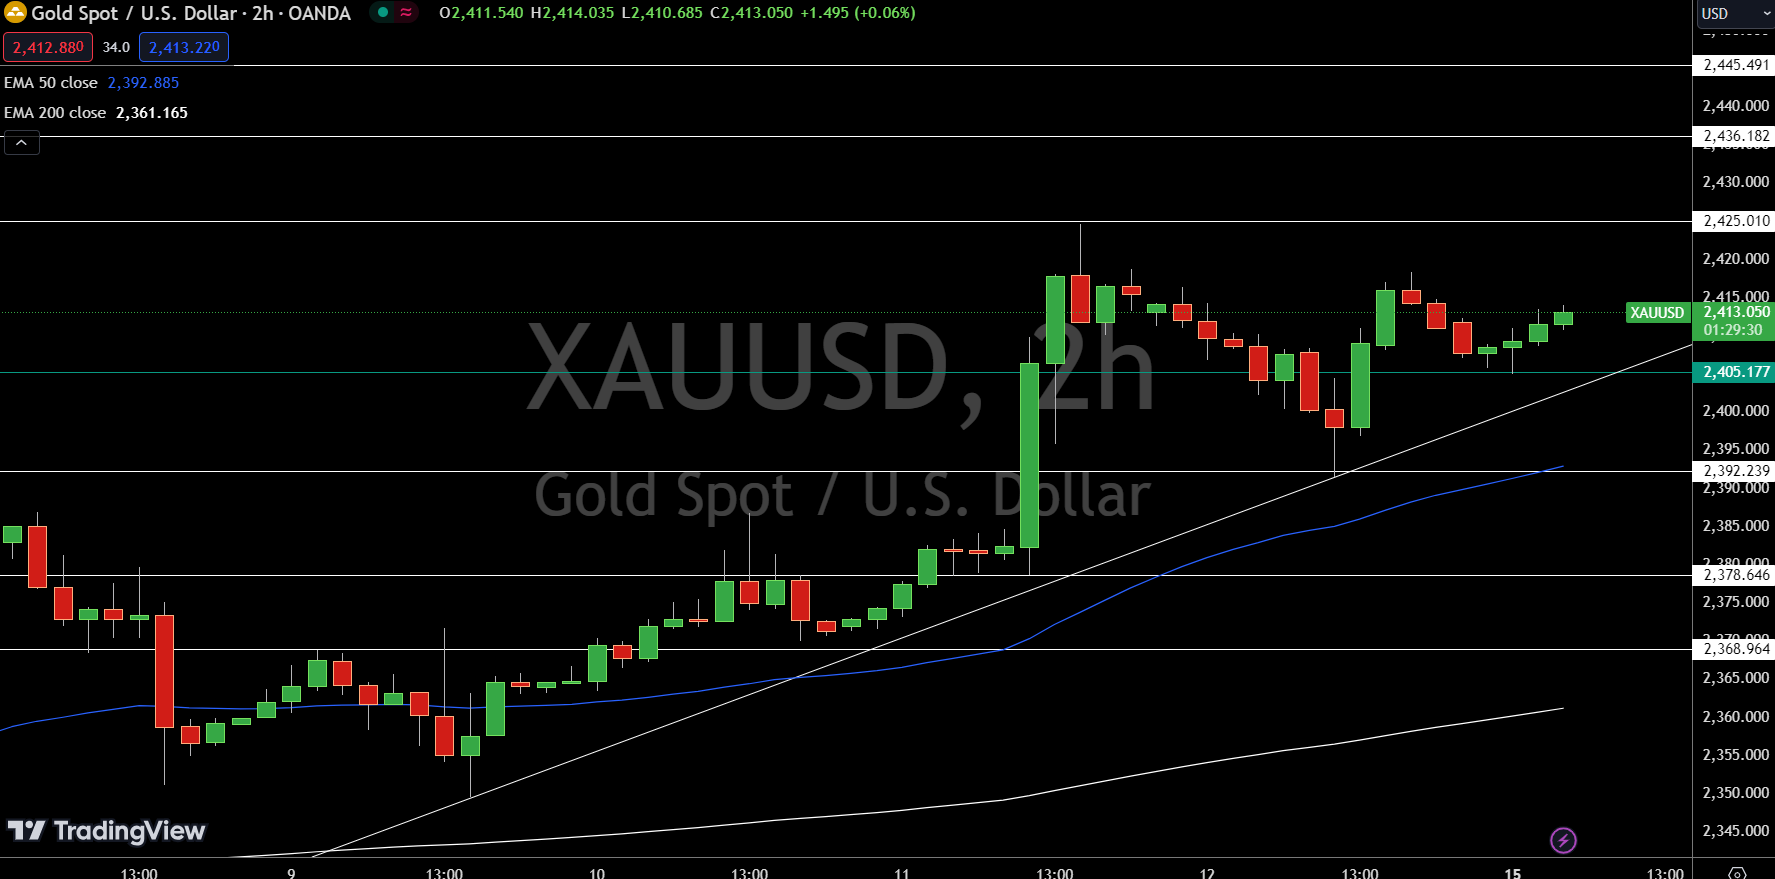
Gold (XAU/USD) prices are precariously perched above the $2405.18 pivot point, up a marginal 0.02% for the day. This level is a key battleground for bulls and bears, as a decisive break above could ignite a rally towards the $2425.01 resistance.
However, failure to maintain this foothold could trigger a sharp selloff, potentially dragging prices towards the 50-day EMA at $2392.89 and further down to the $2378.65 support level.

The 200-day EMA, currently at $2361.17, looms as a significant support zone that could attract buyers if tested. The technical landscape suggests a heightened risk of volatility, with traders closely monitoring the $2405.18 pivot point for directional cues.