
Advertisement
Advertisement

Gold (XAU) Daily Forecast: Will $2327 Resistance Cap Gains?

By
Arslan Ali
Gold (XAU) Daily Forecast: Will $2327 Resistance Cap Gains?

Key Points:

  • Gold prices rallied despite the Fed's hawkish stance.
  • Double top pattern at $2327 poses a key resistance level.
  • Easing inflation and geopolitical tensions support gold prices.

Market Overview

Gold prices retreated below $2330, on Monday. The Federal Reserve’s unexpected hawkish stance last week, forecasting only one interest rate cut in 2024, has bolstered US Treasury bond yields and the US dollar, applying downward pressure on the non-yielding precious metal.

Inflationary Pressures Ease, Rate Cut Hopes Linger

Despite the Fed’s hawkishness, recent data indicating easing inflationary pressures in the US, including softer consumer and producer prices and a decline in import prices in May, keep alive the possibility of two rate cuts this year.

This, along with geopolitical tensions and political uncertainty in Europe, is providing some support to gold prices and limiting further downside.

Fed Officials’ Diverging Views Add Uncertainty

While some Fed officials, such as Cleveland Fed President Loretta Mester, have expressed openness to rate cuts if inflation continues to decline, others, like Chicago Fed President Austan Goolsbee and Minneapolis Fed President Neel Kashkari, are advocating for a more cautious approach.

This divergence in views adds to the uncertainty surrounding the Fed’s rate-cut path, potentially limiting further dollar appreciation and providing a floor for gold prices.

Short-Term Forecast

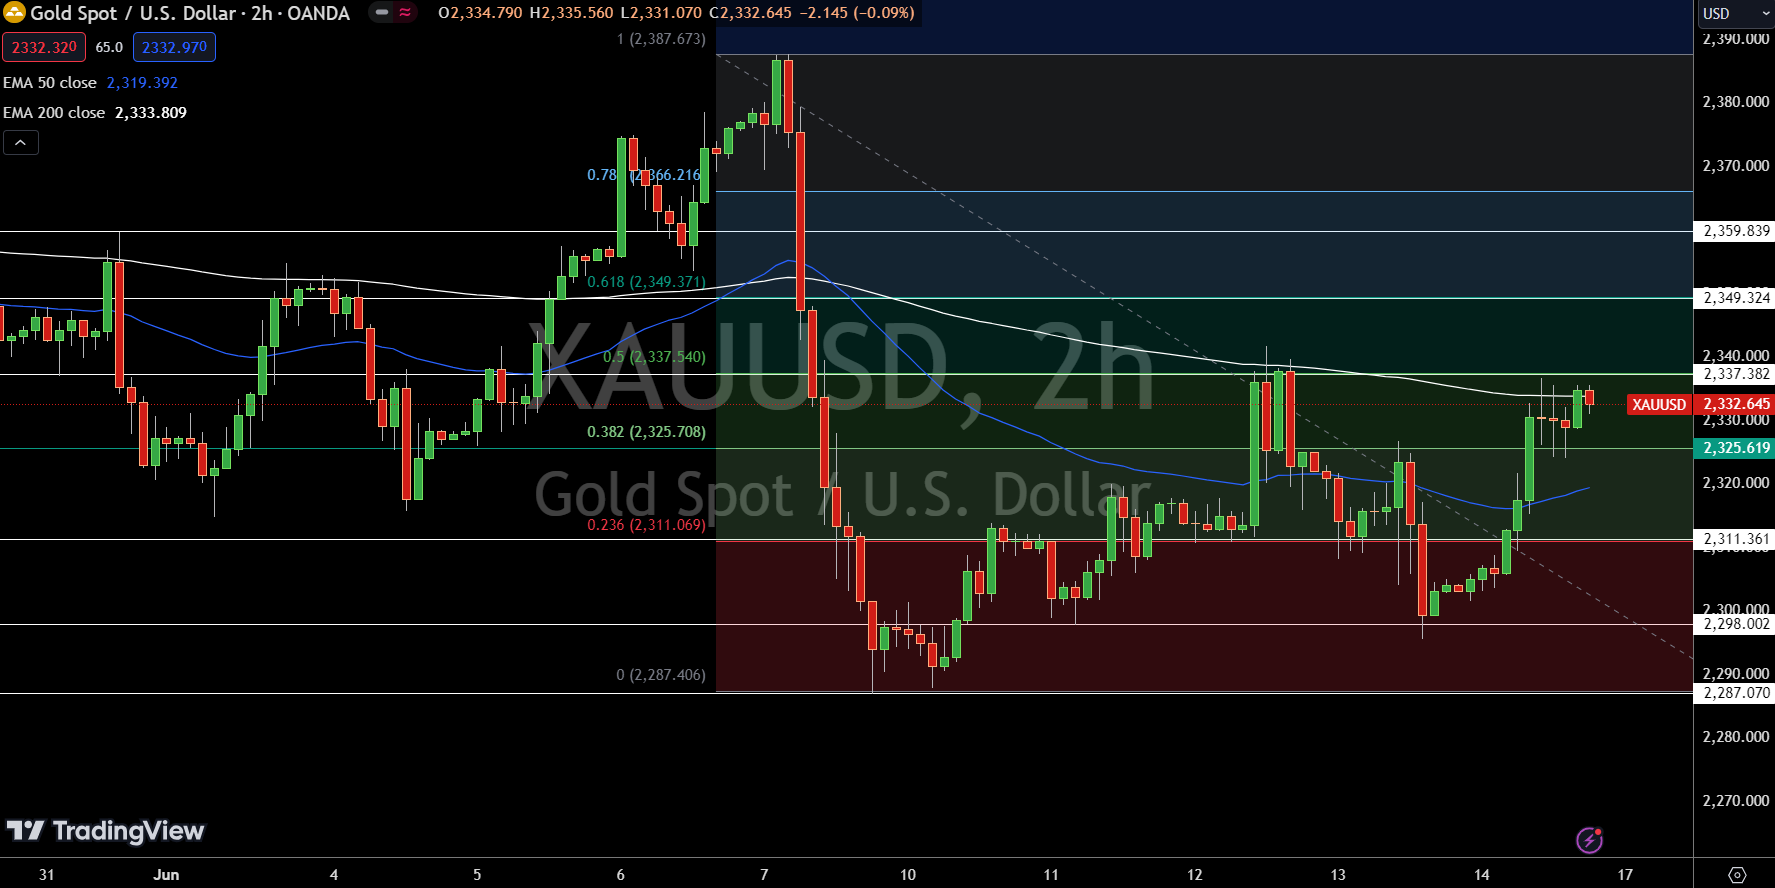
Gold prices rallied on Monday despite recent Fed hawkishness, trading at $2332.64. A double top pattern at $2327 presents resistance, but a break above could fuel bullish sentiment towards $2337.38 and $2349.32.
 

Gold Prices Forecast: Technical Analysis

Gold - Chart
Gold – Chart

Conversely, a sustained move below $2327 could confirm the bearish bias, with immediate support at $2311.36 and further downside potential towards $2298.00 and $2287.07. The 50-day EMA currently sits below the 200-day EMA, suggesting a potential bearish crossover. Traders should closely monitor the $2327 level for a breakout or breakdown.

About the Author

Arslan AliTechnical Analysis Expert

Arslan is a finance MBA and also holds an MPhil degree in behavioral finance. An expert in financial analysis and investor psychology, Arslan uses his academic background to bring valuable insights about market sentiment and whether instruments are likely to be overbought or oversold.

Advertisement