



Gold Is Not Getting Any Help From Cheaper Oil
Oil has been falling for nearly a week. Gold is falling with it. The inflation relief from cheaper crude should be helping a non-yielding metal and it is doing nothing. The dollar negated Tuesday’s failed breakout by Wednesday morning and is sitting at a new recovery high. The 10-year yield pulled back from 5.041% last week and stopped pulling back at 4.920%.
Gold reached $4,369.56 early Wednesday, turned lower before it could test the retracement zone, and is back on the same support area it tested Tuesday.
At 07:52 GMT, Spot Gold is trading $4,324.97, down $33.57 or -0.77%. The session high is $4,369.56 and the low is $4,319.52.

The Dollar Took Back Tuesday’s Failed Breakout
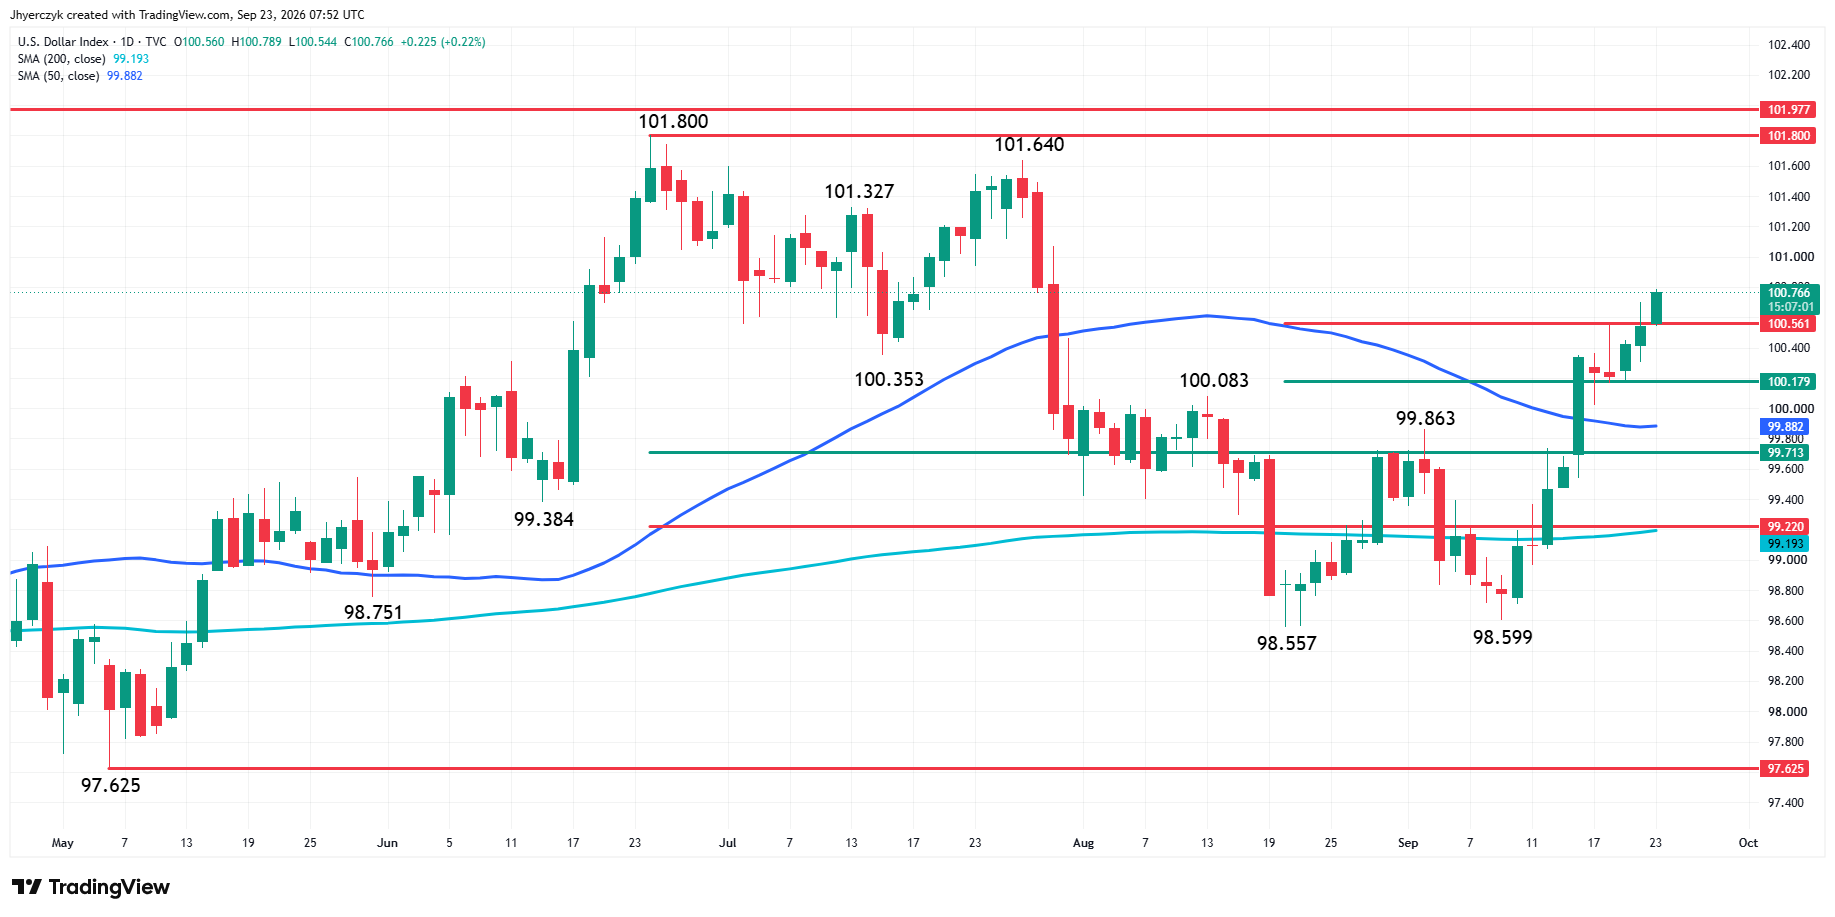
The Dollar Index cleared 100.561 Tuesday, reached 100.667, and gave the breakout back after the Iran headline knocked crude lower. Gold bounced into the close on that reversal. Wednesday morning the DXY opened at 100.560, pushed to 100.789, and is holding near 100.766. The level that was resistance Tuesday is now support.
The move is not coming from a new oil shock. Crude is lower for a sixth straight session. The dollar is moving because the rate trade underneath it has not let go. The Fed raised last week. Warsh left the door open. Musalem, Goolsbee, and Collins all reinforced the inflation argument this week. Tuesday’s dollar reversal was a warning for the bulls. Wednesday says the warning did not hold.
The next resistance on the DXY is the 101.327 to 101.640 range. The main high at 101.800 sits above it. Gold buyers expected falling oil to take the dollar off its recovery. Six sessions of cheaper crude later, the dollar is making new highs.
The 10-Year Stopped Pulling Back Without Giving Up
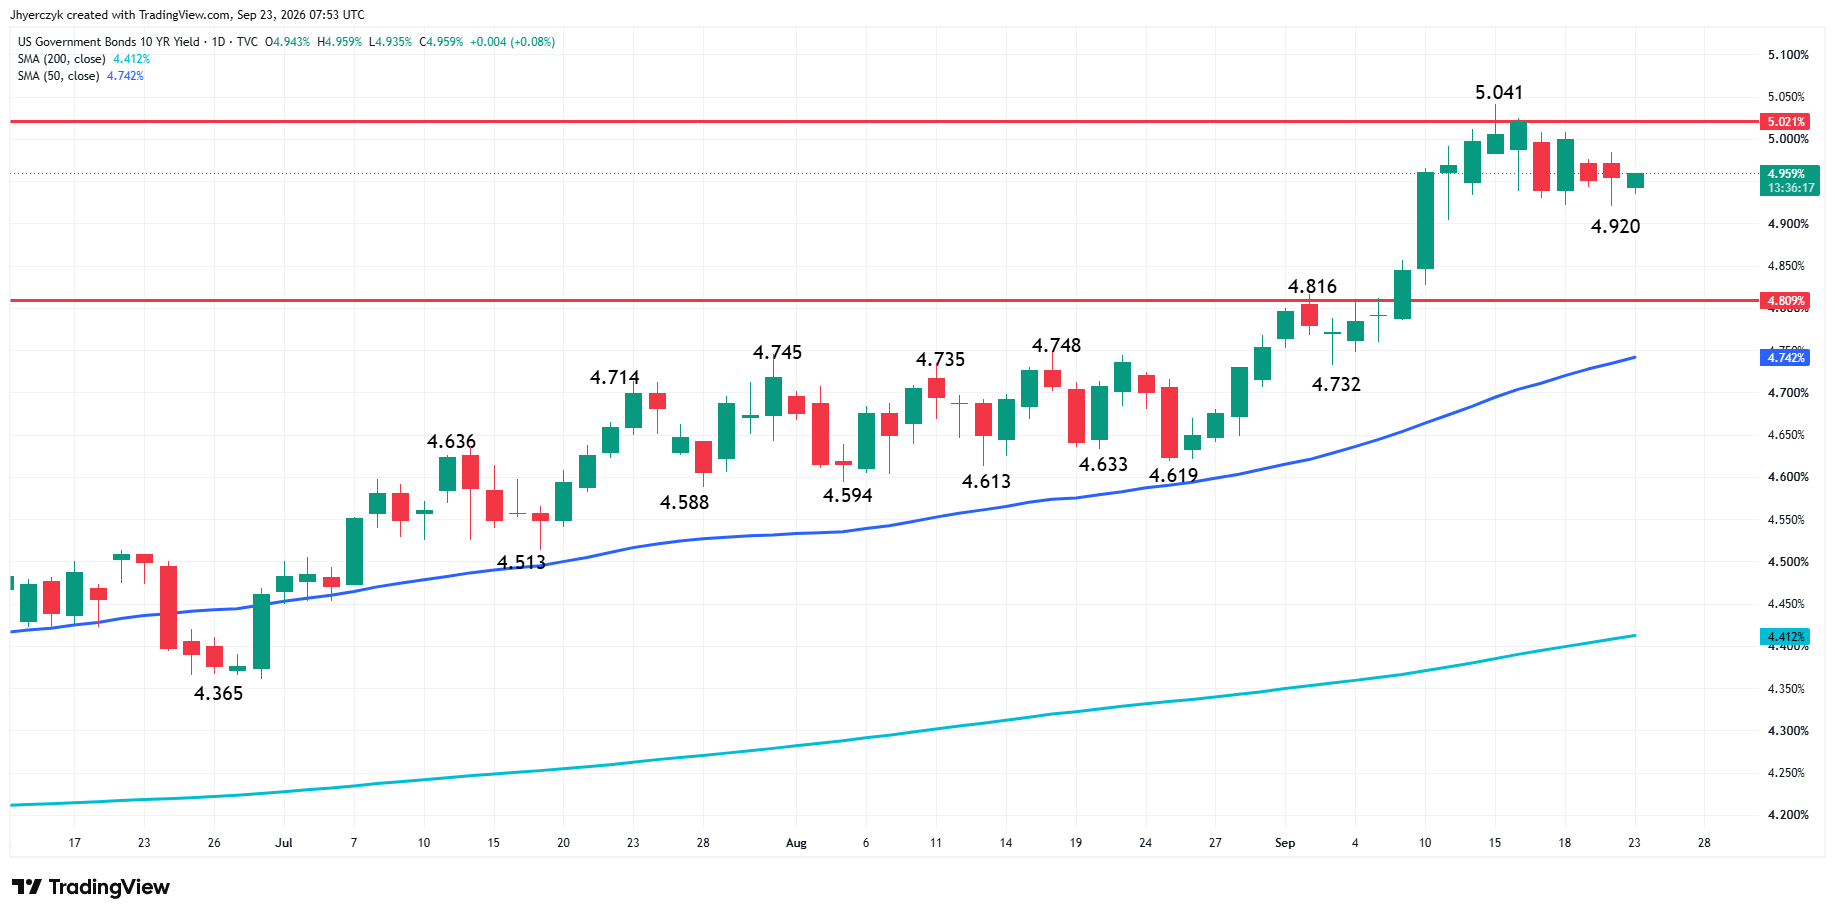
The 10-year yield is trading 4.959%, up 0.004 percentage points at 07:53 GMT. The session high is 4.959% and the low is 4.943%.
Gold Price Forecast
Every new Gold analysis as it publishes, today's technical signal and key levels, live price — on one page.
See all Gold forecastsLast week it reached 5.041%. The pullback found a floor at 4.920% and held it twice. The 4.809% breakout level is below. The 50-day at 4.742% is well below that. The yield backed away from 5% and stopped before it could change anything. Gold is trading against a rate market that is pausing near the highs, not retreating from them.
Six Sessions of Lower Crude and the Fed Has Not Blinked
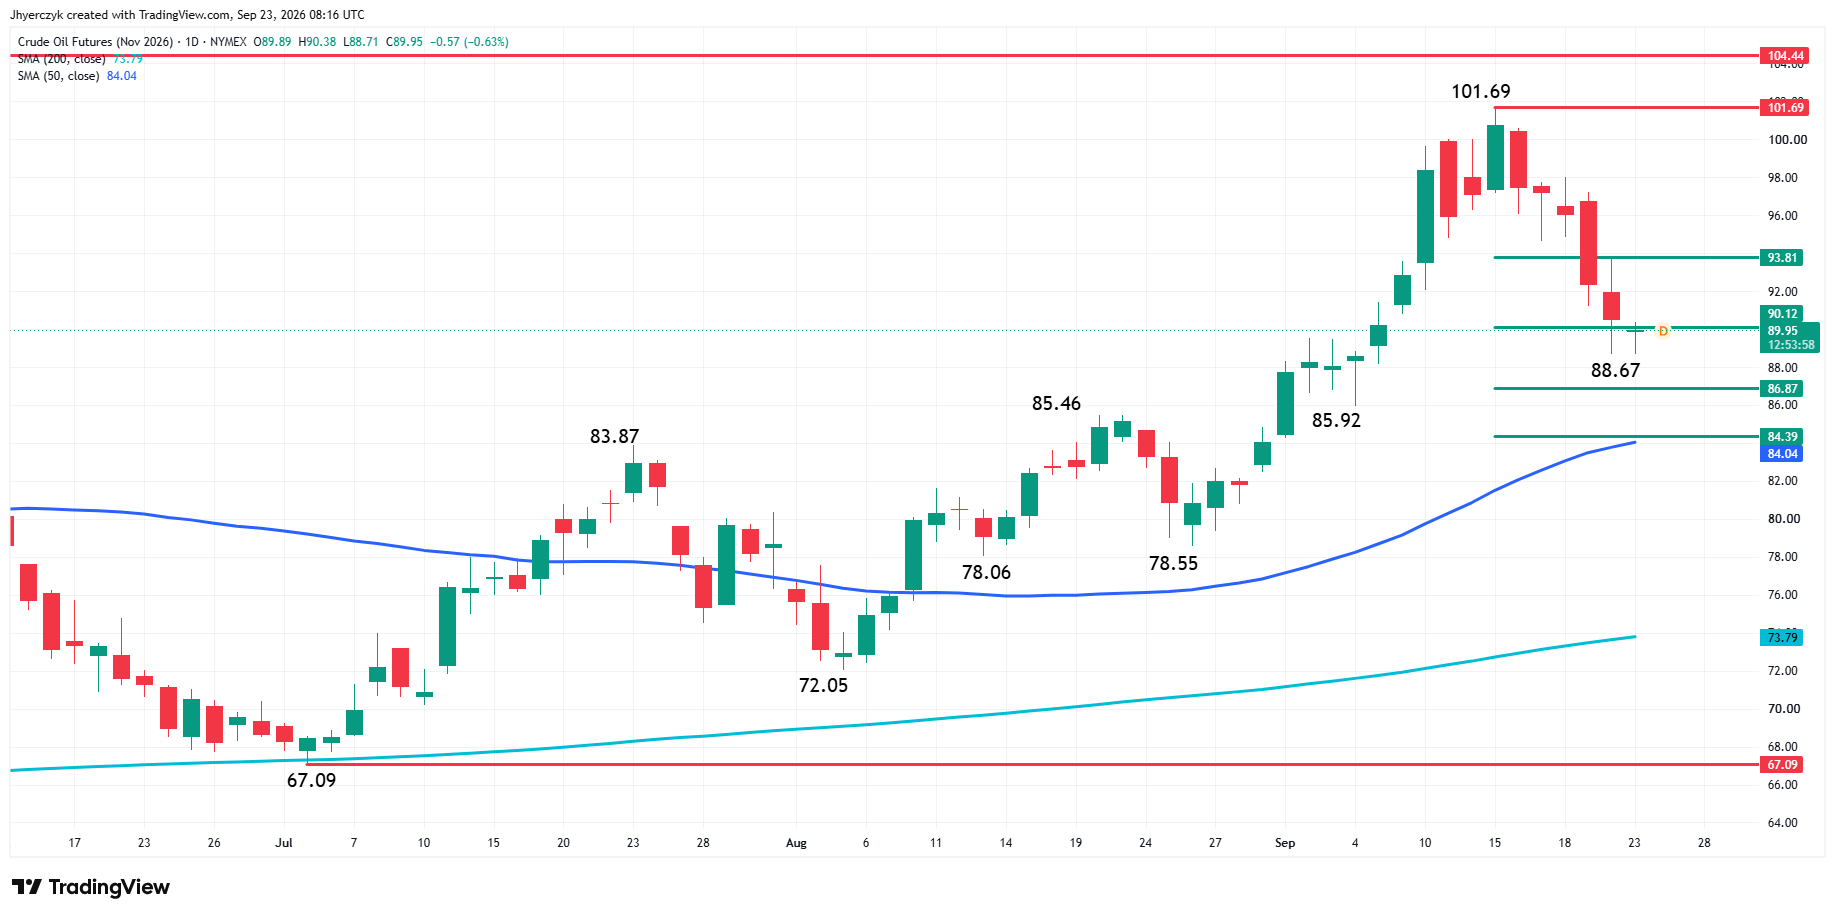
Oil is lower as diplomatic reports raise hopes about the Strait of Hormuz and Saudi Arabia resumes operations on the East-West Pipeline. Brent is still near $100. WTI is still above $90. The market removed some of the supply premium. It has not returned to a normal energy market.
Collins backed last week’s rate increase. Musalem and Goolsbee are looking at strong demand, services inflation, and data center construction. The Fed raised to 3.75%-4.00% and the Bank of Japan and ECB have both tightened recently. Six sessions of cheaper crude and three central banks moving in the same direction. Gold is caught between them.
The UNGA meetings in New York are the headline risk on the crude side. The Iran reports moved oil without a deal. A real diplomatic step keeps crude lower. A denial or a fresh threat puts the premium back on the screen. Either way, the Fed side of the gold trade has not responded to cheaper oil and that is what matters for the metal.
The Breaks Keep Finding Buyers and the Buyers Are Not Traders
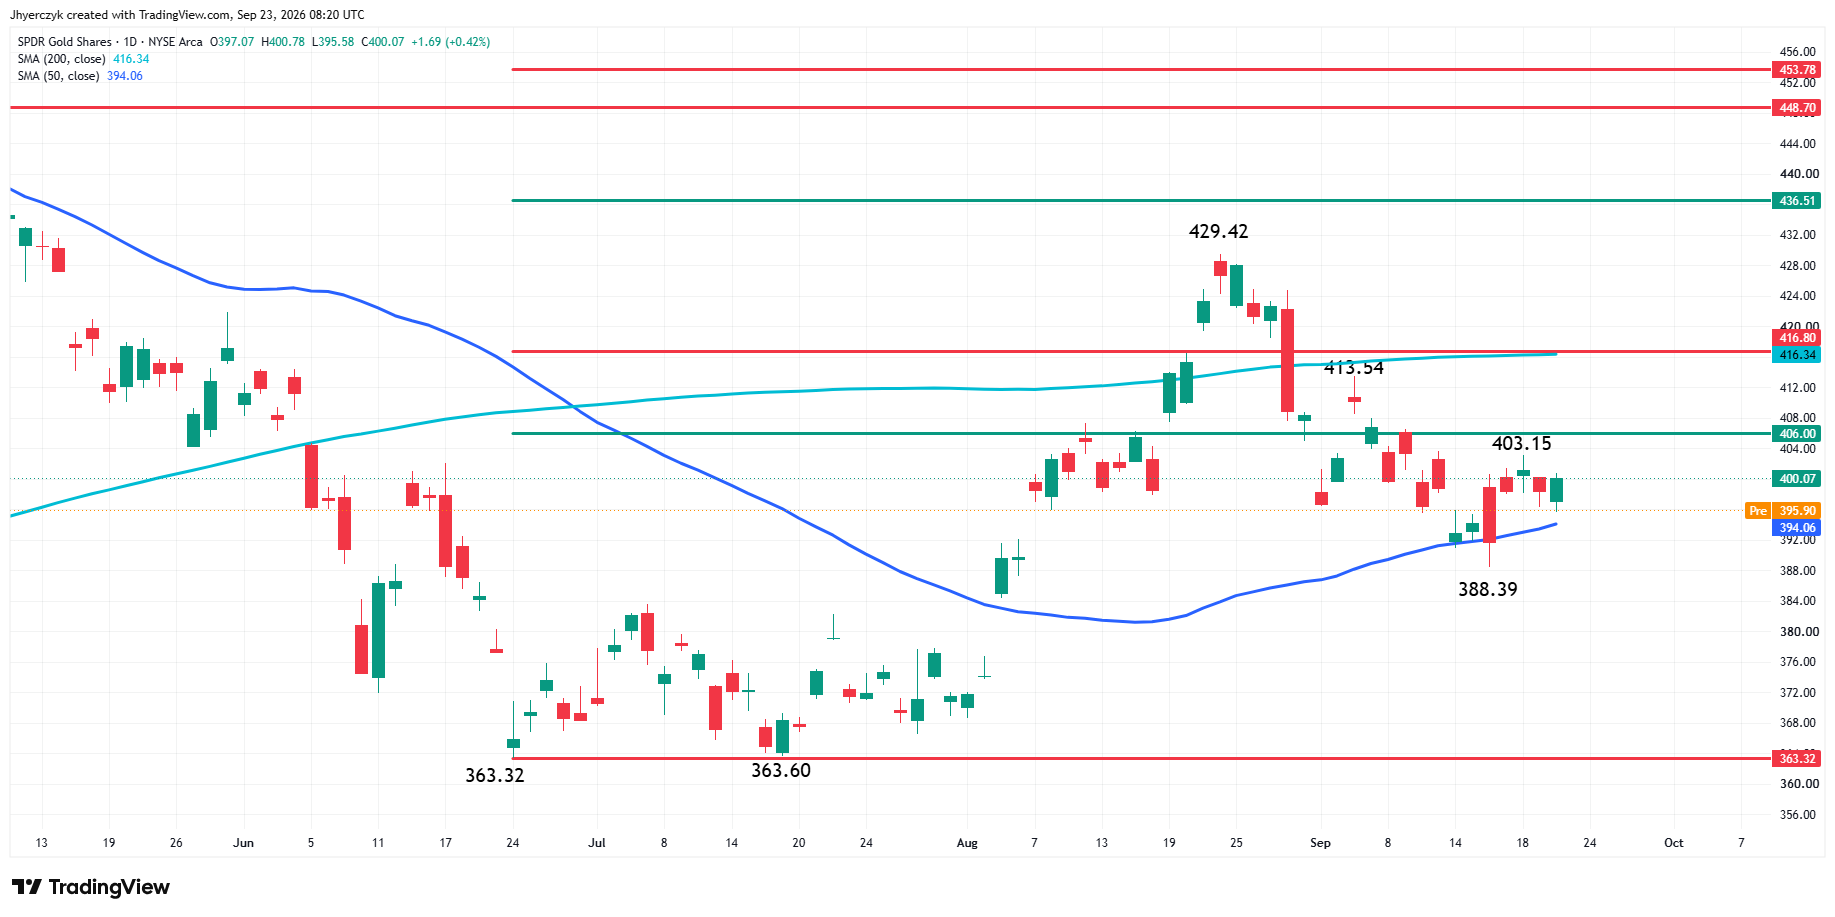
About 50 tonnes have moved into gold-backed ETFs so far in September, putting the sector on track for a third consecutive month of inflows according to ANZ. China imported about 1,000 tonnes in the first eight months of 2026. Chinese gold ETFs added roughly 44 tonnes in August. The People’s Bank of China increased purchases by about 20 tonnes during the month.
That is why every break attracts buying before it can run. Rate traders are selling strength as the dollar climbs. Physical, ETF, and central bank demand is waiting below the market. The first group controls the daily session. The second group is why the downside does not open without a fight.
BMI kept its 2026 average gold price forecast at $4,400 per ounce with a long-term floor near $3,800 based on geopolitical risk and central bank purchases. That is not a reason to ignore what the dollar and yields are doing this week. It is the reason gold has not broken down despite a week of pressure from both.
Daily Spot Gold Technical Analysis
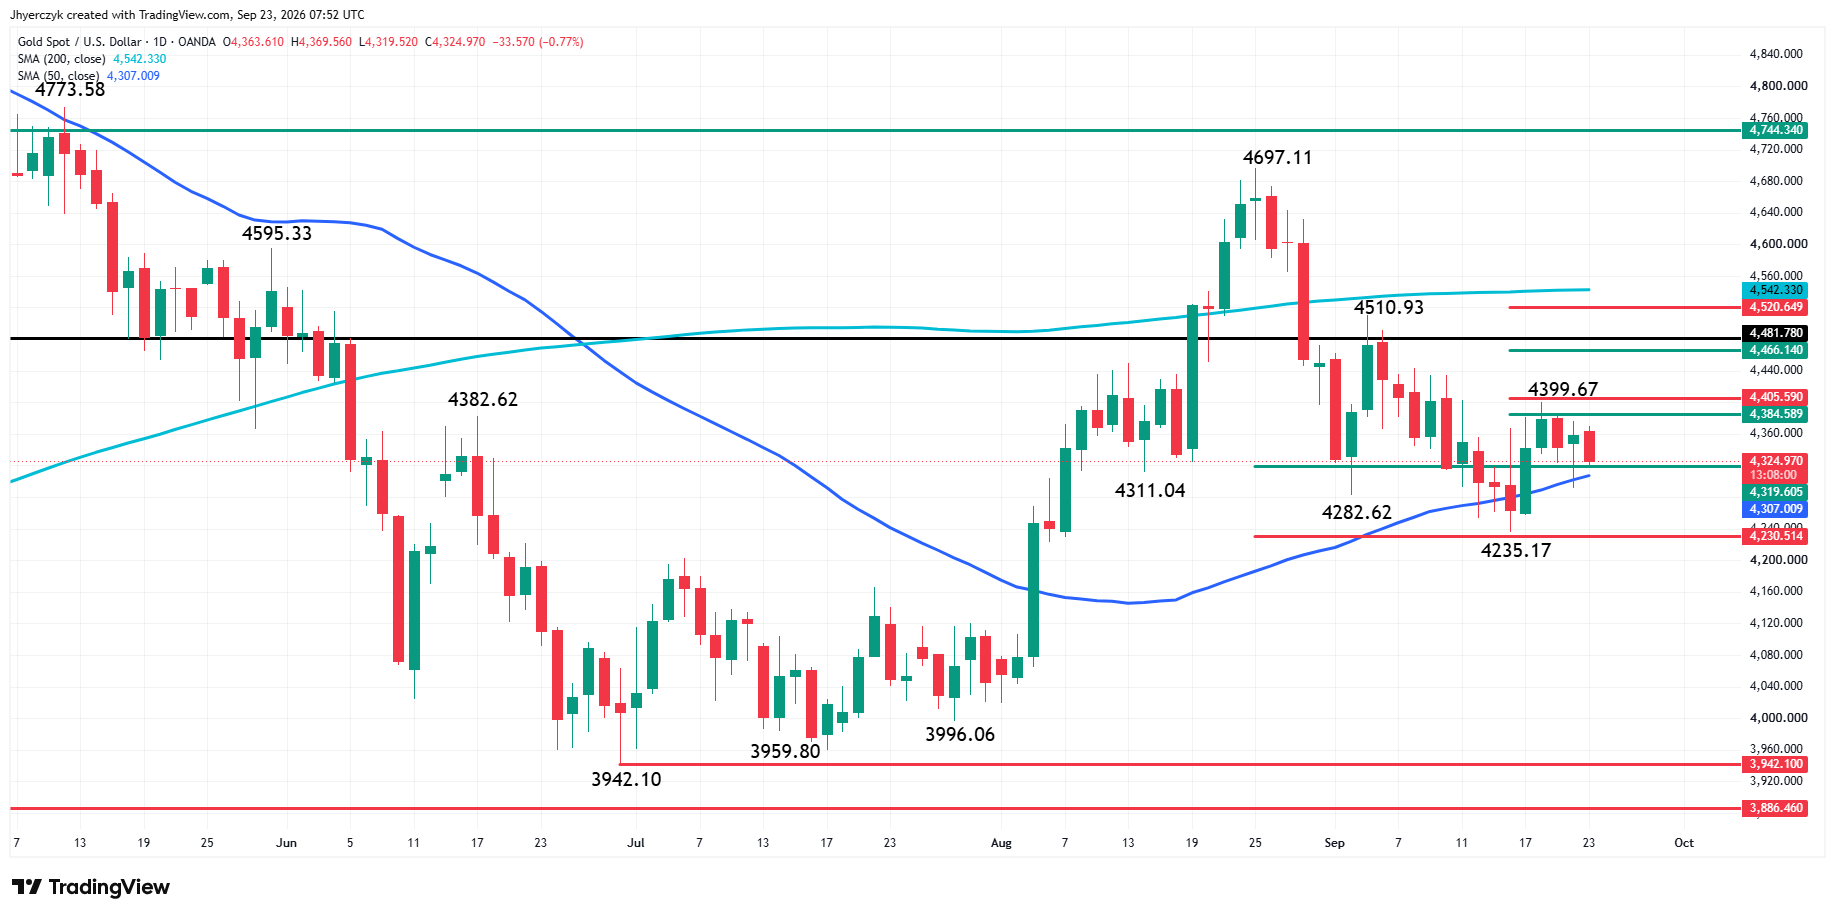
Spot gold is lower early Wednesday. The main trend is down according to the daily swing chart. A trade through $4,399.67 will change the main trend to up. A move through $4,235.17 will reaffirm the downtrend.
Gold reached $4,369.56 early Wednesday and turned lower before it could test the $4,384.59 to $4,405.59 retracement zone. The failed rally leaves sellers in control below that area.
The market is testing the short-term 50% level at $4,319.60. The 50-day moving average at $4,307.01 sits just below it. A sustained move through the moving average could trigger a break into the support cluster at the $4,235.17 main bottom and the $4,230.51 61.8% level.
My bias is to the downside because the daily swing chart is down, the dollar has resumed its recovery, and yields are holding close to last week’s high. Reclaiming the retracement zone would weaken the bearish outlook. Taking out the 50-day moving average would strengthen it.
What to Watch
The dollar is the first screen. It recovered 100.561 after failing there Tuesday. The 101.327 to 101.640 range is the next test. Gold does not need a new dollar high to stay under pressure. It needs the dollar to hold above 100.561 and keep overseas buyers paying more for the metal.
The 10-year is holding above 4.920% after two tests. A break under that level gives gold buyers their first real help from the rate market this week. A move back through 5% puts the pressure right back on. The UNGA sessions are live. The Iran reports moved crude without a deal. A real step forward keeps oil lower and takes one argument away from the hawks. A setback gives the Fed story another leg.
Gold is sitting on the 50% level with the 50-day just below it. The support cluster near $4,235 is the next target if the average gives way. The ETF and central bank demand underneath the market is real. The daily trade belongs to the dollar and yields. Until one of them cracks, gold keeps testing support and sellers keep sitting inside the retracement zone above.
If you’d like to know more about how to Spot gold, please visit our educational area.


