


Bullish Momentum Pushes Toward Initial Target
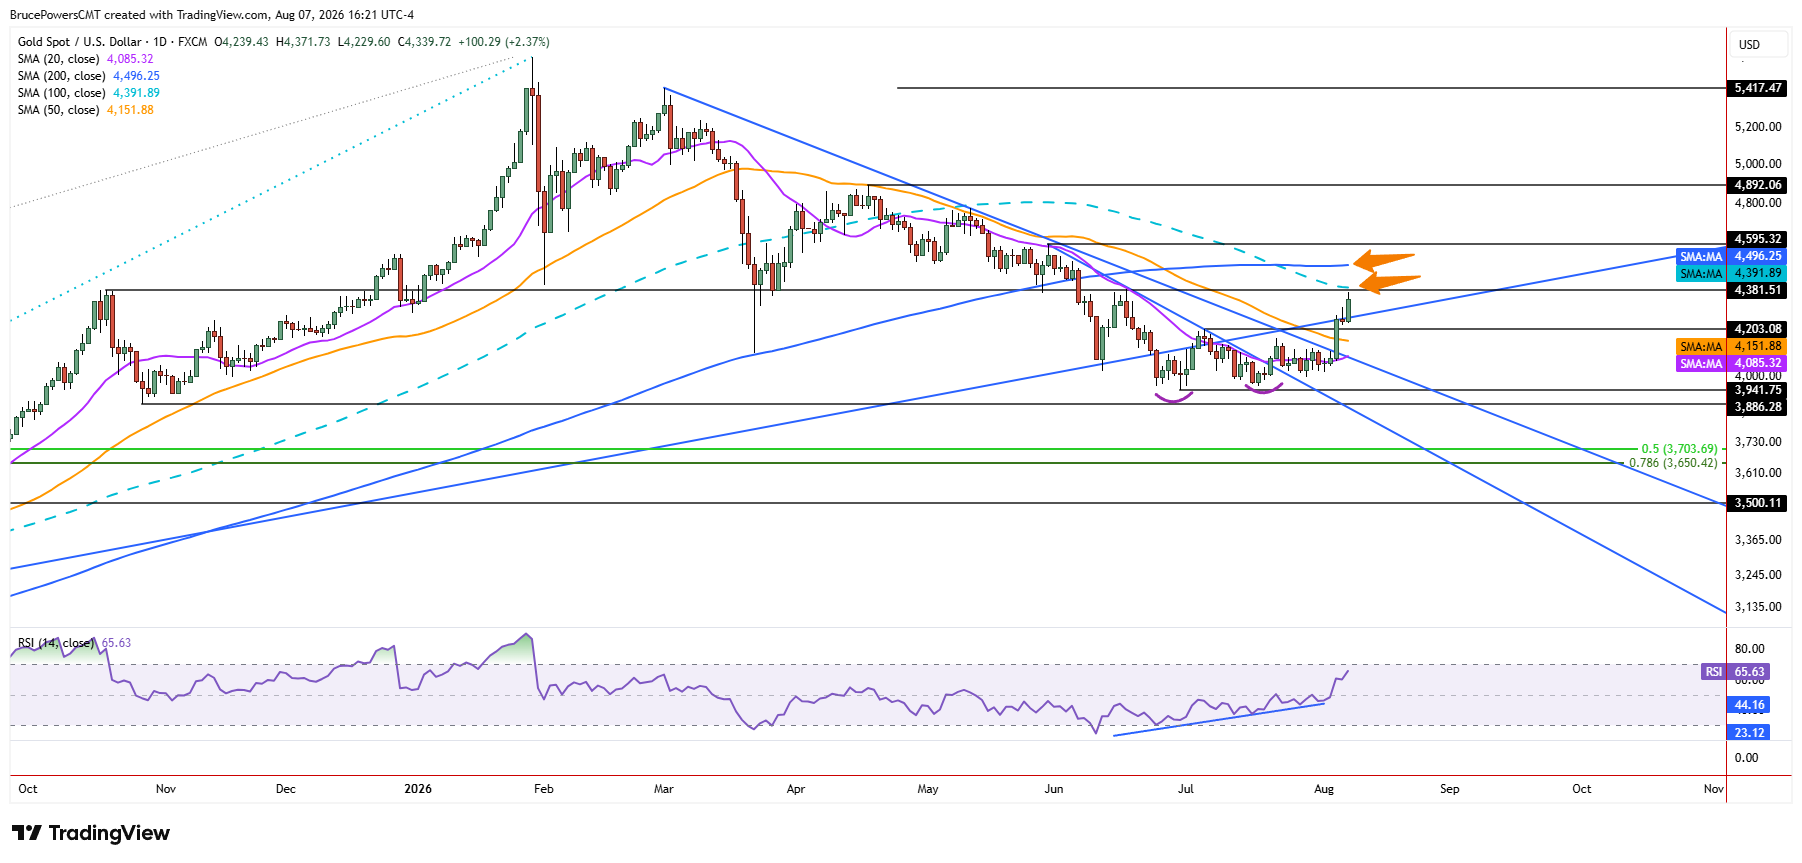
Gold rallied to a high of $4,372 on Friday, as it extended recent gains following a series of recent trend reversal signals. It is on track to close the session in the upper third of the day’s range, underscoring the strength of the advance. At the same time, an initial target near $4,382 was almost reached, suggesting that the target may have been close enough to have already been met in practical terms.

Resistance Converges Near $4,392
The falling 100-day moving average near $4,392 provides another indication of a potential resistance zone and therefore an initial upside target, along with the $4,382 price zone. That level originates from the peak in October 2025 and was subsequently confirmed as resistance a couple of times since then, including recently, with the lower swing high in mid-June.
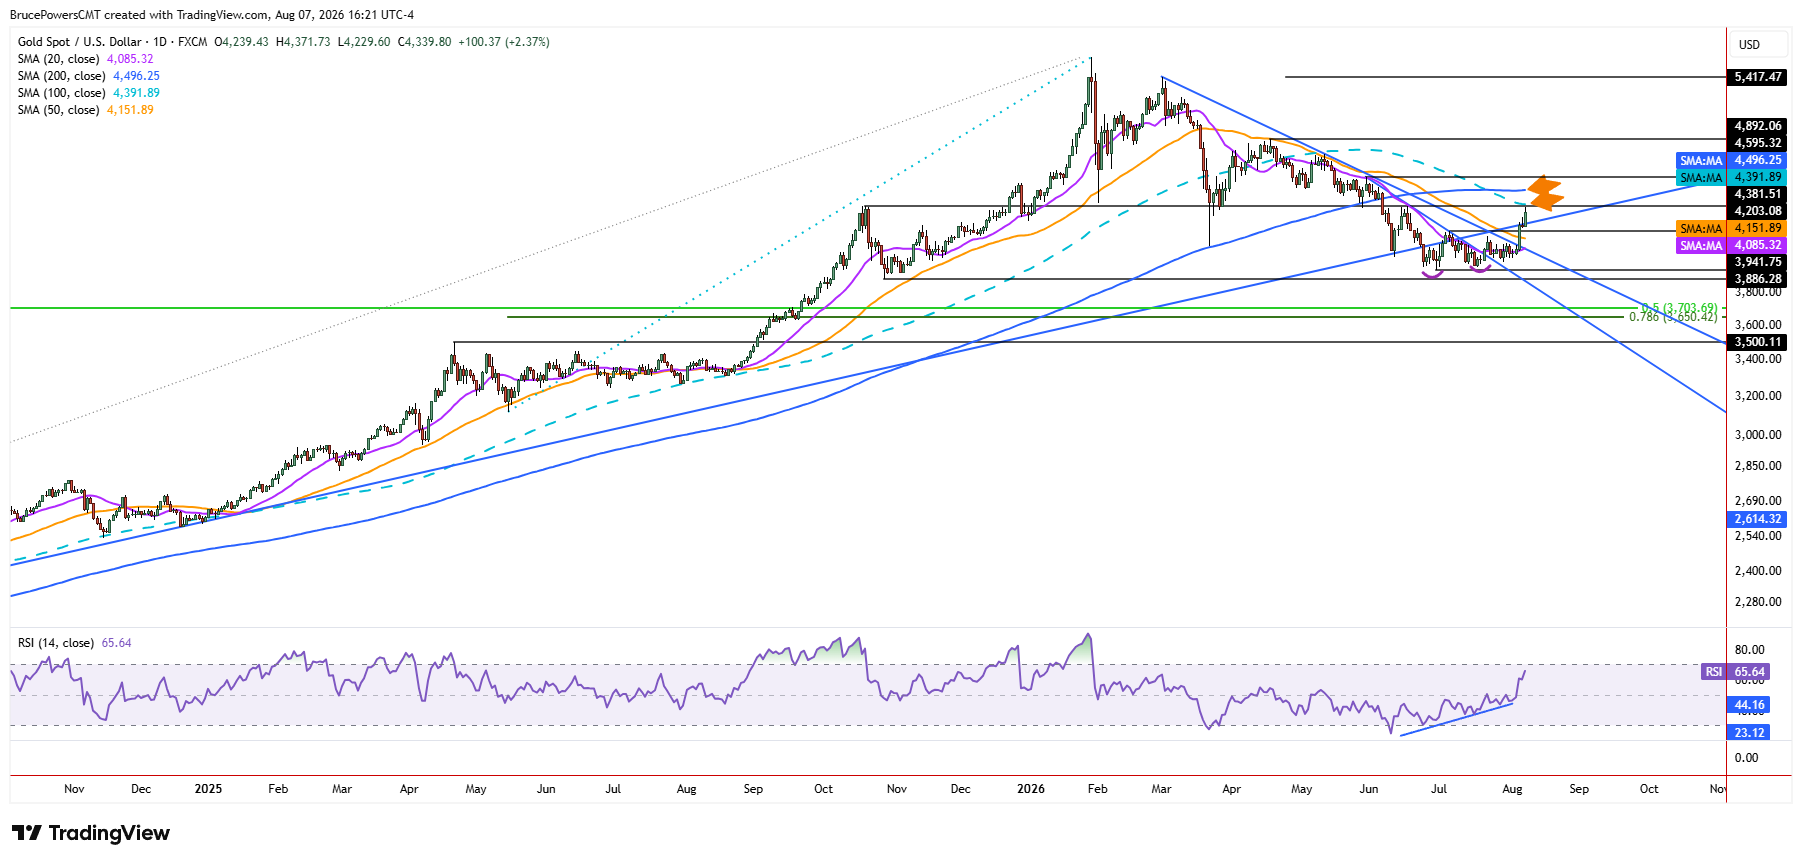
For now, the 100-day moving average presents key resistance that could lead to a pullback or consolidation. However, the next higher target is defined by the 200-day moving average, now near $4,496. It represents a more significant resistance zone given its long-term timeframe and therefore may be tested before the current advance reaches its conclusion. The path toward that higher target, however, may depend on how gold responds to the initial resistance near $4,392.
Trendline Recovery Strengthens the Bullish Case
Friday’s extension of the rally confirmed a recovery above the long-term uptrend line that had shown signs of resistance over the past couple of days. A recovery above the trendline is another piece of bullish technical evidence for gold. It follows the recent reclaim of the 20-day and 50-day moving averages, a breakout above a downtrend line, and a trend reversal signal on a move above the lower swing high at $4,203. Together, these developments strengthen the case that the broader trend has shifted back in favor of the bulls.
Next Test: $4,382-$4,392
Near-term support is Friday’s low of $4,230, especially since it aligns closely near the uptrend line, followed by the lower swing high at $4,203. Key dynamic support is indicated by the 50-day moving average near $4,152. The magnitude of any pullback will assist in gauging demand, and it may determine whether the 200-day moving average is tested, if it doesn’t occur during this initial sharp advance.
Gold Price Forecast
Every new Gold analysis as it publishes, today's technical signal and key levels, live price — on one page.
See all Gold forecastsThus, Friday’s strong close not only reinforces the recent bullish reversal but also sets up the next test: whether buyers can push through the $4,382-$4,392 resistance zone without a meaningful pullback, keeping the higher $4,496 target in view.
If you’d like to know more about how to trade gold and silver, please visit our educational area.


