Gold News: Fed Minutes and Iran Tensions Drive Precious Metals
The gold and silver markets on August 18 have been pulled in opposite directions by the Federal Reserve and the geopolitical situation. The Federal Reserve made quite a few market participants optimistic that the Fed was paying attention to recent employment and inflation data, and an estimated 65% expectation that no interest rate change would happen in September. Investors are looking to the minutes of the Fed meetings on Wednesday to see the level of concern the Fed has for the weakening economy.
The geopolitical situation has become volatile with Iran moving to an offensive military stance after the decline of the U.S. and Iran negotiations. The Strait of Hormuz has disrupted energy supplies and created increasing conflict. Higher oil costs have pushed the longer term Treasury yields increasing, disrupting the non-yielding metals and creating a headwind as geopolitical issues give a defensive boost to precious metals.
The desire for gold is still strong in many markets. Central banks bought a record 289 tonnes of gold for about $45 billion in the second quarter, and China bought about 20 tonnes in July. A World Gold Council poll revealed that 45% of reserve managers planned to boost their inflows of gold and are continuing to favor gold and diversification away from other reserve assets.
Silver currently has a tighter physical-market backdrop. The Silver Institute anticipates another annual deficit of approximately 67 million ounces in 2026, despite a projected total supply increase of 1.5 percent to approximately 1.05 billion ounces. Other market participants are anticipating a reduction in industrial fabrication of 2 percent to 650 million ounces, as the solar industry is projected to use less silver. In contrast, it is anticipated that physical investment will increase by 20 percent to approximately 227 million ounces, and other long-term demand drivers, such as the development of the electronic, artificial intelligence, and energy and power grid infrastructures, will provide robust demand.

Gold Technical Analysis: XAU/USD Holds Rising Trendline as $4,448 Resistance Caps the Advance
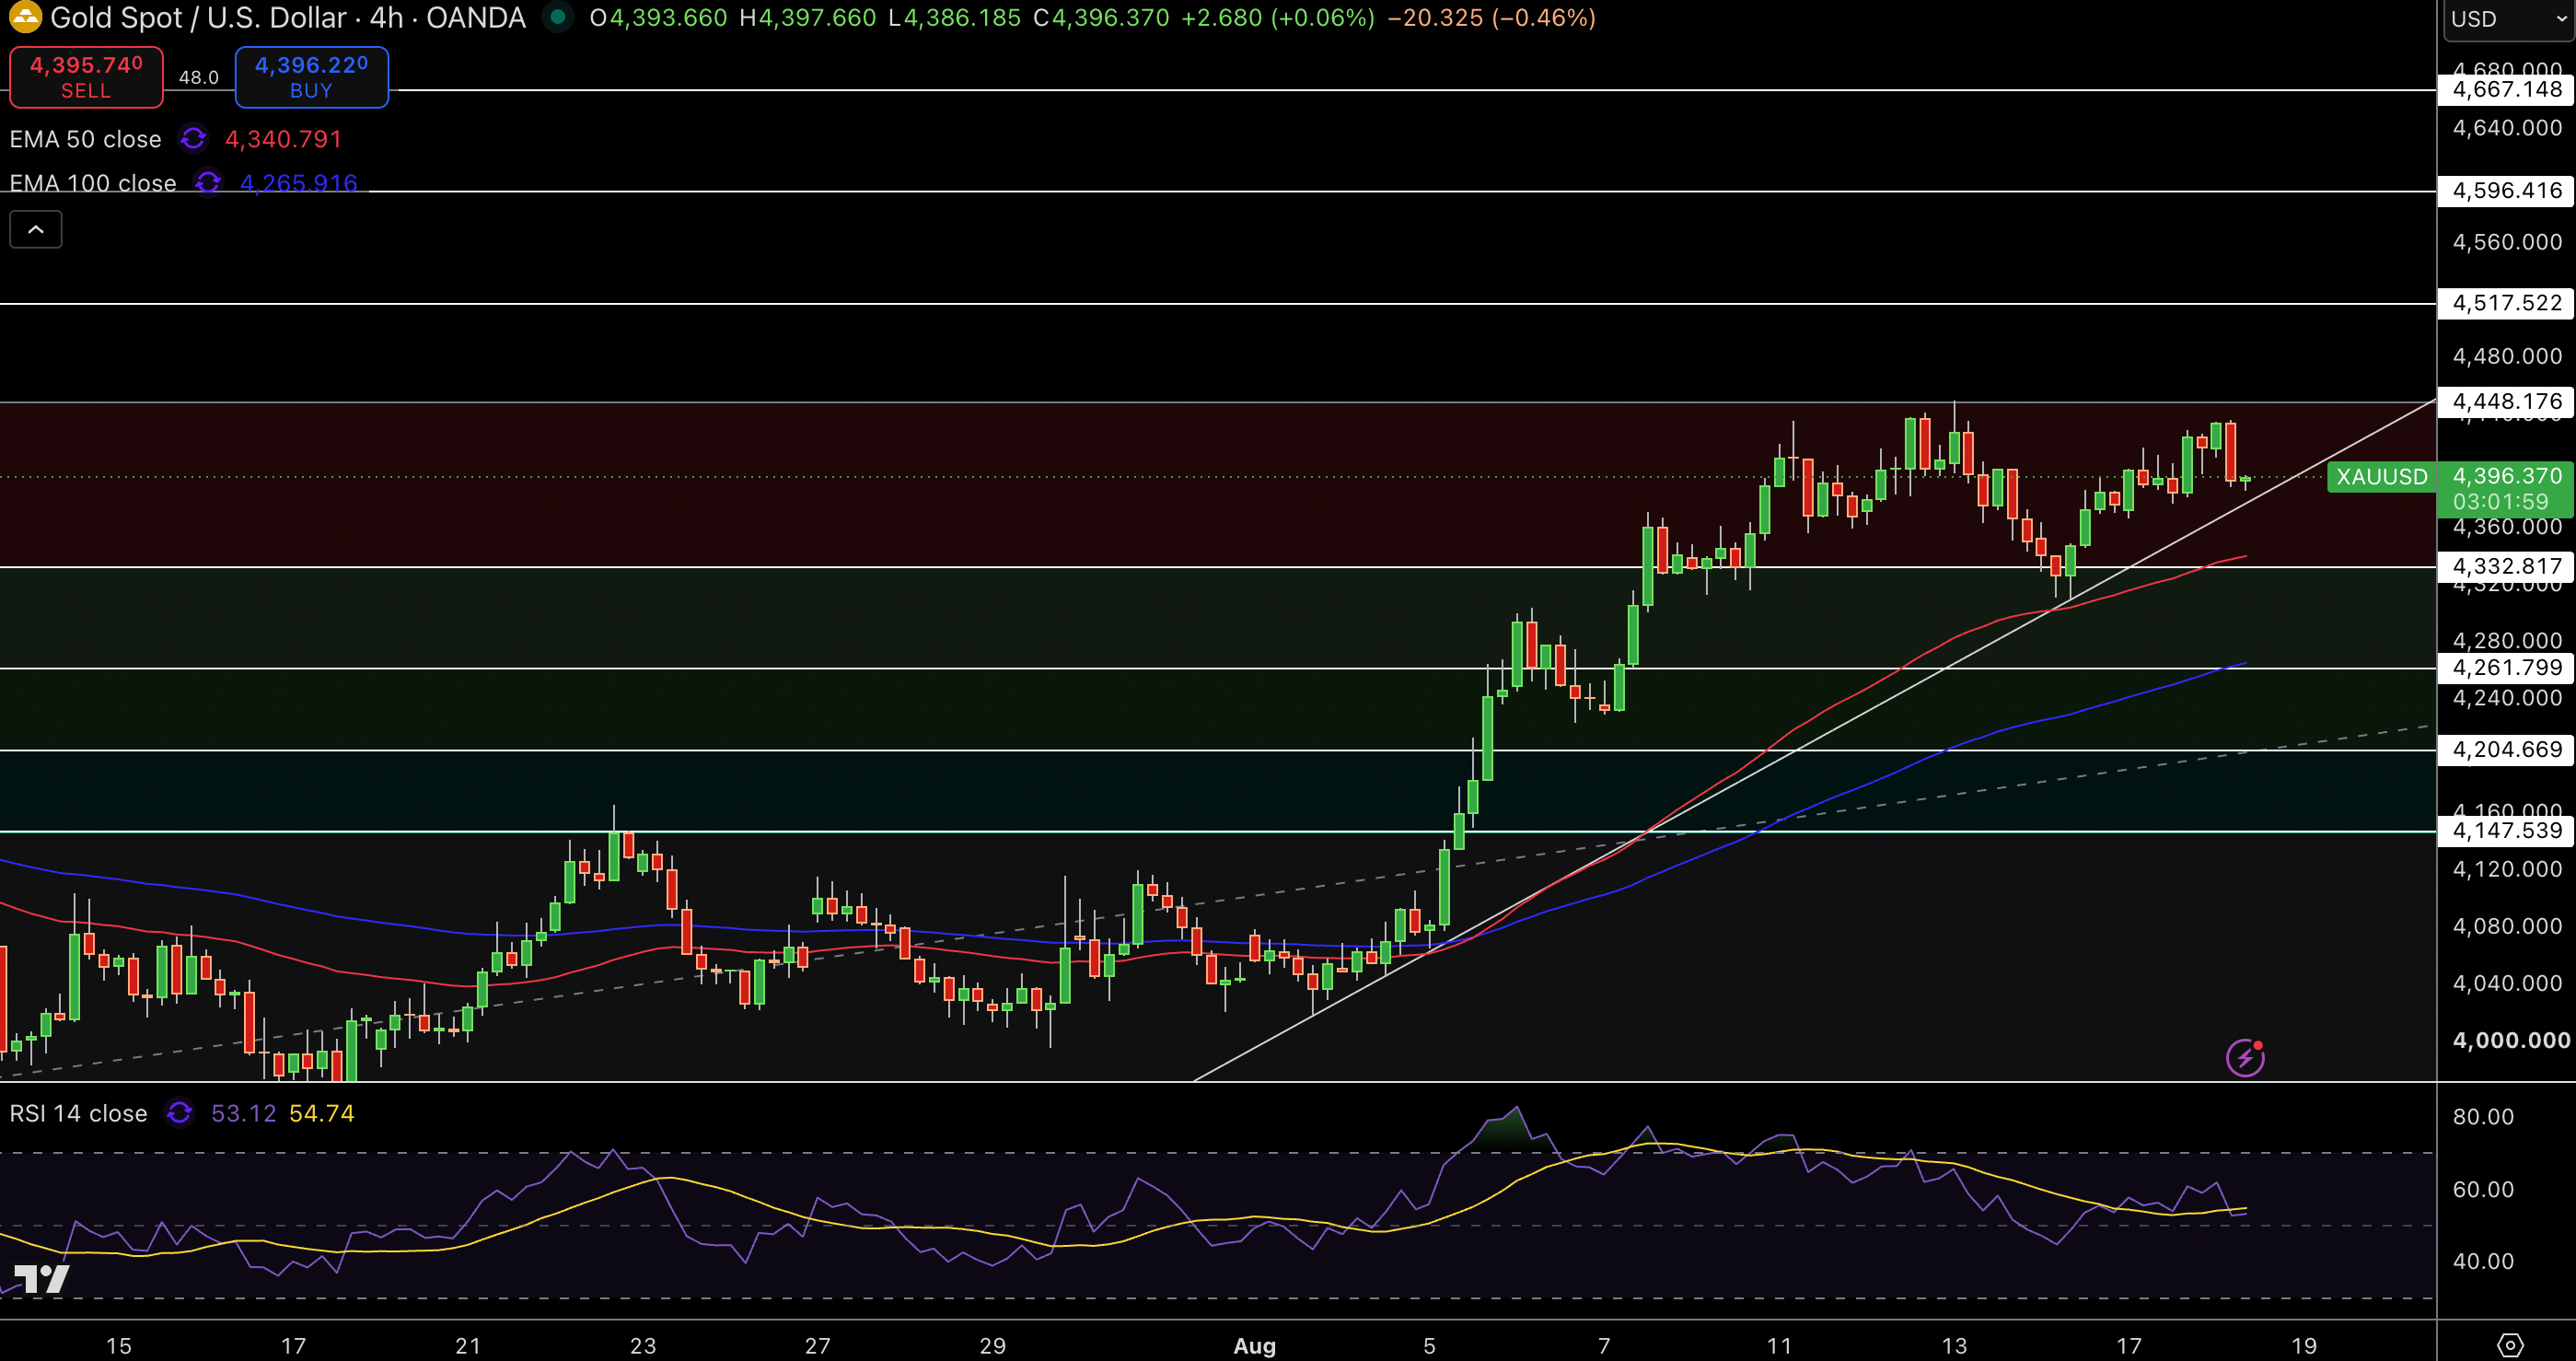
Gold is currently selling for $4,396 on the 4-hour chart, and although price is above the rising trendline that has been a recovery aid for August, it is currently trading in the middle of a sideways consolidation. Price is comfortably trading above the 50-EMA, which is around $4,341, as well as the 100-EMA, which is around $4,266. The recent price action shows consolidation around the resistance area of $4,448, after a few price attempts to move higher. A rebound from the rising trendline shows that bulls are stepping in to buy the dips.
An RSI around the 53 level is neutral to slightly positive and may show another bullish continuation. Resistance sits at $4,448 and $4,518, and above that sits $4,596. The first support sits around $4,333, and after that it comes in at $4,262 and $4,205.
In my opinion, gold is going to remain bullish as long as it’s trading above $4,333 and the rising trendline. A break above $4,448 may result in further bullish continuation to $4,518, and if $4,333 is lost, this may result in a deeper bearish move.
Gold Price Forecast
Every new Gold analysis as it publishes, today's technical signal and key levels, live price — on one page.
See all Gold forecastsSilver Technical Analysis: XAG/USD Tests Rising Channel Support Near $65.00
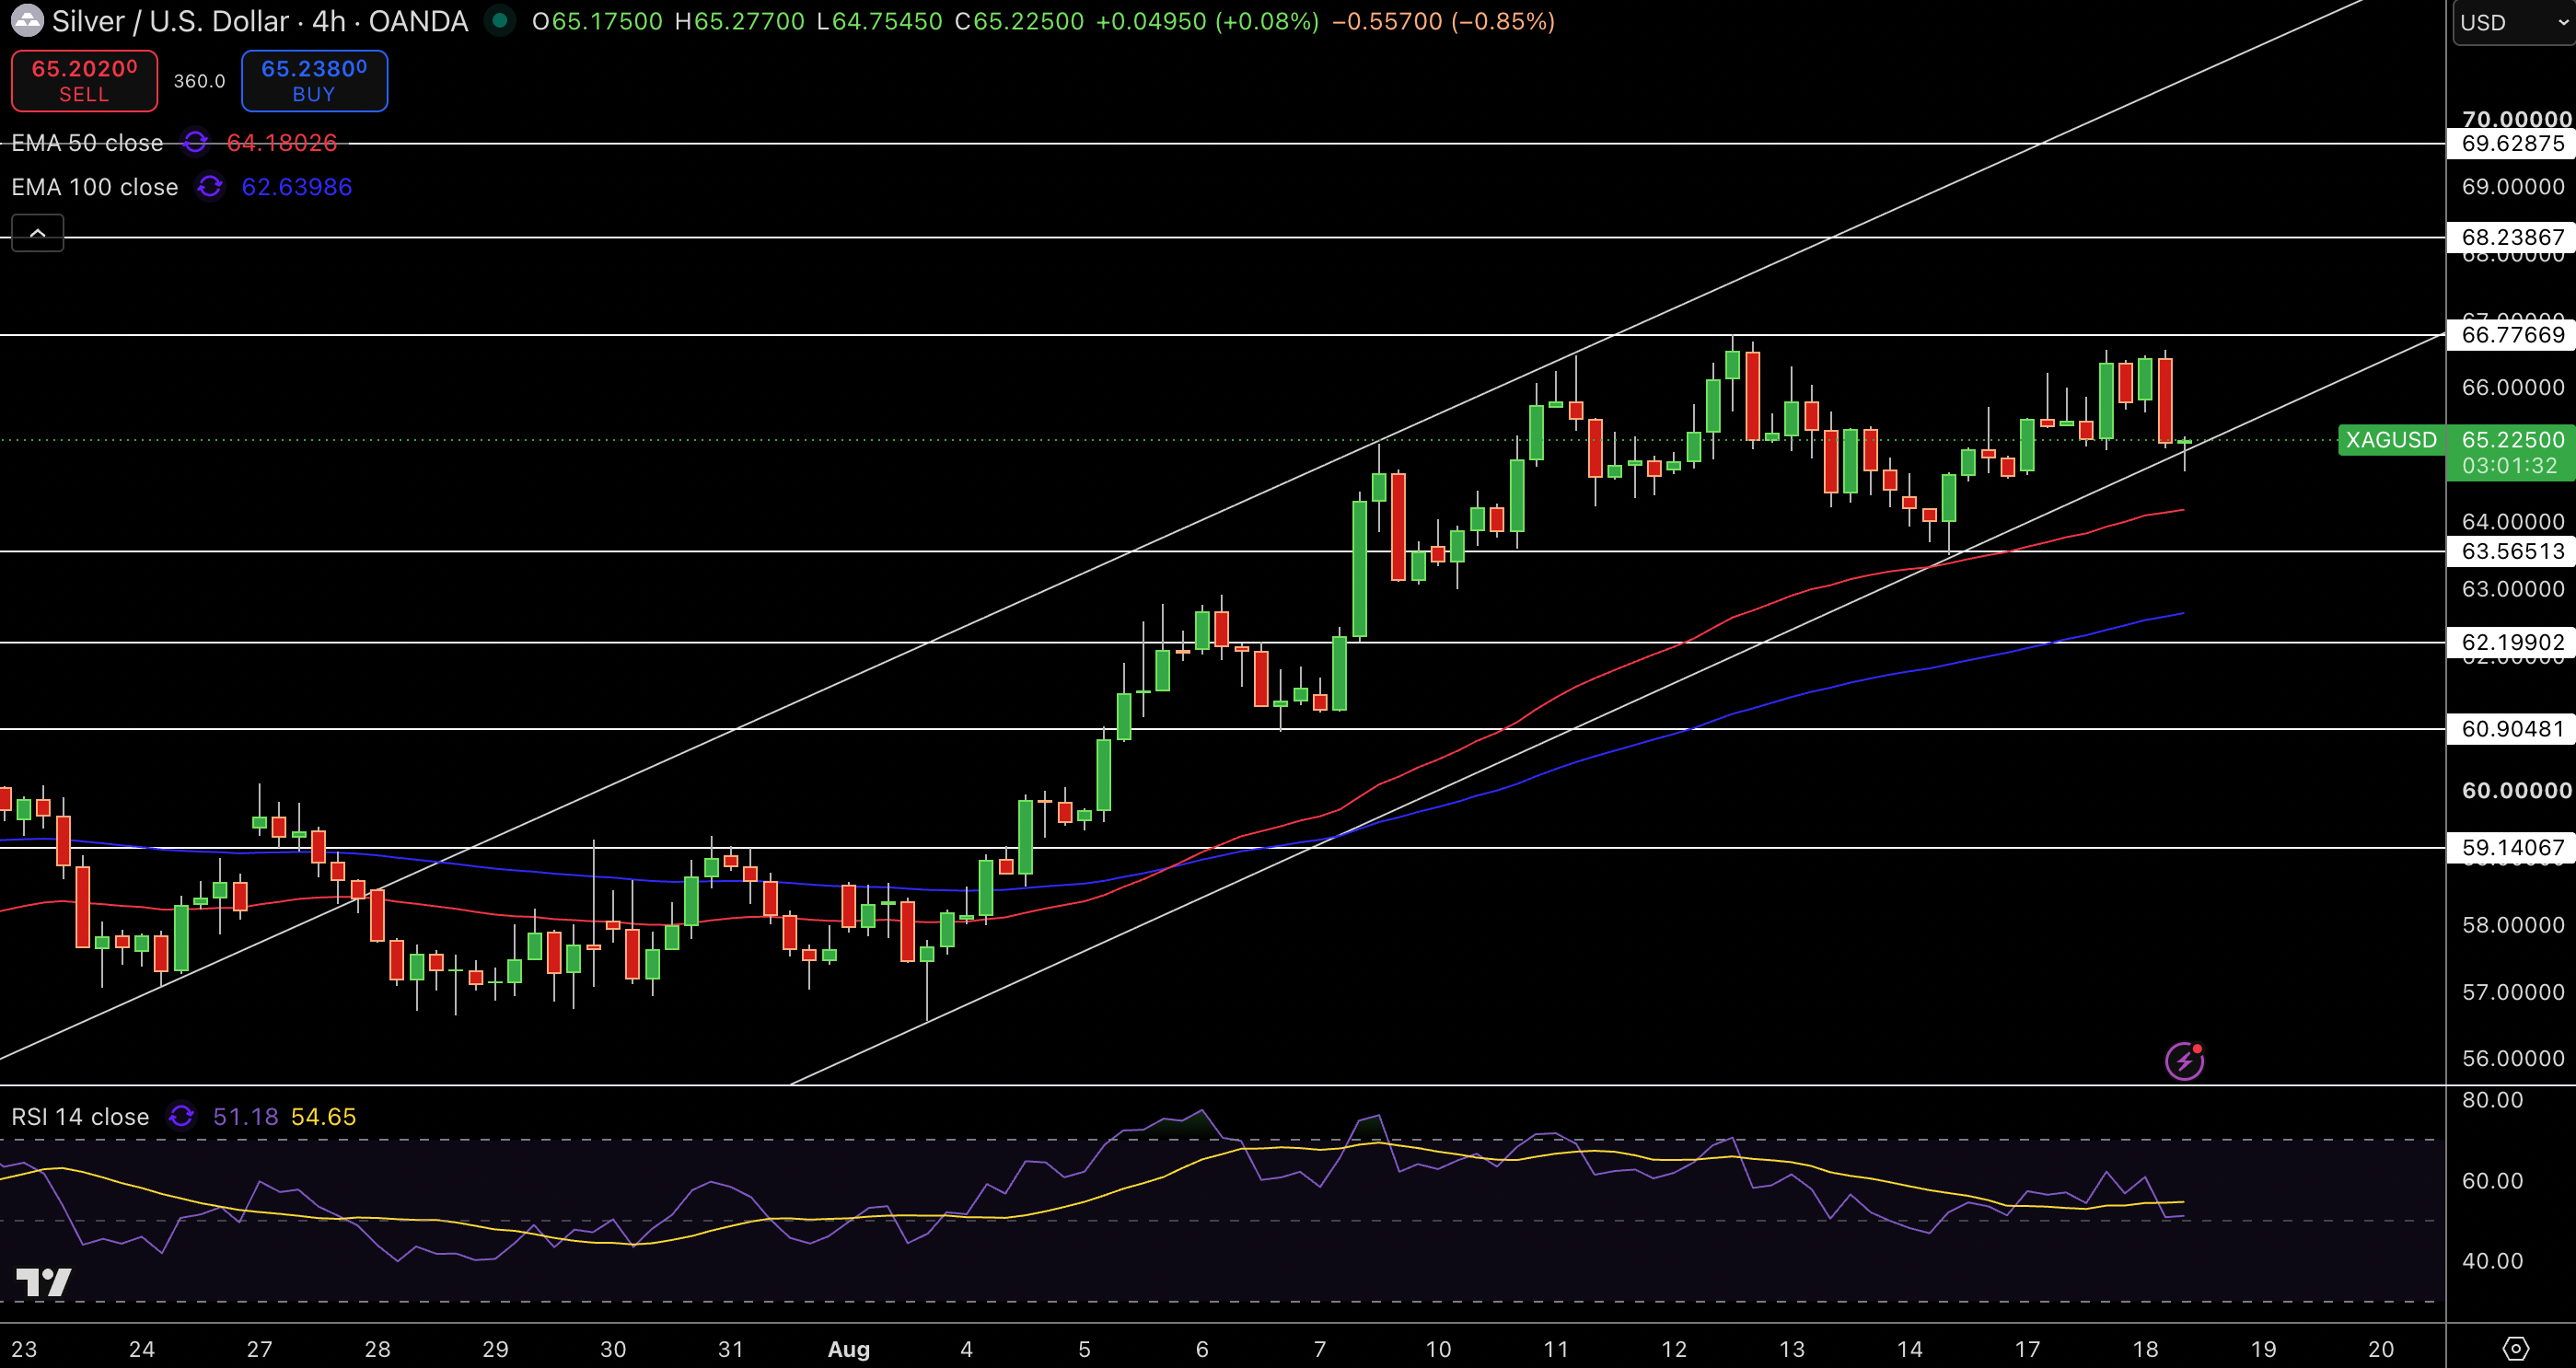
Silver is trading around $65.23 on the 4-hour chart after a failed attempt to hold a trading range above $66.78. Price is above both the 50-EMA at $64.18 and the 100-EMA at $62.64, which means that price action may be heading for a recovery even if the short-term momentum is negative.
The bullish scenario is starting to diminish, as the channel that contained the upside is starting to show bullish trends, and now supports price down. If price continues to fall, it could breach $64.18 and $62.64.
As far as I’m concerned, the technical analysis favors a sideways trading range between $65.00 and $66.78.
RSI is hovering around 51 and has become more neutral. This becomes the cap on any further up movement in the near term while $66.78, $68.24, and $69.63 act as resistance. On the flip side, $65.00 becomes the first important support zone, with $63.57 and $62.20 becoming even more important support zones.
From a macro perspective, the long-term outlook on silver remains positive so long as silver holds the $63.57 – $64.18 support zone and the rising channel. A break above $66.78 would open the $68.24 zone and a break below $63.57 would negate the current bullish structure.