
Oil News: Hormuz Risks Deepen as U.S. Gas Supply Stays Comfortable
Coverage of oil news on 18th August will focus on renewed risk of Middle East supply following the deterioration of U.S.-Iran talks. Meanwhile, the situation in Iran has become more serious. Iran announced it will adopt an ‘active defensive’ military posture, indicating a move towards a more offensive posture when efforts towards a permanent solution have continued to remain stalled. The US, on the other hand, has said it will not consider extending the temporary truce. While transport via the Strait of Hormuz remains restricted, with only 6 commodity vessels having crossed the Strait on 15th August (versus an average of 11 crossed over the last 10 days). As an additional concern, strikes on vessels exiting the Strait has led to the concern of tanker traffic returning to normal.
Amidst this global supply backdrop, concerns have started to ease in some regions. Even with the partial lifting of sanctions, crude oil supplies via Hormuz are expected to be restricted for most of August and the EIA expects a loss of 600,000 barrels of crude per day from the Middle East for the rest of 2027.
However, the situation is reversing. Diesel and gasoline shipments from China eased global products market tightness in July as Chinese restrictions related to Iran eased.
Domestically, natural-gas fundamentals are more favorable. The EIA anticipates that the average dry-gas production for 2026 will be 111.2 Bcf/d, and that LNG exports from the U.S. will reach 17.4 Bcf/d. It is estimated that storage will reach 3.985 Tcf by the end of October, around 5% higher than the 5 year average, due to a reduction in the demand for LNG feedgas with the maintenance on the Freeport LNG terminal and other facilities.
For August 18, the energy situation is dual, the largest bullish factor for crude oil and global LNG remains Middle East maritime risks, while ultra-high U.S. gas production and high storage provide a major buffer for the domestic market.

Natural Gas Technical Analysis: NG Stalls Below $2.73 Resistance as Downtrend Remains Intact
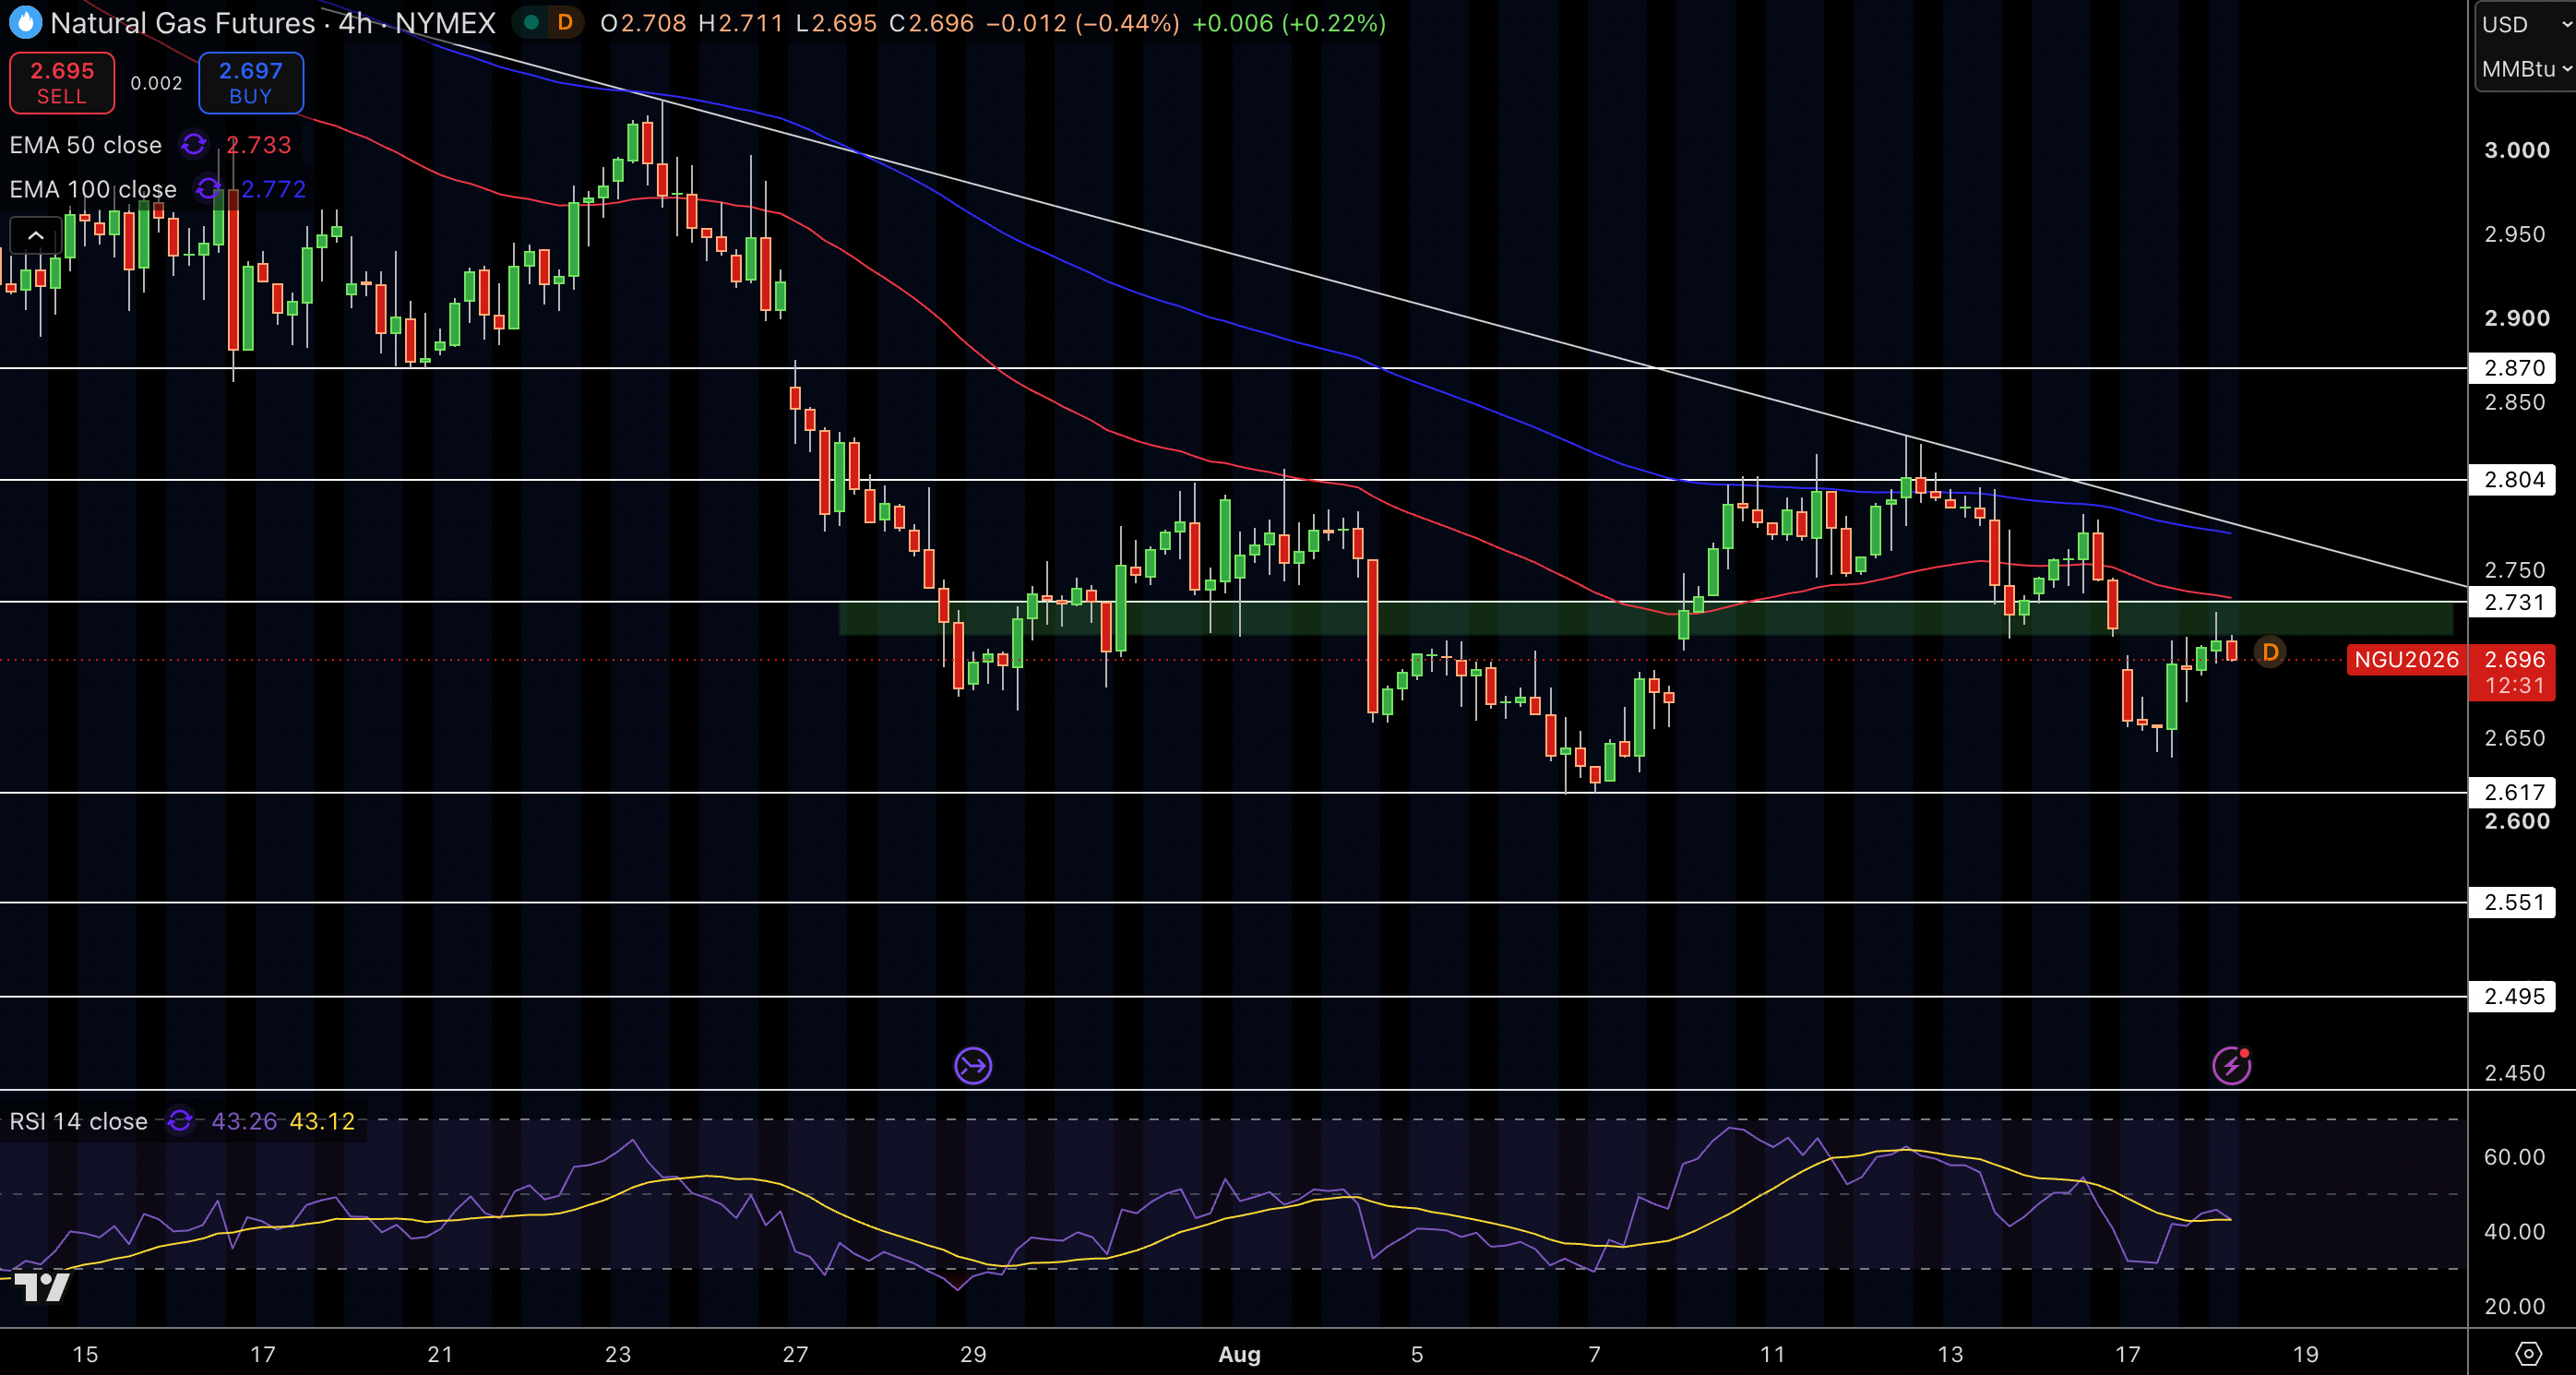
Natural gas is currently trading close to $2.70 after a bounce from the $2.62 support zone. While price has recovered, all moving averages remain below price and the downtrend line is still in place. The recent candles have been forming below the resistance zone of $2.73, suggesting consolidation instead of a breakout.
The RSI (Relative Strength Index) is currently at 43, suggesting some weak, but stabilizing momentum. Price has resistance above at $2.73 and $2.80, $2.87, and $2.95. Also price has support at $2.62, $2.55 and $2.50.
I maintain the same cautious view as long as natural gas is trading below $2.73 and $2.77. A break above $2.80 would be a good sign for the little term structure, whereas a breakdown below $2.62 would give good sign to the little term structure to continue lower to $2.55.
Natural Gas Price Forecast
Every new Natural Gas analysis as it publishes, today's technical signal and key levels, live price — on one page.
See all Natural Gas forecastsWTI Crude Oil Technical Analysis: WTI Reclaims $84 as Momentum Improves
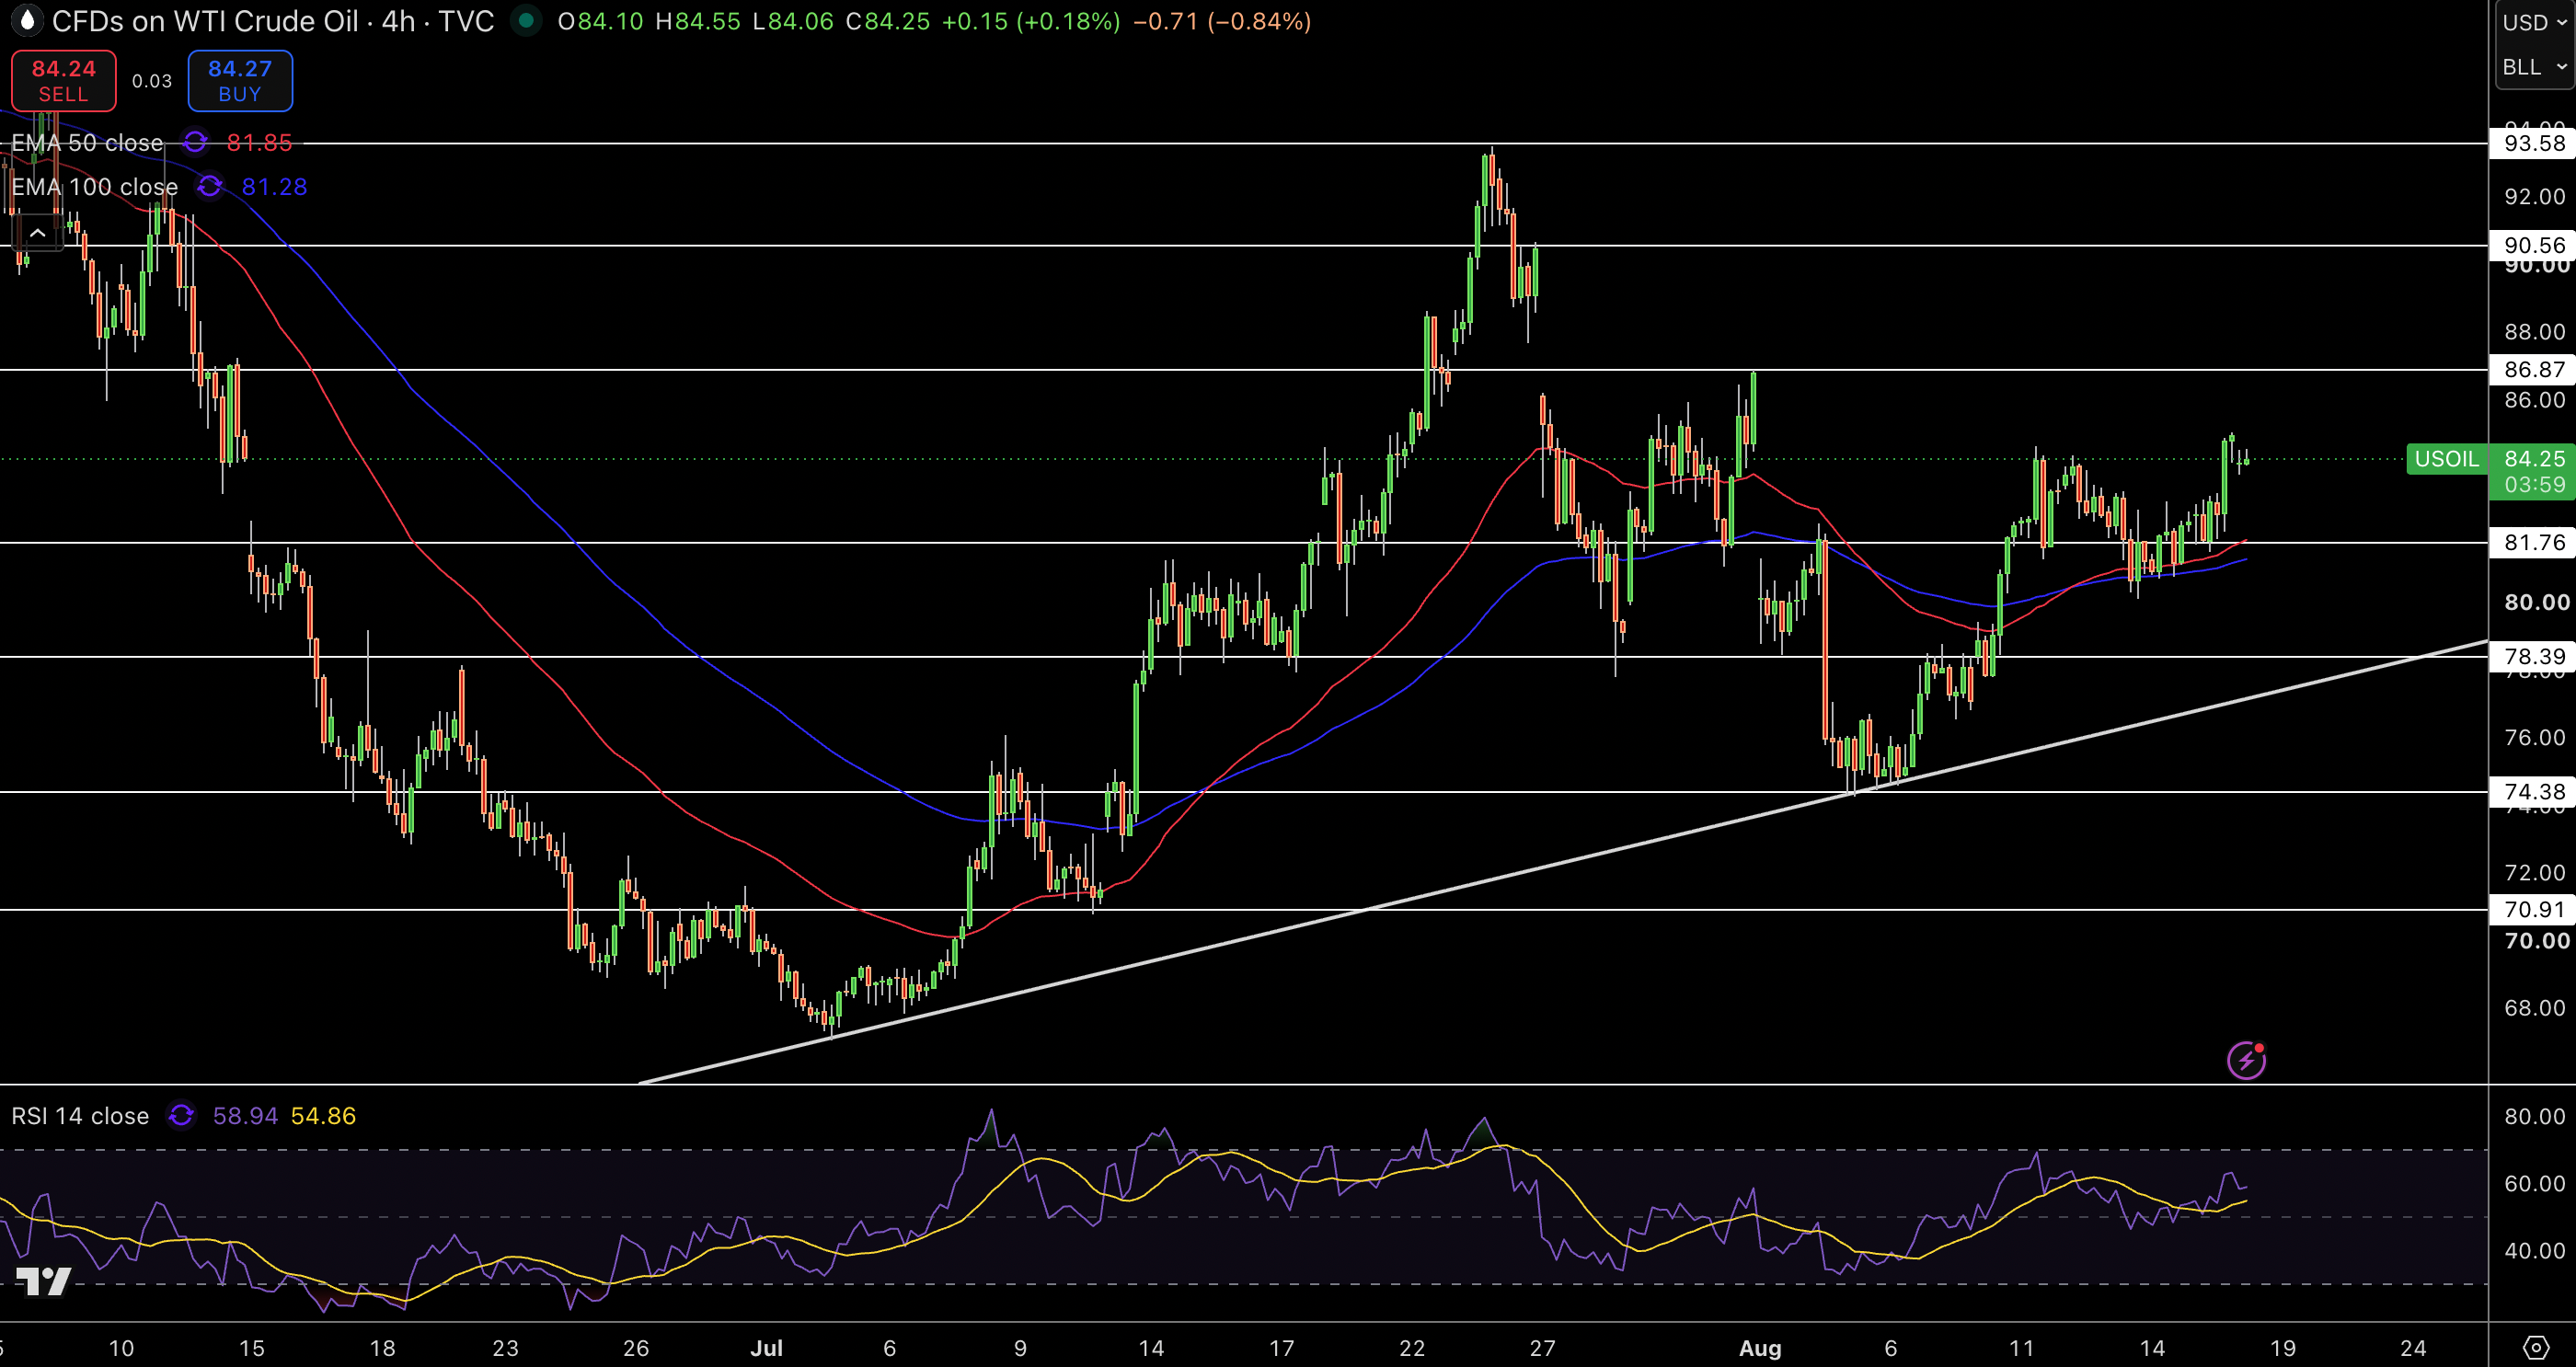
WTI Crude Oil is at $84.25 with price continuing to extend its recovery from the August lows. Price is now above the 50 EMA at $81.85 and the 100 EMA at $81.28, and if price holds above these levels, the recovery may continue. The latest price action shows buyers stepping in above the $81.76 area, and as long as price holds above this area, and the overall upward trend from June is still intact, the recovery may continue.
RSI is at 59, which shows that price is in a strong upward trend, but not overbought. Price may face upward resistance at $86.87, $90.56, and $93.58. Price may have support at $81.76, $78.39, and $74.38.
I think WTI is in a technical recovery as long as price holds above the $81.76 area. A break above $86.87 may continue to recover price to $90.56. A break back below the EMAs may negatively impact this technical recovery.
Brent Crude Oil Technical Analysis: Brent Tests $91.13 Resistance as Bulls Stay in Control
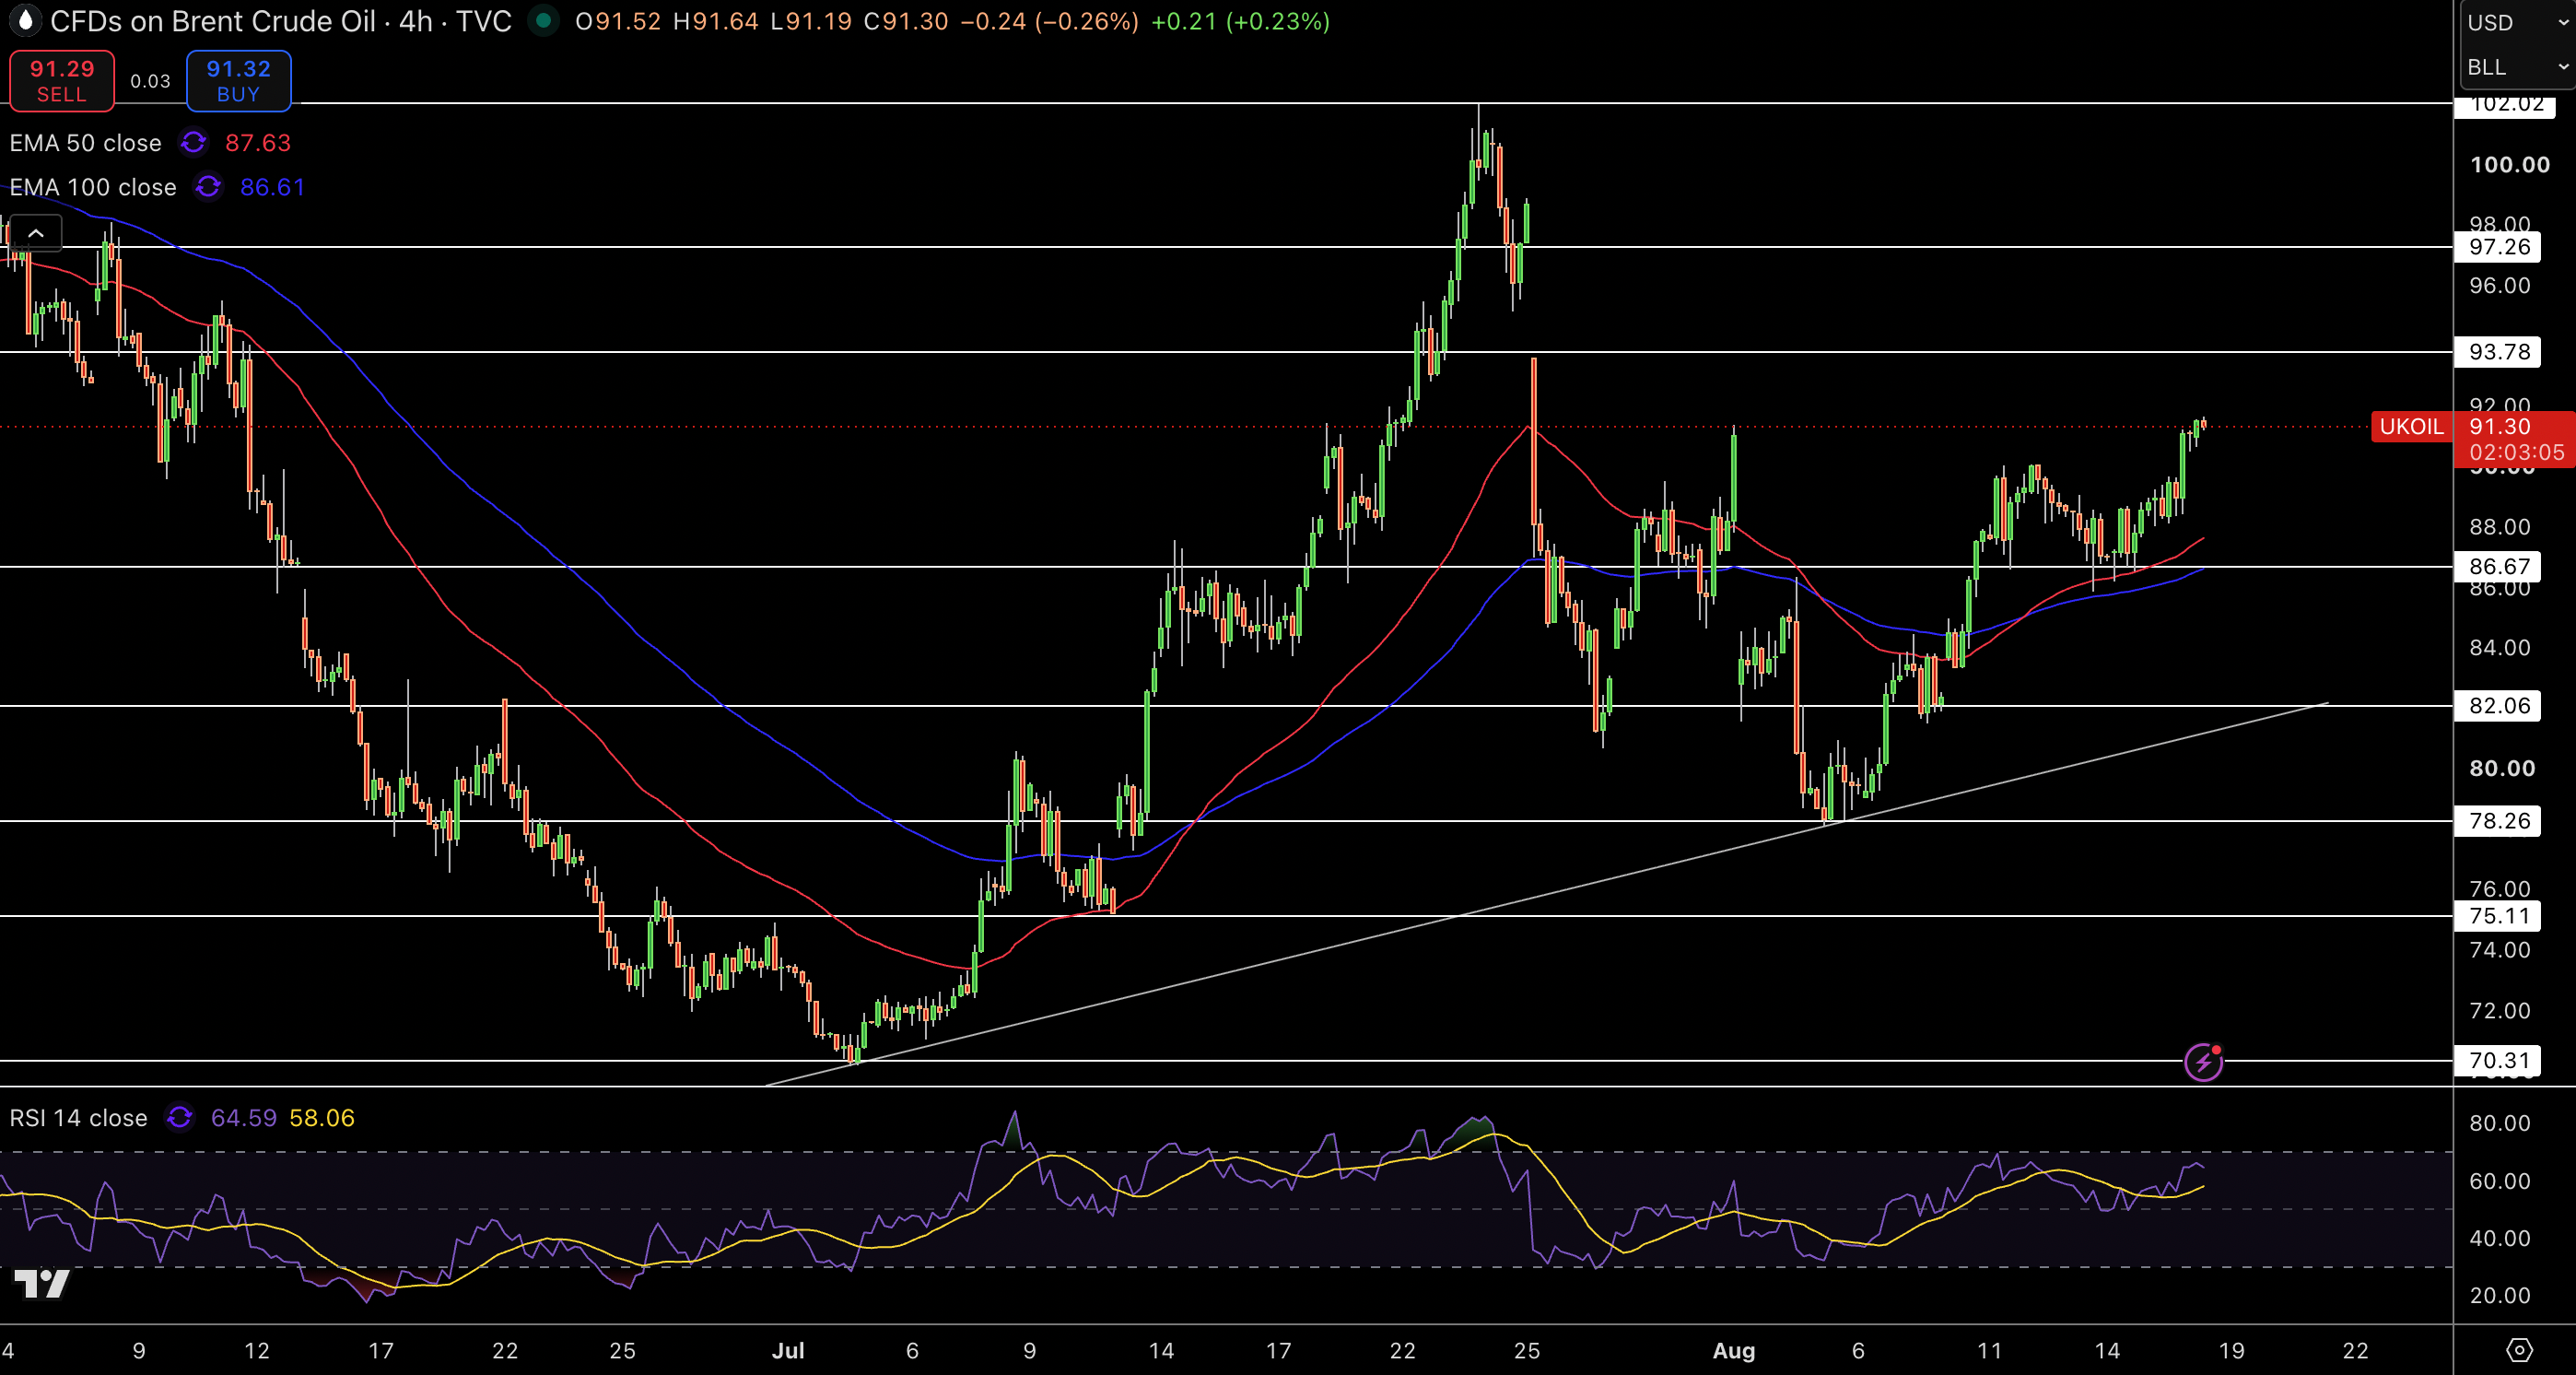
Brent Crude Oil is at $91.30 on the 4 hour chart and currently testing the resistance area at $91.13 after a strong move north from the $78.26 support area. Brent is sitting comfortably above both the 50 EMA at $87.63 and the 100 EMA at $86.61, and a slight upward bias is still intact.
The RSI is at 65, and is showing strong upward momentum, however is starting to show overbought conditions. If Brent is able to move above the resistance area at $91.13, then price may continue higher to the resistance areas at $93.78, $97.26, and $102.02. If Brent is able to move lower from the price action, then support may be found at $86.67, $82.06, and $78.26.
I think Brent is technically in an upward price trend. A break above the $91.13 area may continue price upward to $93.78 and higher. A break back below the EMAs may negatively impact the upward trend.
Brent should still be seen as bullish, as long as we trade above $86.67. If we do end up trading above $91.13, we should begin to see an improvement in the up side structure. If this doesn’t happen we could end up consolidating, before heading in a new direction.