
US Dollar News: Fed Hold Bets Rise as ECB and BoE Stay Hawkish
As we entered August 18, the expectations on monetary policy had clearly shifted toward a Federal Reserve pause. Recent data on the U.S economy showed a slowing economy as July’s retail sales declined for the first time in nine months, core retail sales declined, payrolls shrank, and July inflation readings were less worrisome. Funds markets anticipate a September raise at a probability of only about 35 percent as compared to 52.2 percent last week. A Reuters poll, which was taken August 12 – 17, suggested most economists anticipated a Fed pause for all of 2026. Investors are waiting for the release of the FOMC minutes on the July meeting to see how the Fed members voted.
In comparison to the U.S. dollar, the euro has a stronger monetary policy backdrop. According to a Reuters survey, 57 of 69 economists expected the ECB to raise its deposit rate of 2.50 percent in September, while inflation continues to be above the ECB’s target of 2 percent. Policy divergence in favor of the euro continues to increase as the expectations surrounding the Fed’s policy continue to decline.
Sterling is also benefiting from policy divergence. UK growth for the second quarter was at 0.4 percent, and the Bank of England’s Chief Economist, Huw Pill, indicated that the recent growth that was also in excess of expectations, is a good reason for policy to be tightened. Currently markets are calling for at least one additional hike by the BoE in 2026. New data on the labor market and inflation in the U.K. will be released this week that will be useful in evaluating this position.
The main issue for all three currencies is the Middle East. Renewed U.S.-Iran tensions and ongoing disruptions through the Strait of Hormuz pose risks for another energy-related inflation shock, which could once again bring expectations of tighter policy if price pressures begin to accelerate.

U.S. Dollar Index Technical Analysis: DXY Defends $99.38 Support but Remains Below Key EMAs
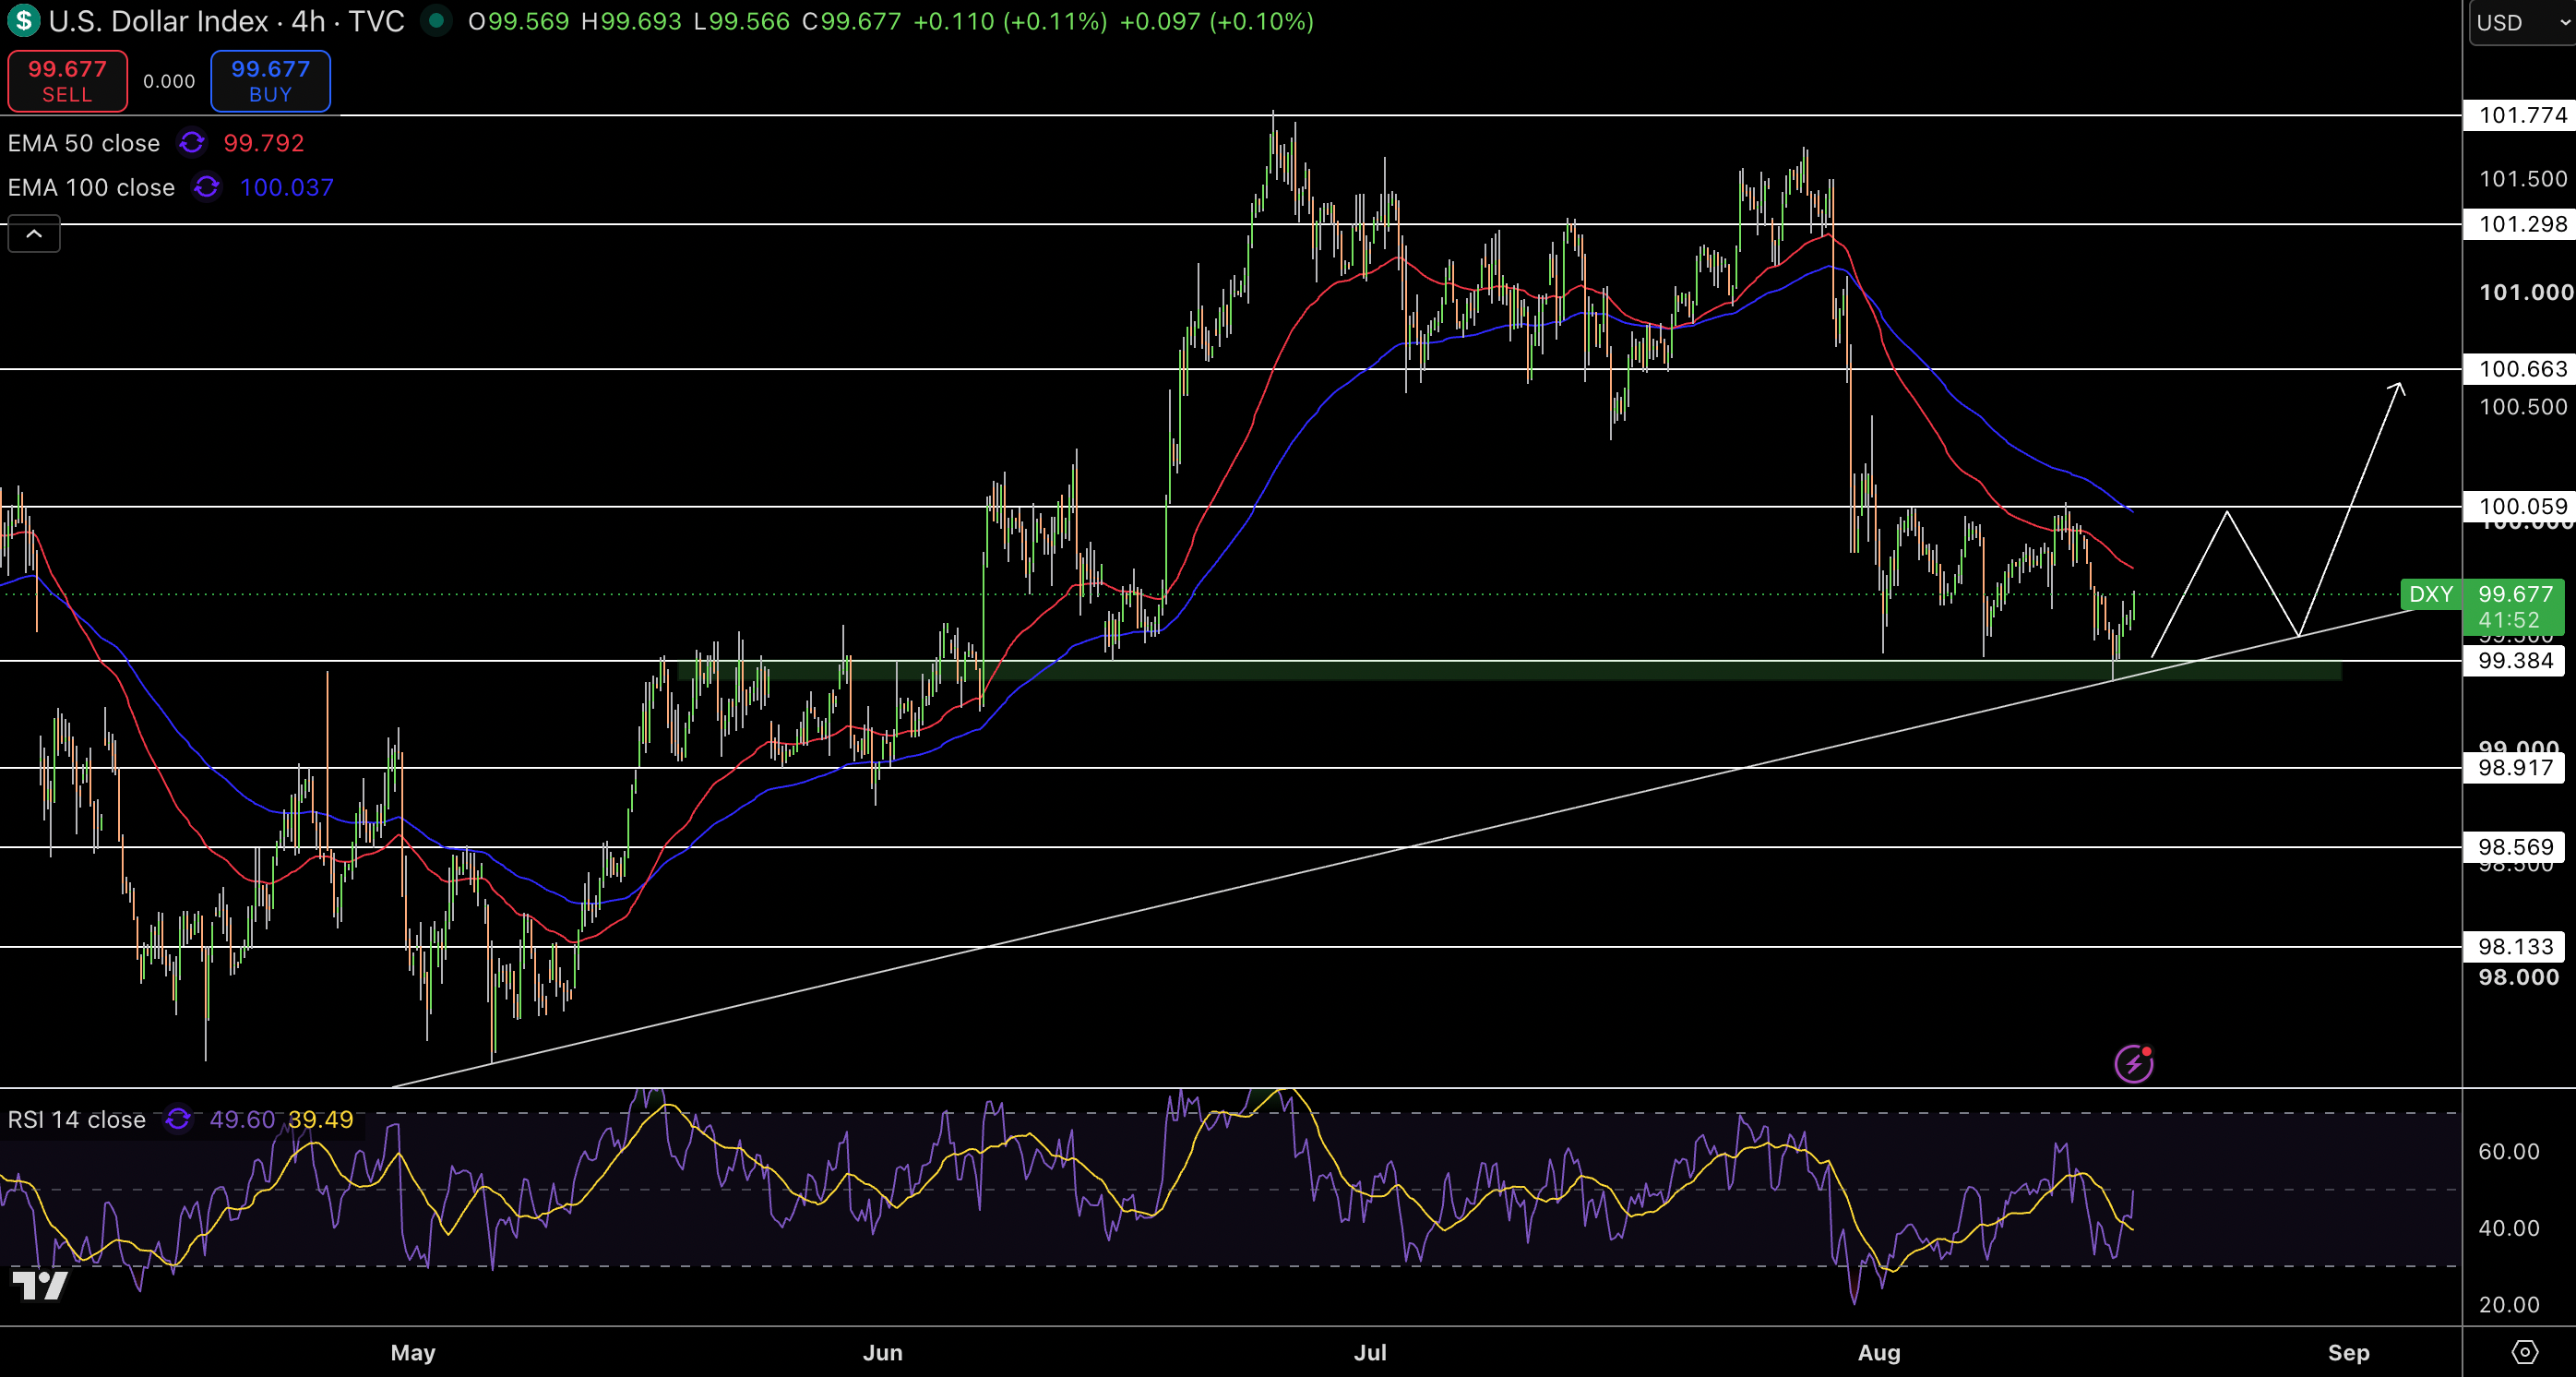
Currently the U.S. Dollar Index is trading at $99.68. From here, price rebounded after finding support at $99.38, and also found support at a rising trendline. Recovery from this area is positive, but the Index is still trading below both the 50-EMA, currently at $99.79, and the 100-EMA, currently at $100.00. The short-term structure is also staying mostly negative. Candle formation indicates that buyers are trying to build a base, and that imbalance is being supported at the $99.38 level, with neutral momentum as reflected by the RSI at 50.
Error correcting activity from the current level would need a significant move up and above the $100.06 resistance level before anything can be considered positive. Until a support break is seen at the $99.38, this price area will continue to attract selling interest, as the Index is poised to break lower to the $98.57 and $98.92 levels.
EUR/USD Price Forecast
Every new EUR/USD analysis as it publishes, today's technical signal and key levels, live price — on one page.
See all EUR/USD forecastsGBP/USD Technical Analysis: Pound Tests Rising Trendline After Rejection From $1.3559
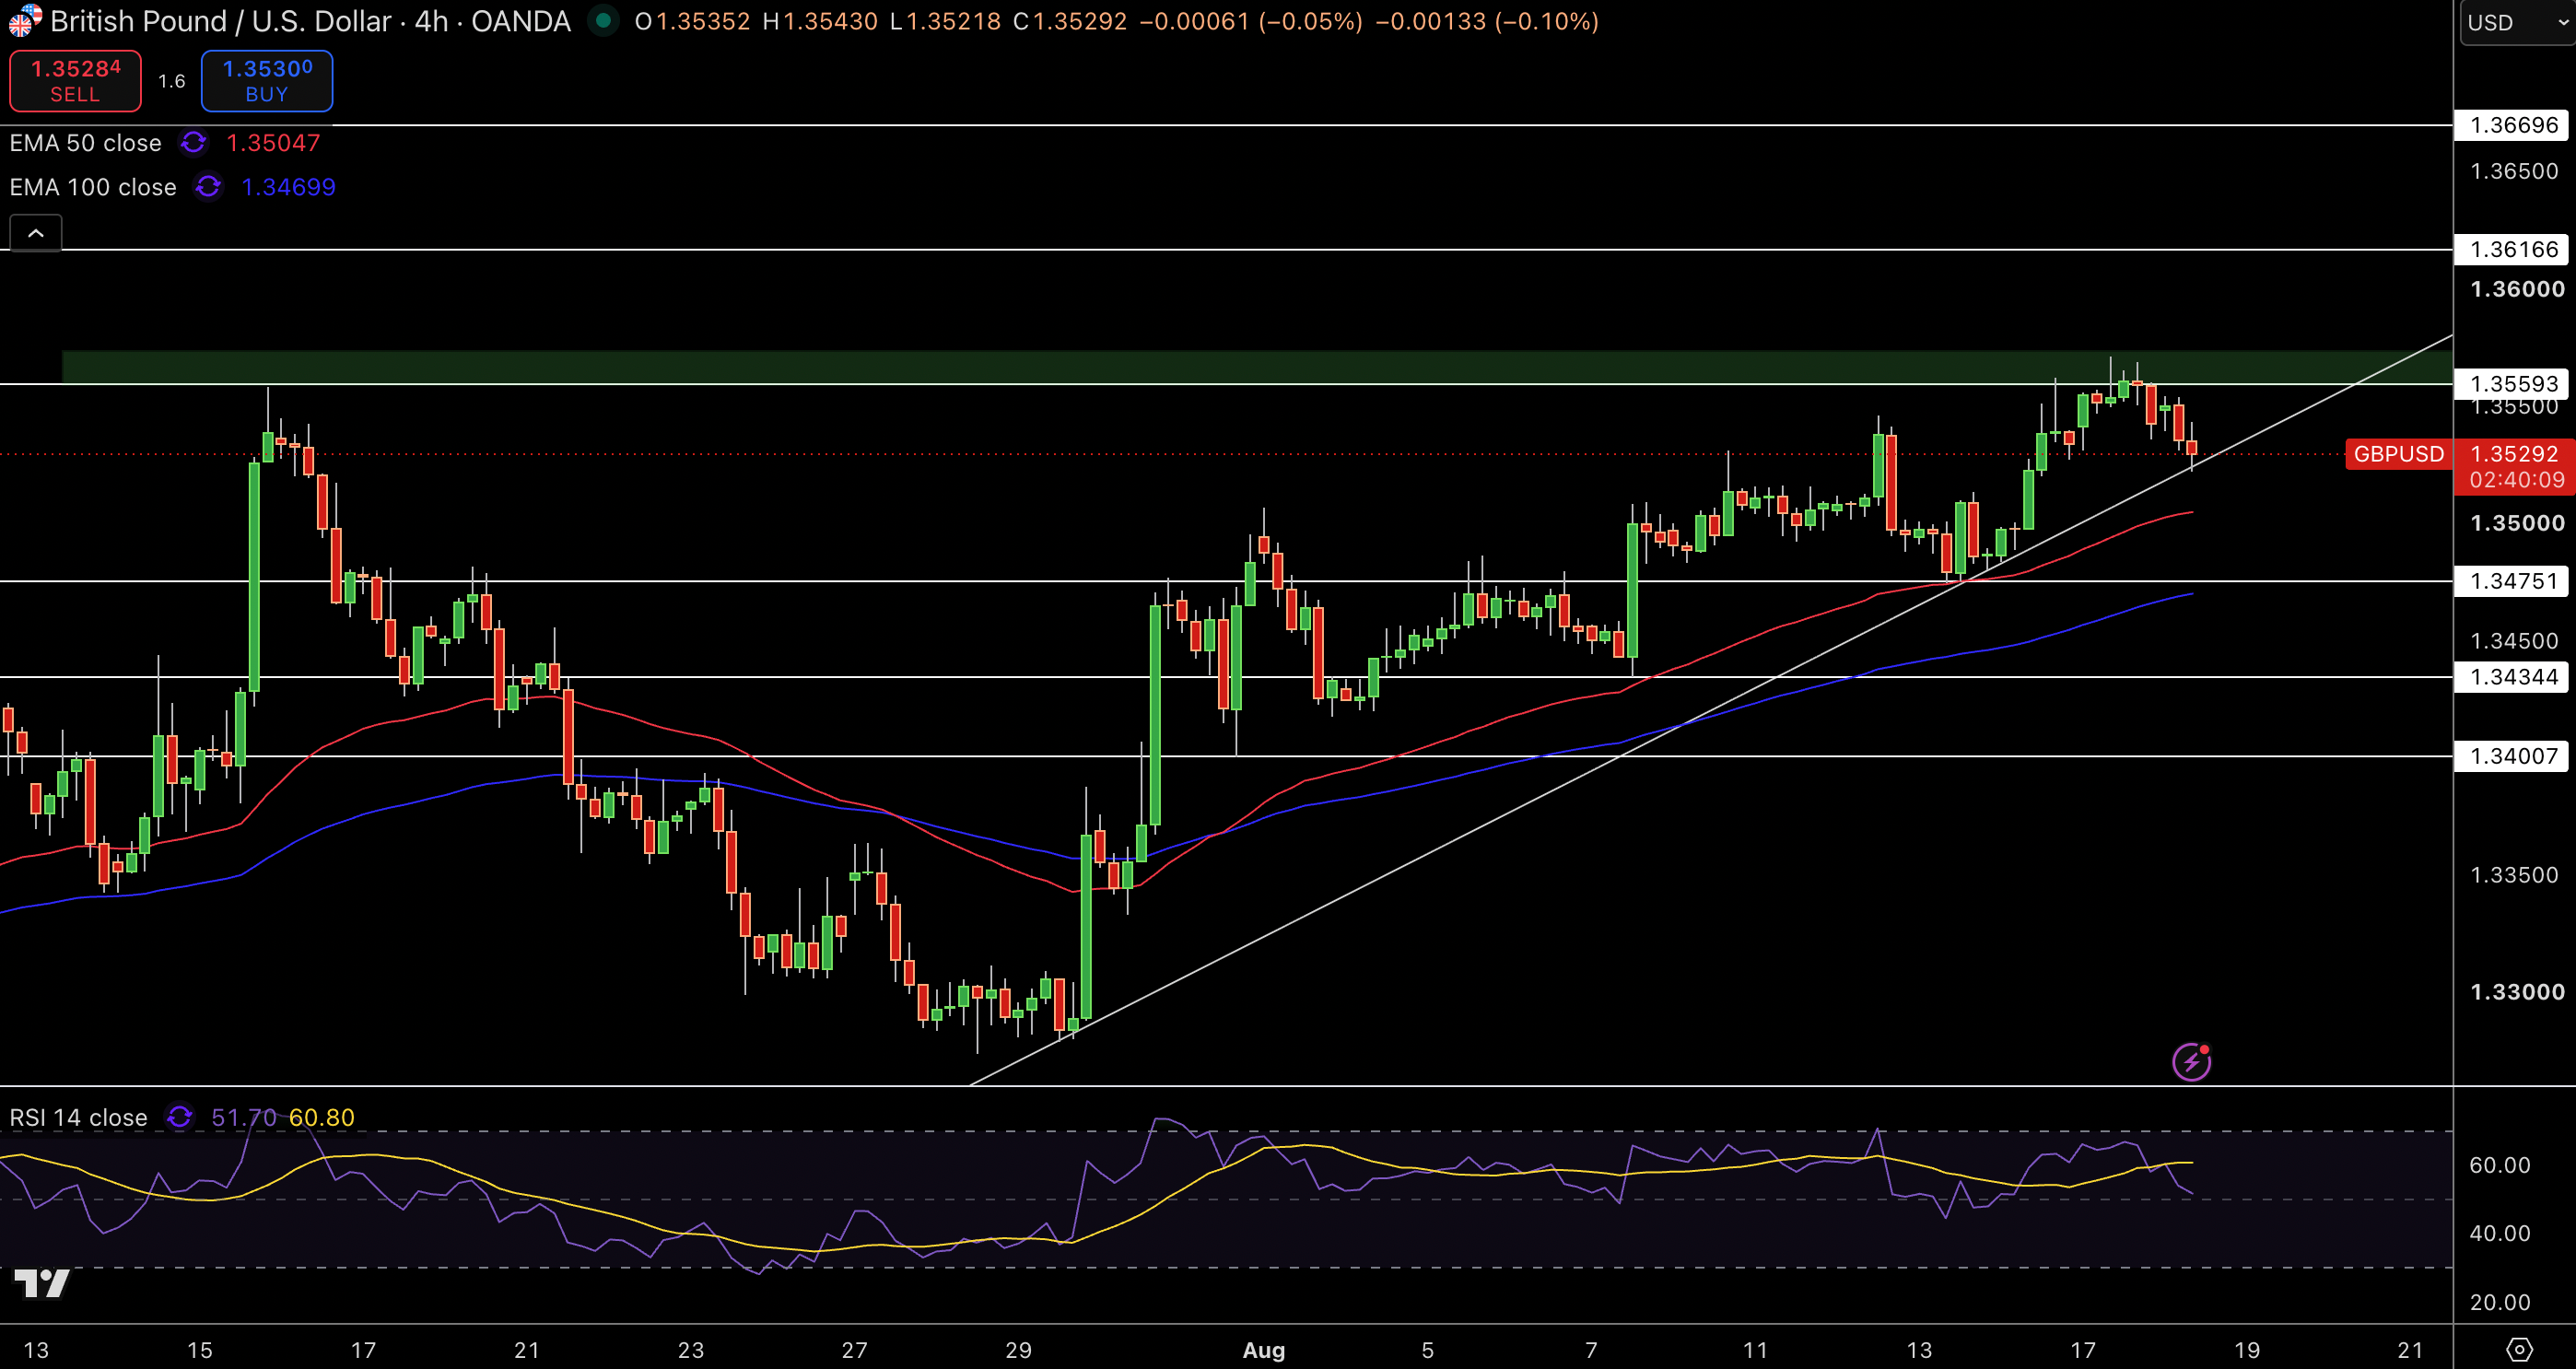
Currently at $1.3529 on the 4 hour chart, the pound has pulled back from the $1.3559 resistance zone. Price remains above both the 50-EMA at $1.3505 and the 100-EMA with a rising trendline providing additional support. The last few candlesticks have shown some profit-taking, however, the structure has not turned bearish.
RSI has eased toward 52, indicating that momentum has shift to the neutral zone. Resistance is still seen at $1.3559 with additional levels at $1.3617 and $1.3670. On the downside, support is seen at $1.3500, $1.3475, $1.3434, and $1.3401.
GBP/USD is still technically constructive as long as the price remains above the rising trendline and the $1.3475 – $1.3500 support region. A break above $1.3559 would put $1.3617 in focus, while a break below $1.3475 would lose the uptrend.
EUR/USD Technical Analysis: Euro Pulls Back Toward $1.1545 After Testing $1.1600
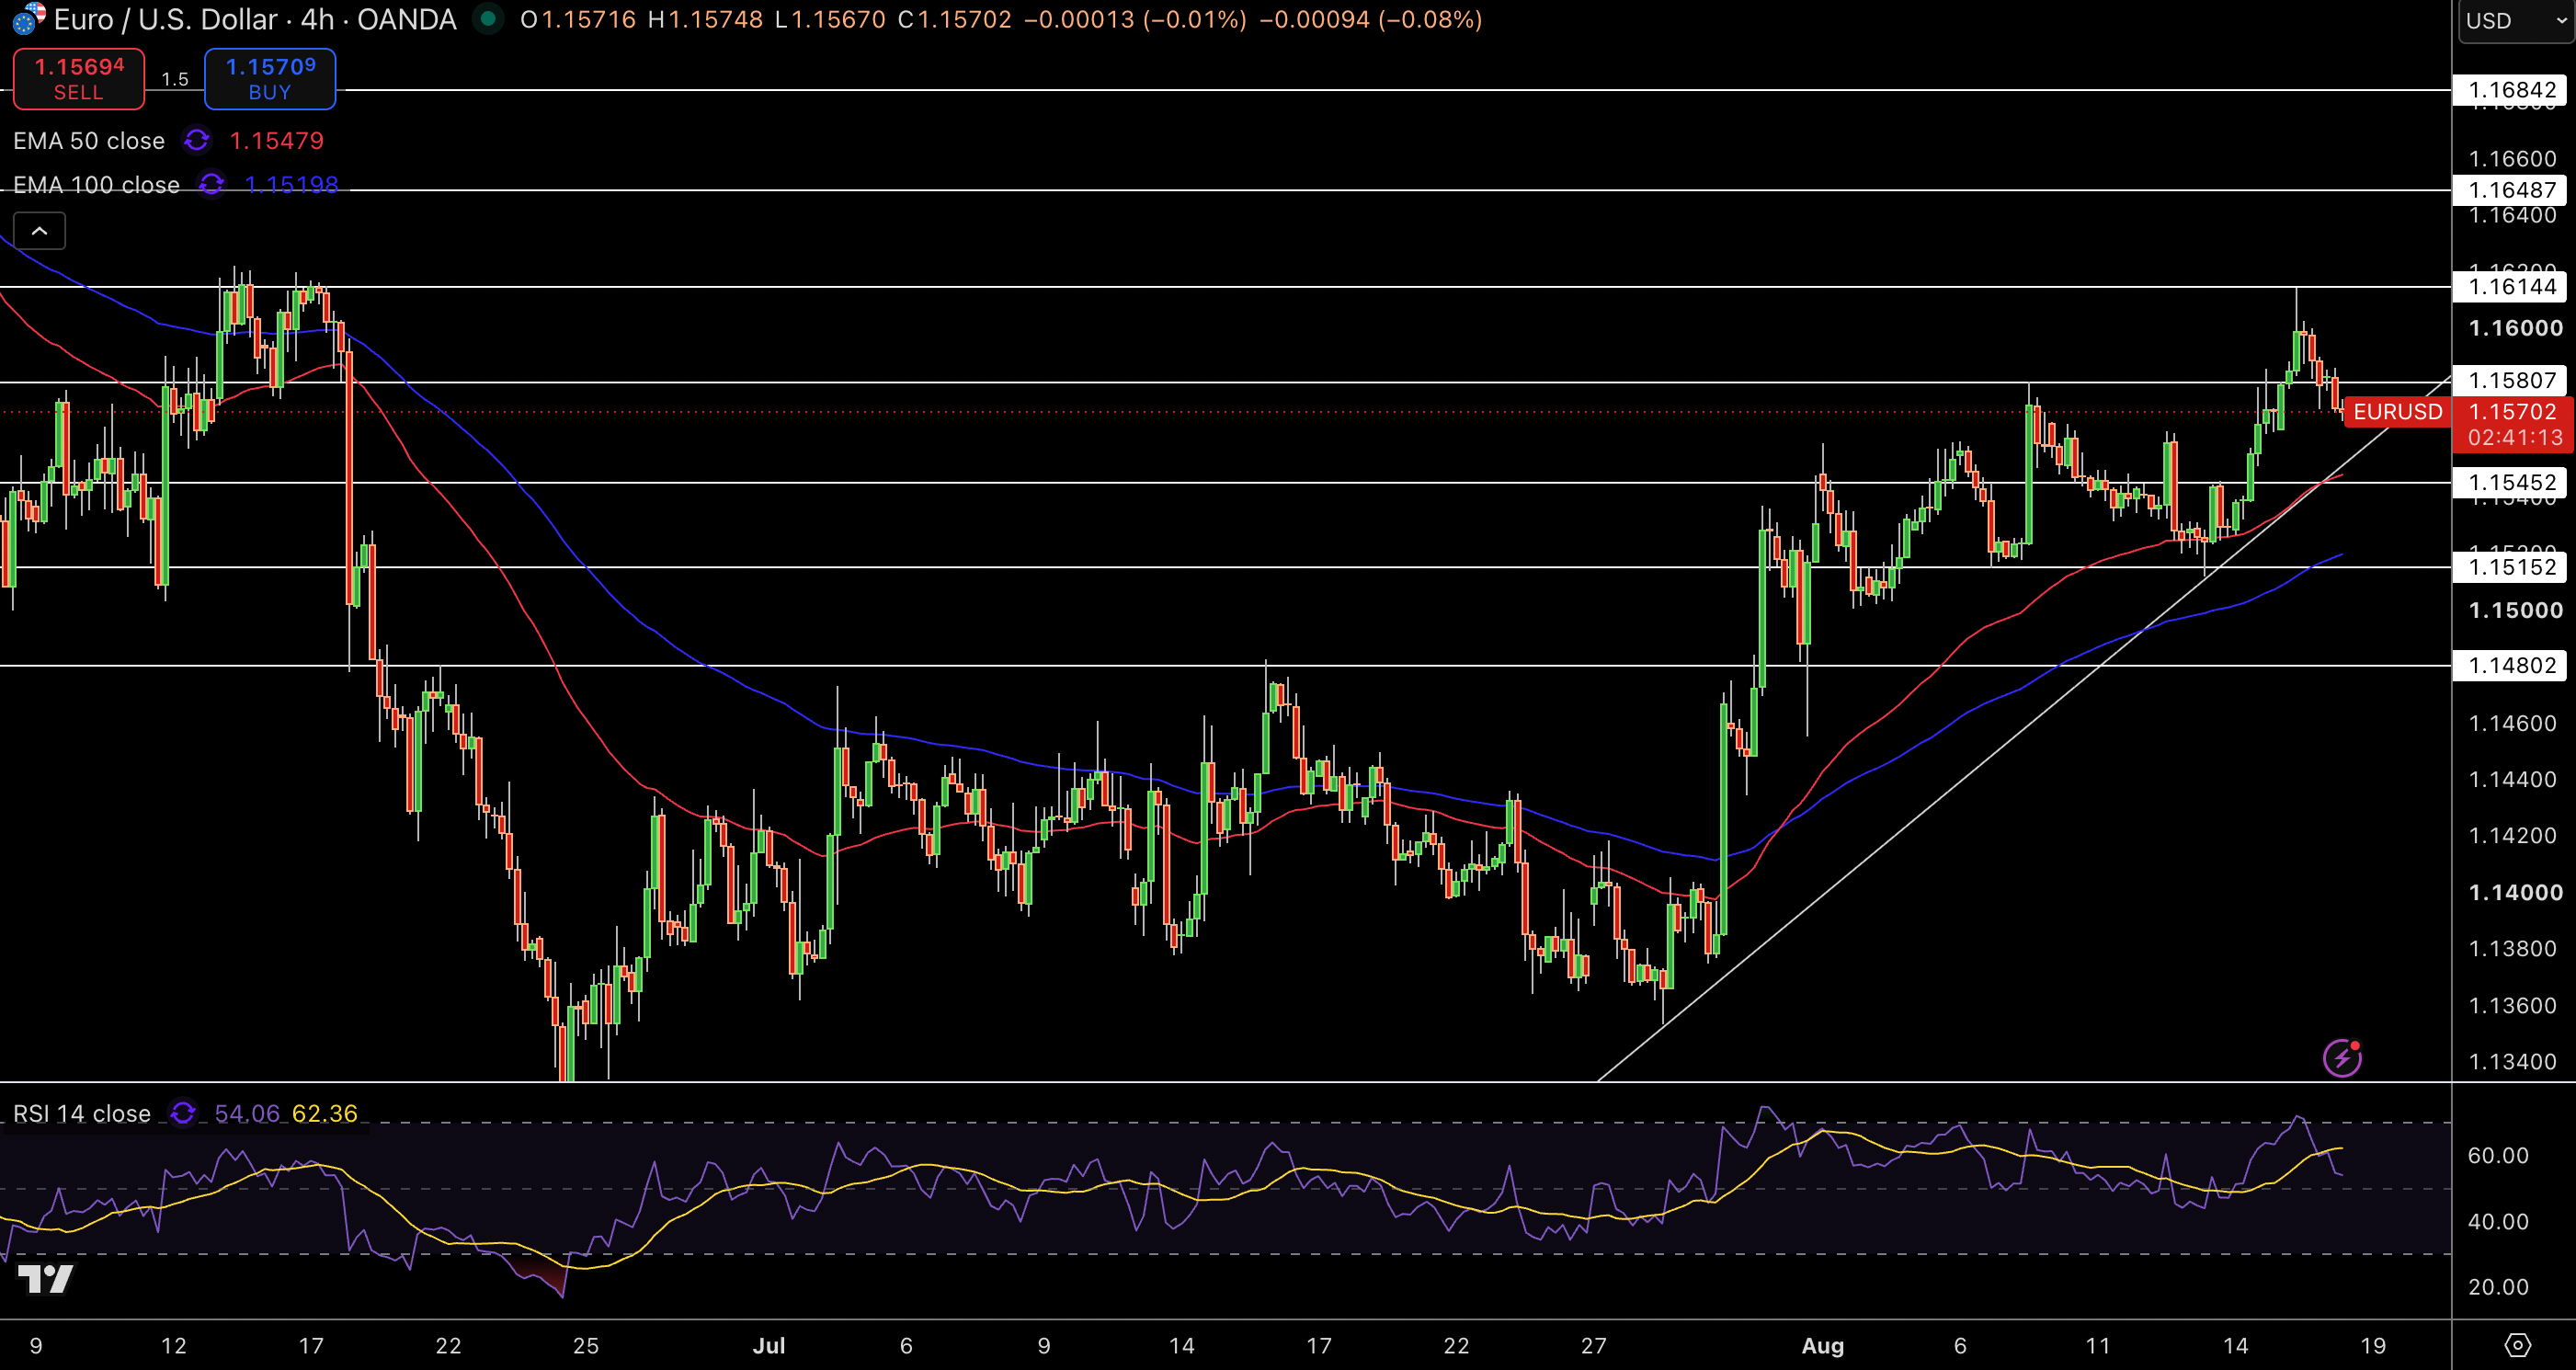
The Euro is trading at $1.1570 on the 4 hour time frame. Price pulled back from the high it made at $1.1600. The Index remains above the 50 EMA at $1.1548 and the 100 EMA at $1.1520. This shows short term structure is still positive. Price also remains above the rising trend line that formed from the July lows.although recent price action shows a decline in the momentum that took the price formation above the consolidation range.
Rising momentum is currently at $1.1579. This is supported by RSI level at 54. This remains positive and constructive until a break above $1.1581 is realized, along with $1.1614, $1.1649, and $1.1684. $1.1545 is a support that is positioned above while below there is $1.1515 and $1.1480.
I believe EUR/USD is bullish as long as it stays above $1.1545 and the rising trendline. An upward break of $1.1614 could take us to $1.1649, but a drop below $1.1515 would take away some of the support from the recovery.