
Gold News: Iran Escalation Fuels Inflation and Fed-Hike Risk
Driven by the latest round of U.S.-Iran tension, gold and silver fundamentals on September 2 are showing higher energy costs and bond yields coupled with the revival of expectations for a more hawkish Federal Open Market Committee (FOMC) outlook. The U.S. conducted its most significant strikes on Iran in weeks. It targeted Iran’s air defense, radar, maritime, and communications systems. Iran retaliated by striking U.S. positions in Jordan, Iraq, and Bahrain. These strikes have increased the Strait of Hormuz and oil price inflation concerns.
Inflation concerns are currently dominating the market and exacerbating potential safe haven demand for gold. The 10-year U.S. Treasury escalated to 4.81% from its previous low of 2.04% just two months earlier, and fed funds futures are pricing in a 67% likelihood of a rate hike at the FOMC’s September policy meeting. Higher yields create more opportunity cost for holding non-yielding metals, and the stronger U.S. dollar is also macro headwind against gold.
Until the U.S. labor market data releases at the end of the week, the equity markets will be focused on the labor data released by the ADP private employment survey on Wednesday for the next monetary policy indication. A weaker labor report may reduce the likelihood of interest rate hikes, and strong hiring data will be interpreted in line with the hawkish monetary policy stance of Fed Chair Kevin Warsh’s address in Jackson Hole.
Longer-term fundamentals for gold are still buoyed by ongoing diversification by central banks and institutional investment. However, the short-term outlook for gold is now more challenging.
While all precious metals share the threat of a rising dollar and interest rates, Silver also has additional exposure to industrial demand from electronics, AI, and power grid infrastructure. Therefore, for September 2, the central precious metals theme is clear: although geopolitical tensions create market uncertainty, the associated inflationary oil shocks are fostering rising rate expectations and inflation more rapidly than safe haven demand can offset.

Gold Technical Analysis: XAU/USD Breaks Structure as $4,263 Demand Becomes the Line I’m Watching
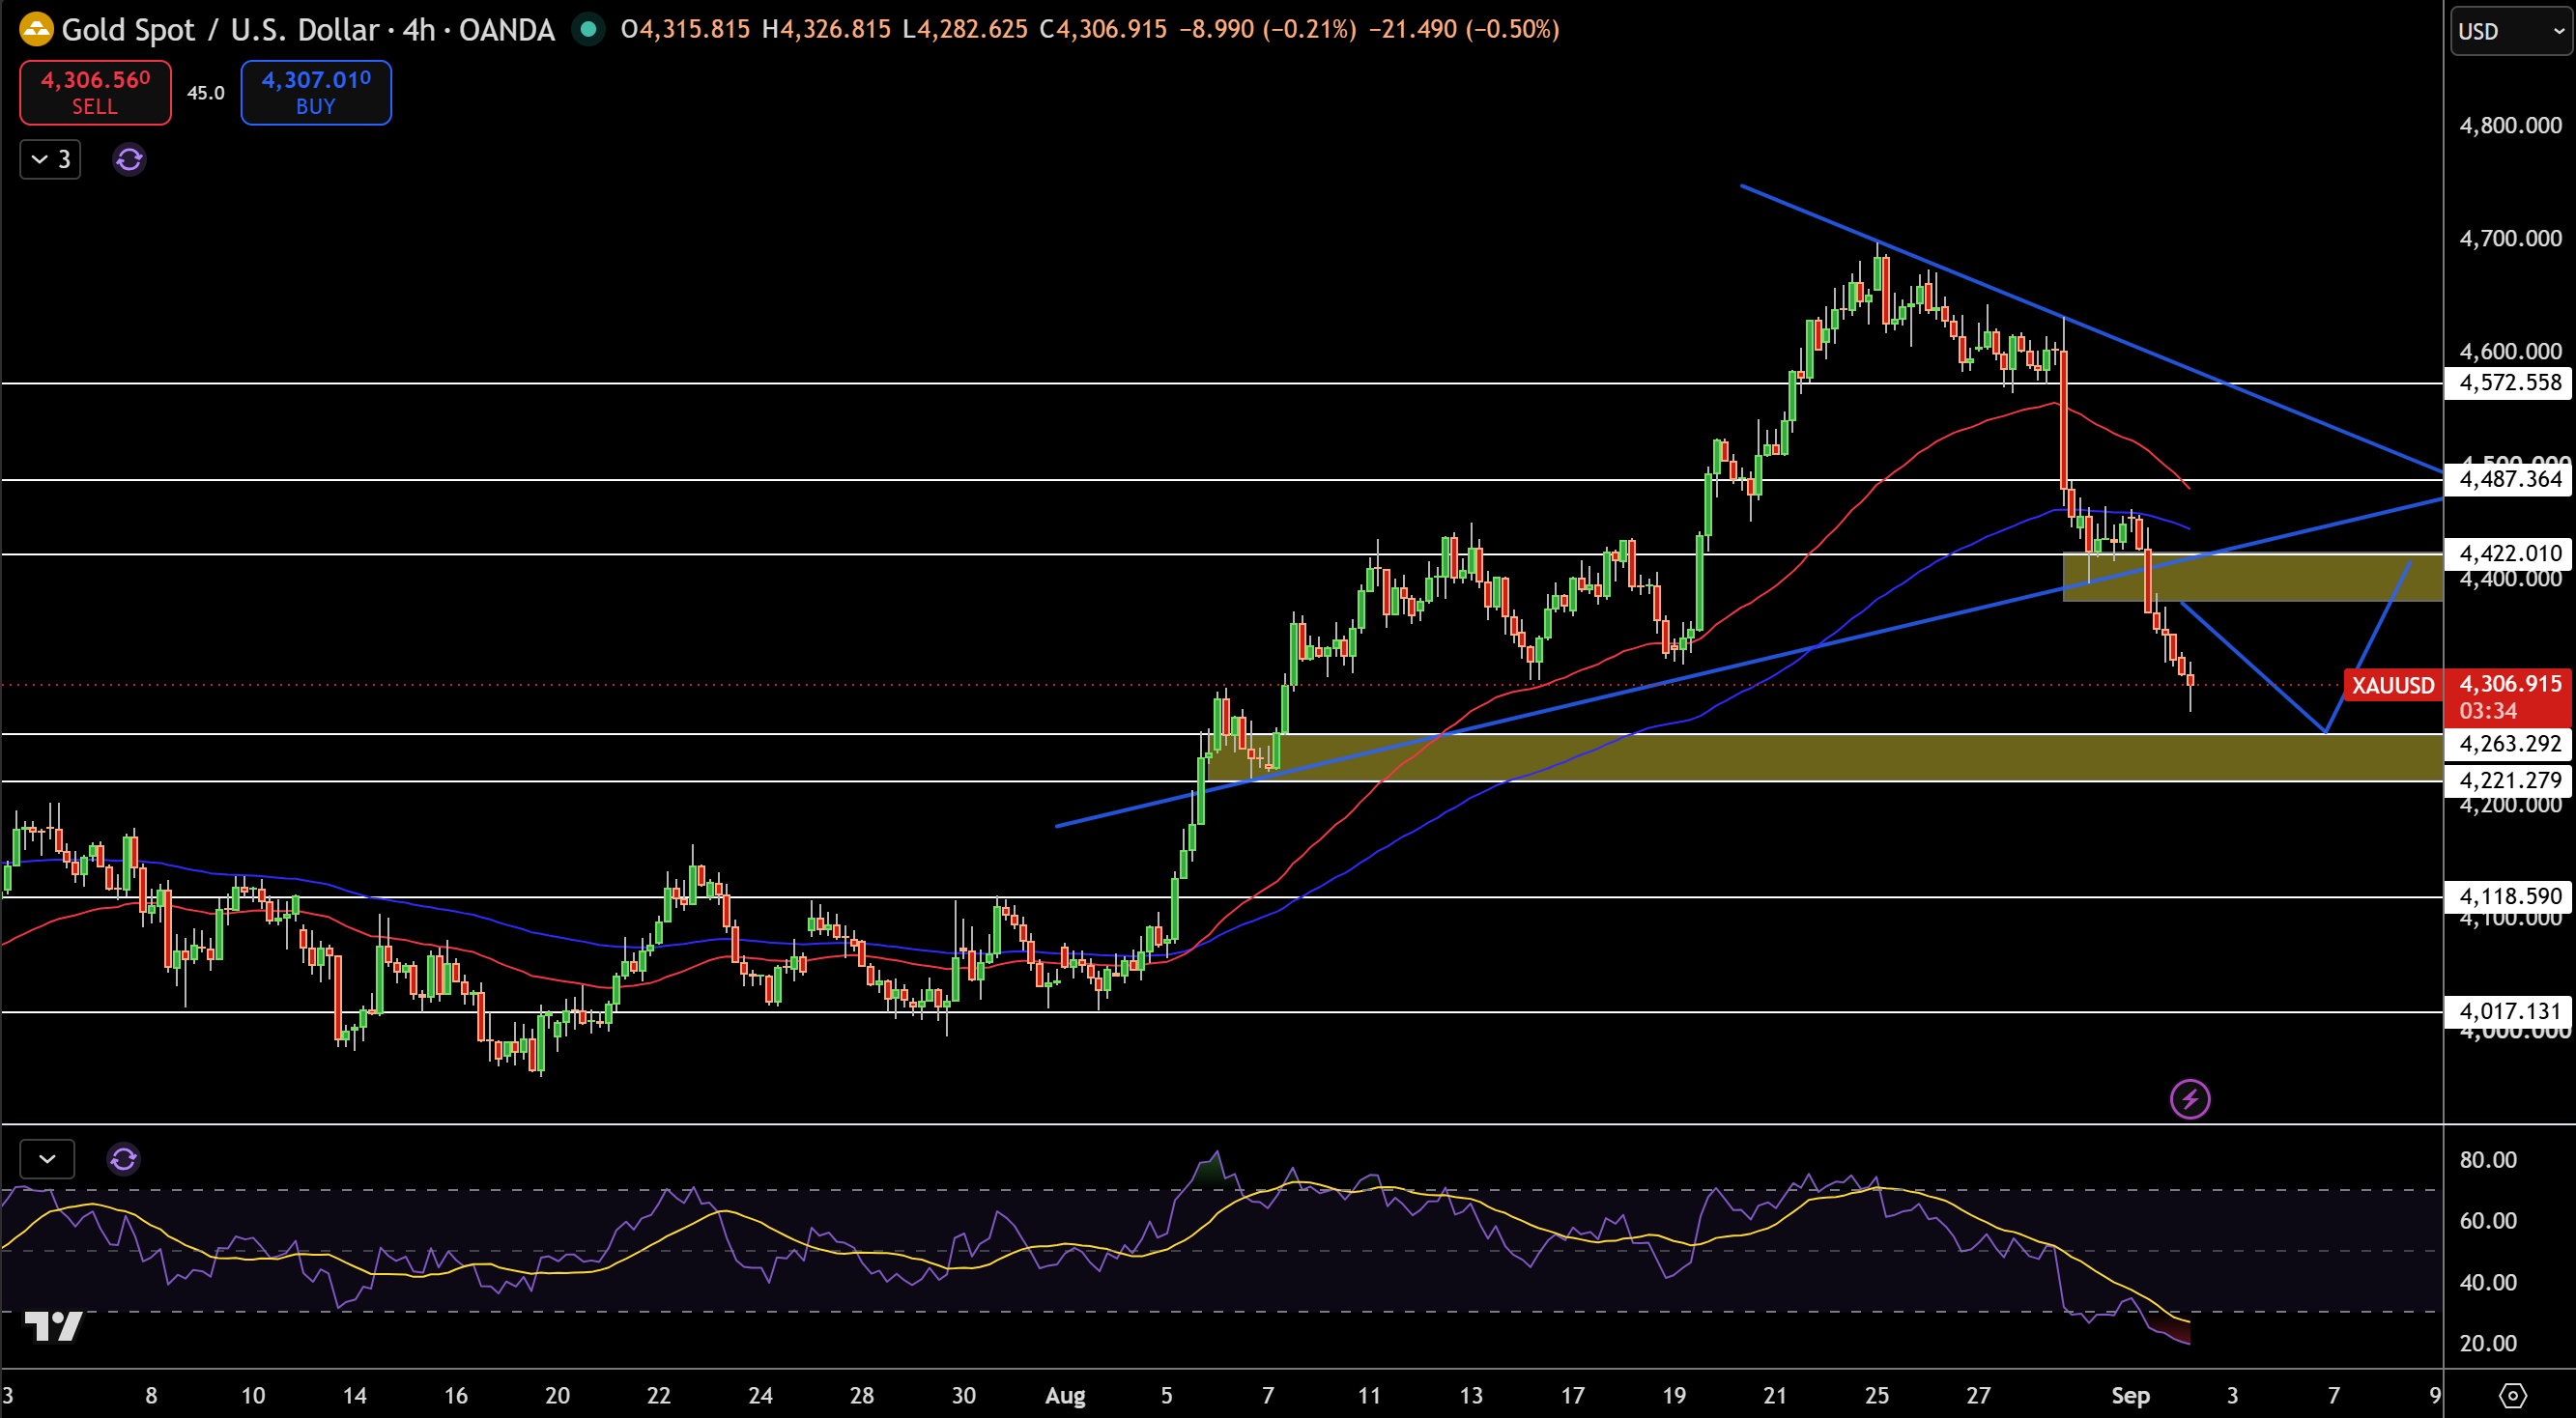
Gold is currently trading at $4,307 with a sharp breakdown from the $4,420 – $4,450 area on the 4-hour chart. I am interested in how quickly price drew a breakdown on the rising trendline and the $4,422 support zone. As price failed to recover, this indicates that the short-term structure was broken significantly.
Price is approaching the $4,263 – $4,221 demand zone, which I will be focusing on next, as the bullish trend is present but bearish momentum is far stretched enough to allow a corrective bounce.
In the meantime, the $4,263 – $4,221 zone is critical, particularly as price has fallen deep into oversold territory, with the RSI reading in the low 20s.
The next resistance levels will be at $4,422, $4,487 and $4,573.
For now, I will remain bearish as Gold trades below $4,422. However, I will start to become less negative with a rise above the $4,422 level and a 4-hourclose in favor of the bulls.
Gold Price Forecast
Every new Gold analysis as it publishes, today's technical signal and key levels, live price — on one page.
See all Gold forecastsSilver Technical Analysis: XAG/USD Loses $65.37 Support as $62.57 Comes Into Focus
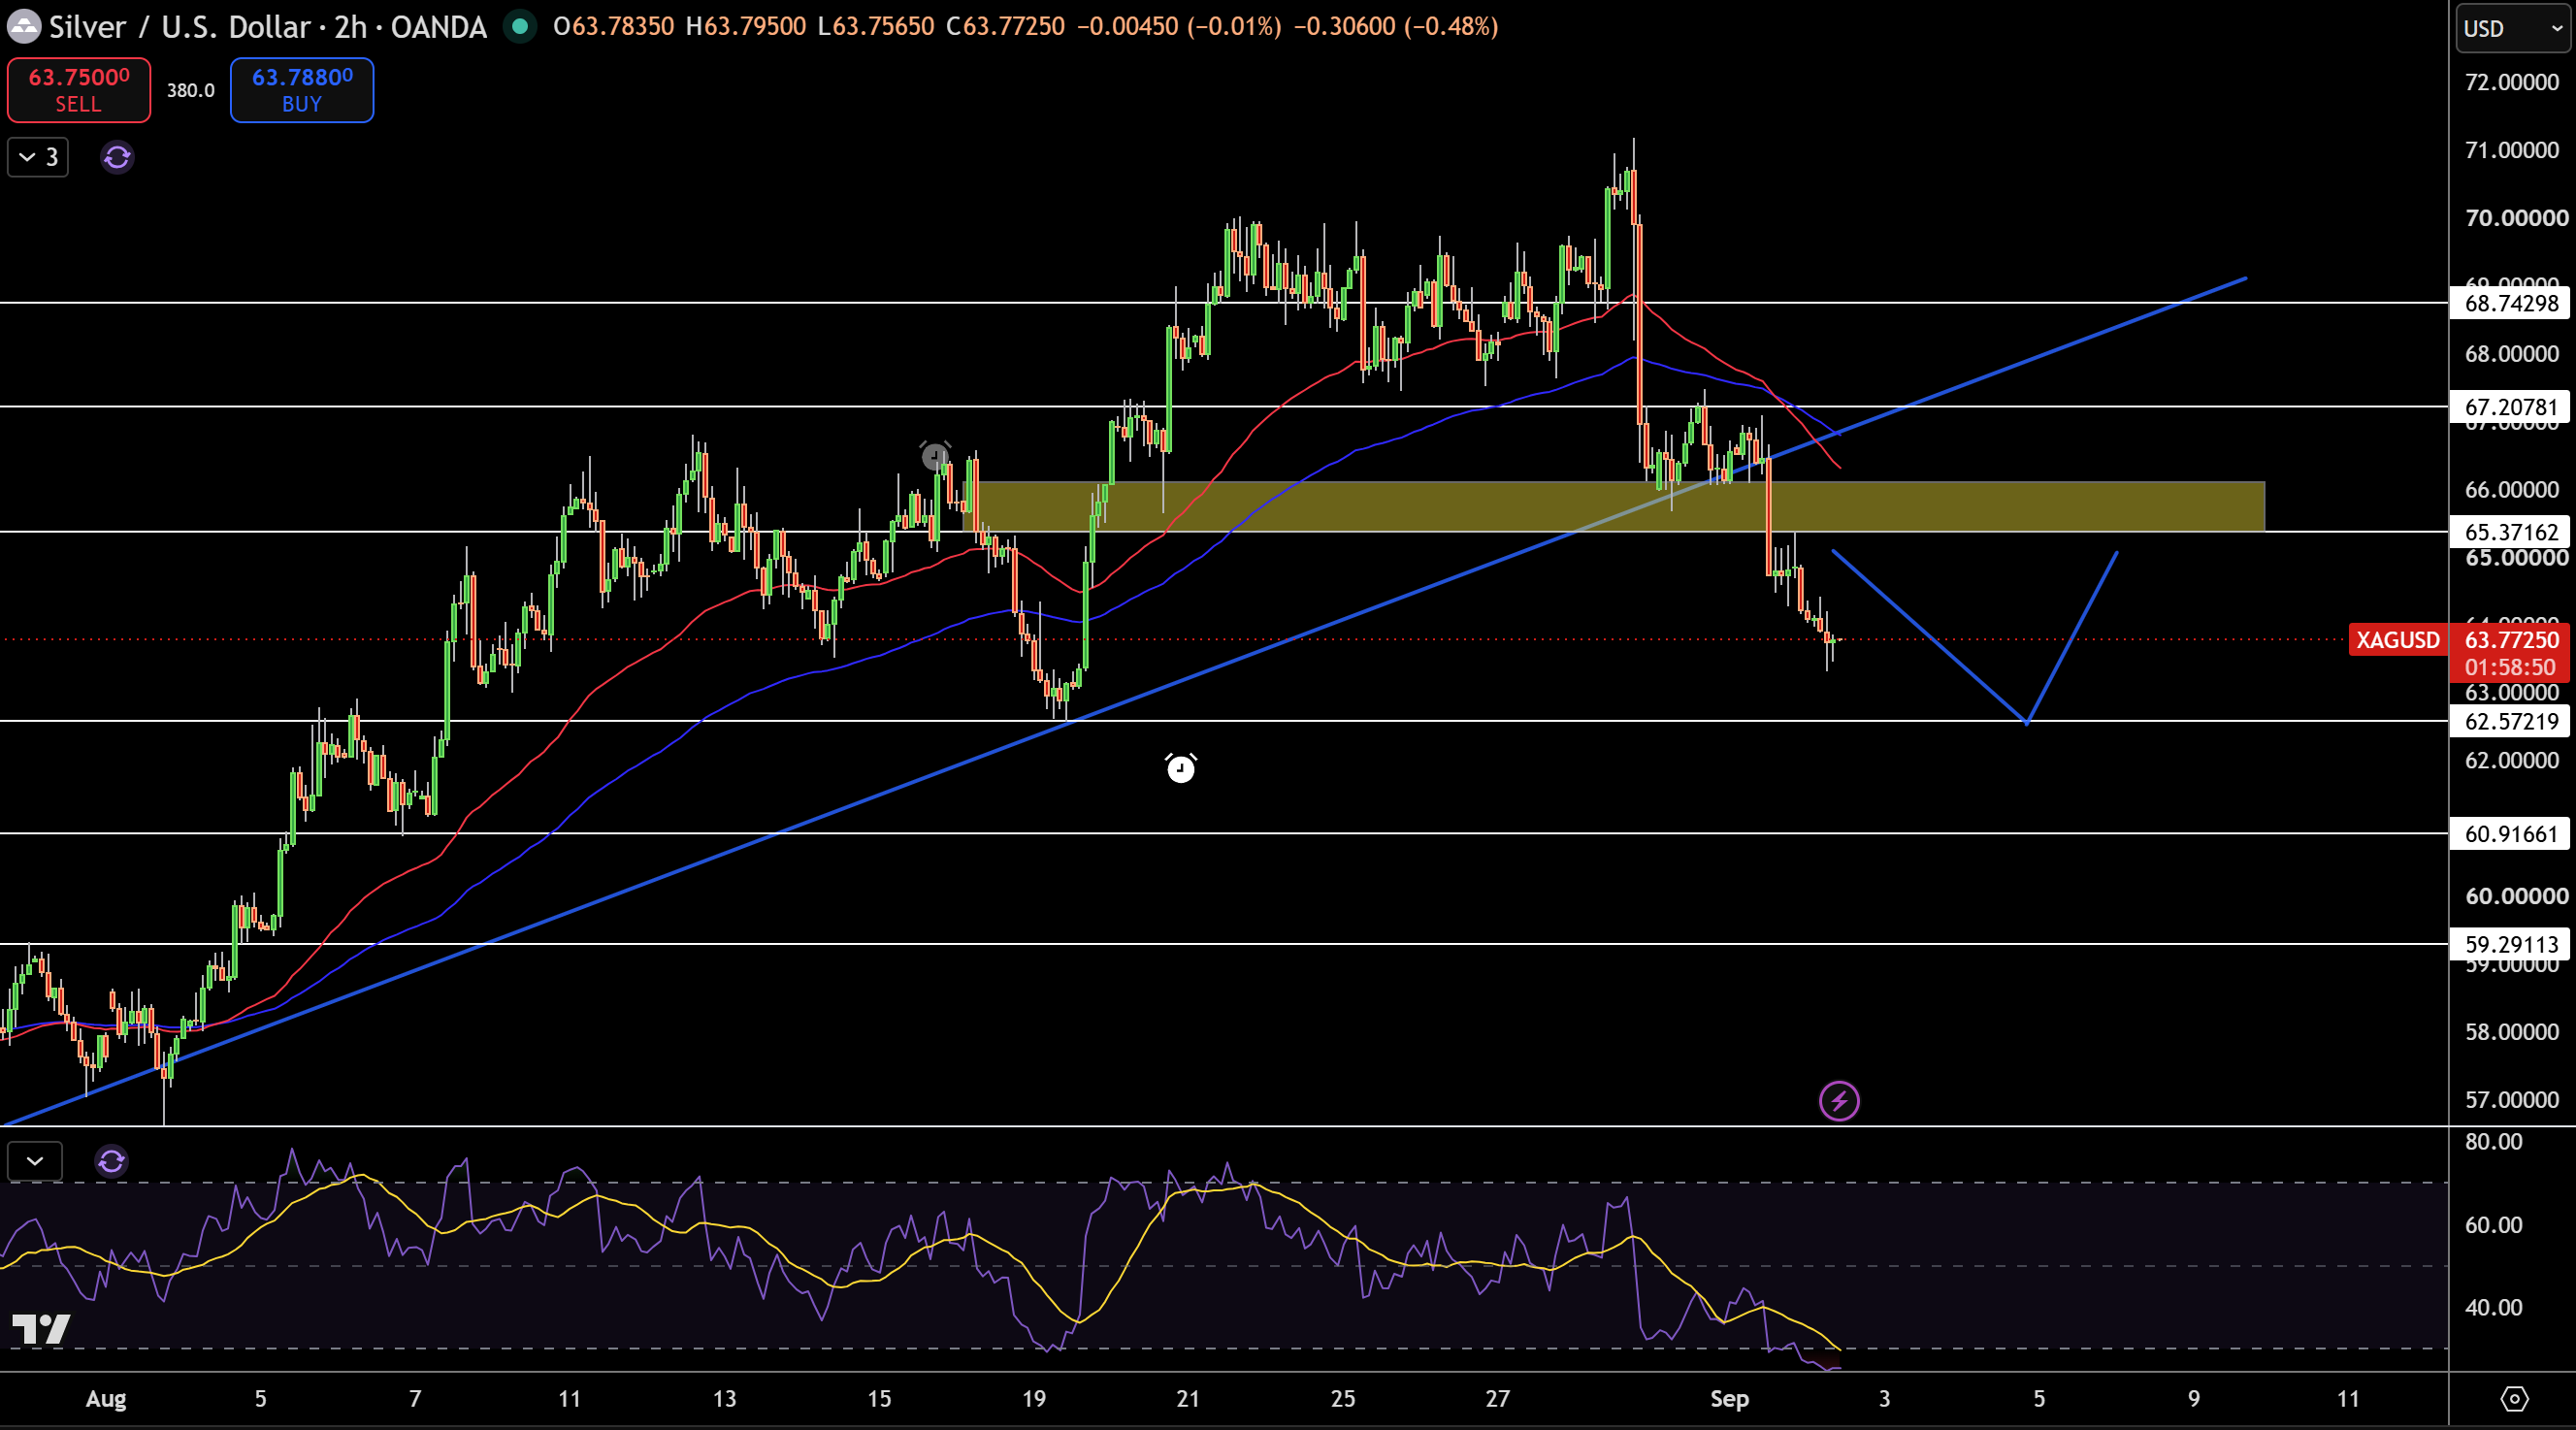
Silver is currently priced at $63.77 on the 2 hour chart after clearly breaking below $65.37 support level and the rising trendline that formed support during the push higher. The selling pressure really surprised me as there was poor follow through buying after the first break. Silver continued to trade lower after they broke their prior support zone and are now likely treating that zone as a resistance.
My next support levels will likely be $62.57 and then $60.92 if selling pressure remains. After the RSI moved into oversold territory, I expect the price to continue to push lower, but I could see a move higher given the current structure before the price moves to lower levels.
Current resistance lies around $65.37 and then $67.21 and $68.74. My overall bias is downtrend as the selloff and price movement has deteriorated overall. Of course, it would be a buy signal if we saw a break of $67.21 as a testing resistance level and more importantly a break of $65.37. The overall momentum remains downtrend until we see a significant break of resistance level that I previously discussed. In my opinion, $62.57 is the prominent support level over $65.37.