
Gold Got the Jobs Number, but Resistance Held
Spot Gold (XAUUSD) jumped after the September payrolls report, then gave back most of the move before it could get through the resistance it lost earlier in the week. The jobs number took another October rate hike out of the trade. It didn’t erase December. The dollar and 10-Year Treasury yield remain too high for gold buyers to call this anything more than a bounce.
At 14:14 GMT, Spot Gold is trading at $4,184.29, up $6.90 or +0.17%. It traded from $4,133.72 to $4,227.53.
The reaction tells the story. Gold had every reason to run after payrolls missed, unemployment moved higher and the prior months were revised down. Buyers got the metal to the session high and stopped just short of the 61.8% retracement level. Sellers were waiting there.

Daily Spot Gold (XAUUSD) Technical Analysis
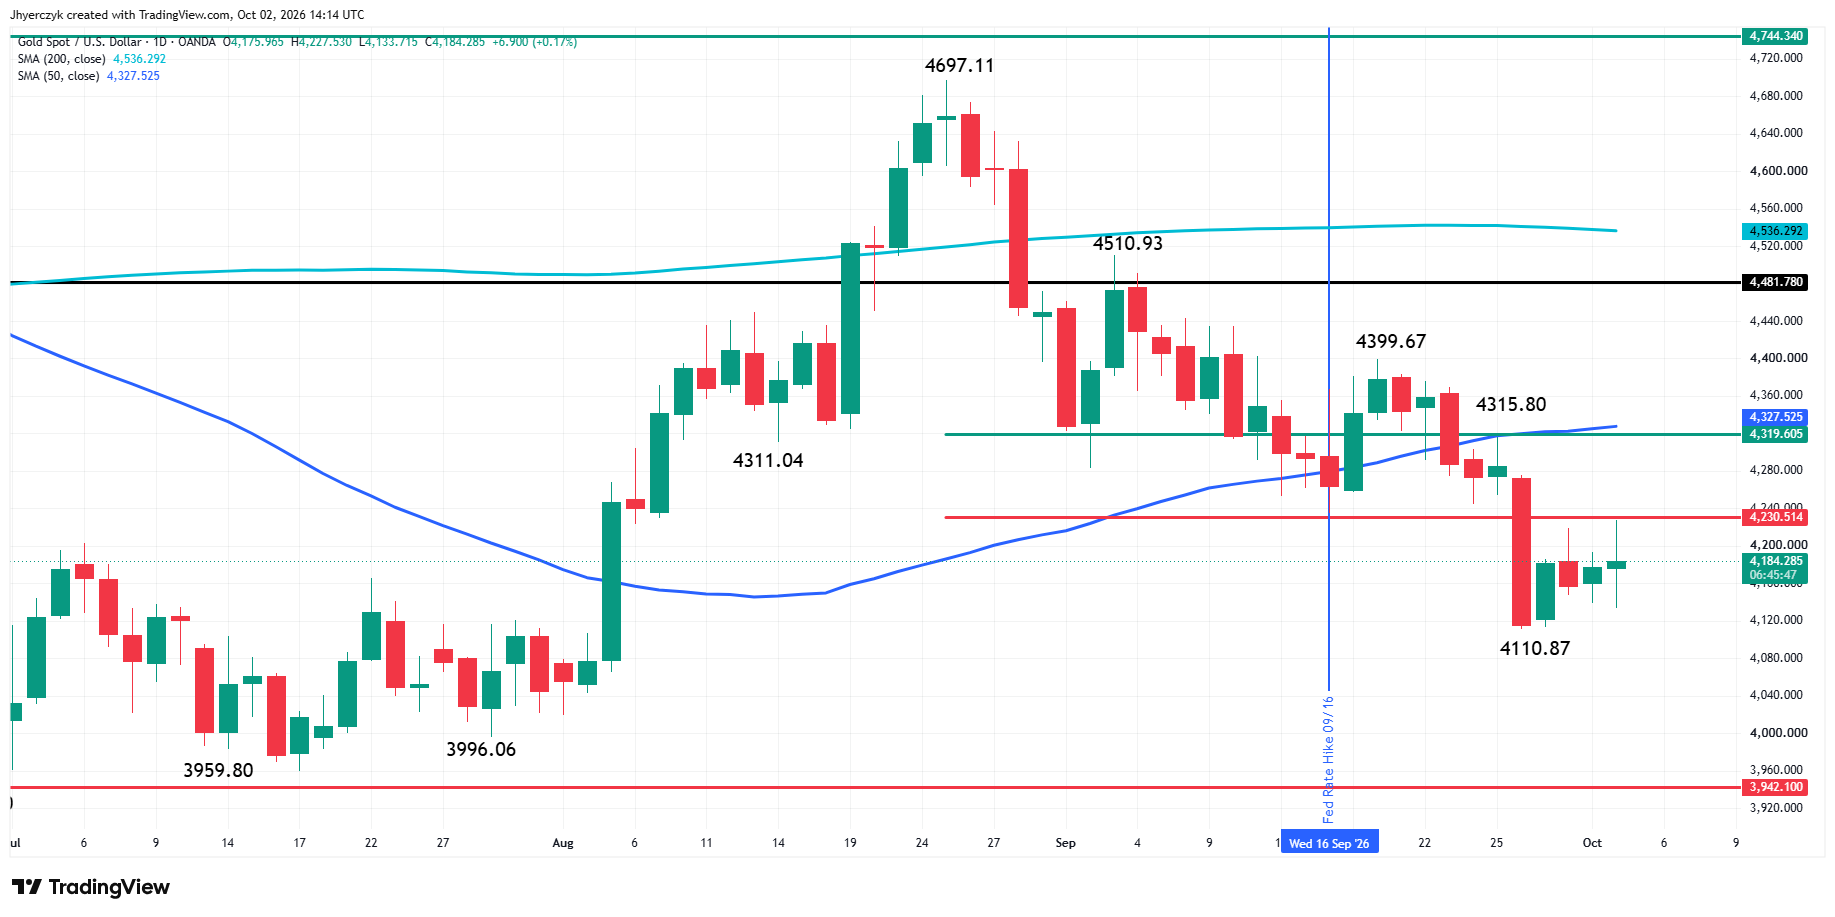
Spot Gold is slightly higher on Friday in a volatile, two-sided trade. The main trend is down according to the daily swing chart. A trade through $4,110.87 will signal a resumption of the downtrend. The main trend will change to up if buyers can take out $4,399.67.
The long-term range is $3,942.10 to $4,697.11. Its retracement zone is $4,319.61 to $4,230.51. Spot Gold is currently trading on the weak side of this zone, making it resistance. Earlier today, the market rallied to $4,227.53 before reversing down. This is slightly below the 61.8% retracement level at $4,230.51.
Spot Gold is also trading on the bearish side of the 50-day moving average at $4,327.50, which can be both resistance and a trend indicator. The 50-day moving average forms a tight resistance cluster with the 50% level at $4,319.61.
Payrolls Took October Off the Table
Gold Price Forecast
Every new Gold analysis as it publishes, today's technical signal and key levels, live price — on one page.
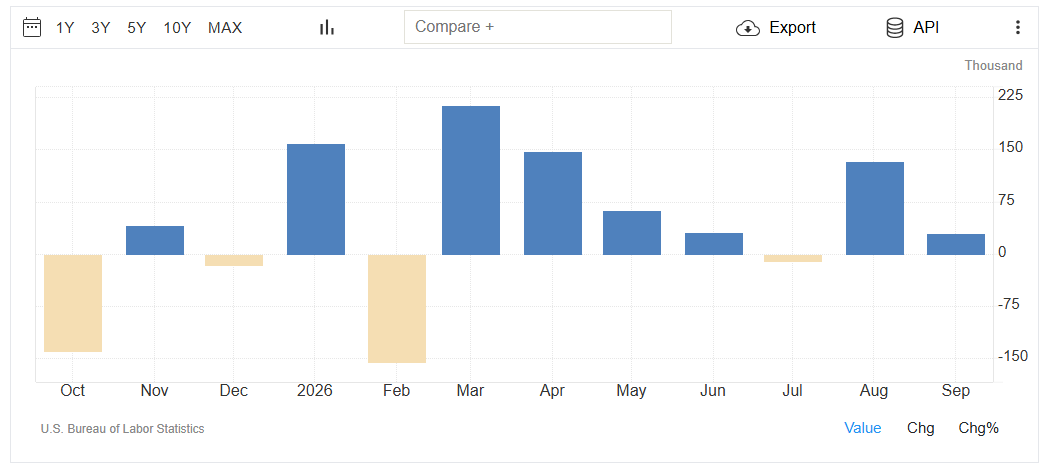
See all Gold forecastsSeptember Non-Farm Payrolls increased by 29,000, well under the 84,000 estimate. The unemployment rate moved up to 4.2% from 4.1%. August payrolls were revised down to 133,000. July flipped from a gain to a 10,000-job loss. The revisions took another 60,000 jobs out of the prior reports.
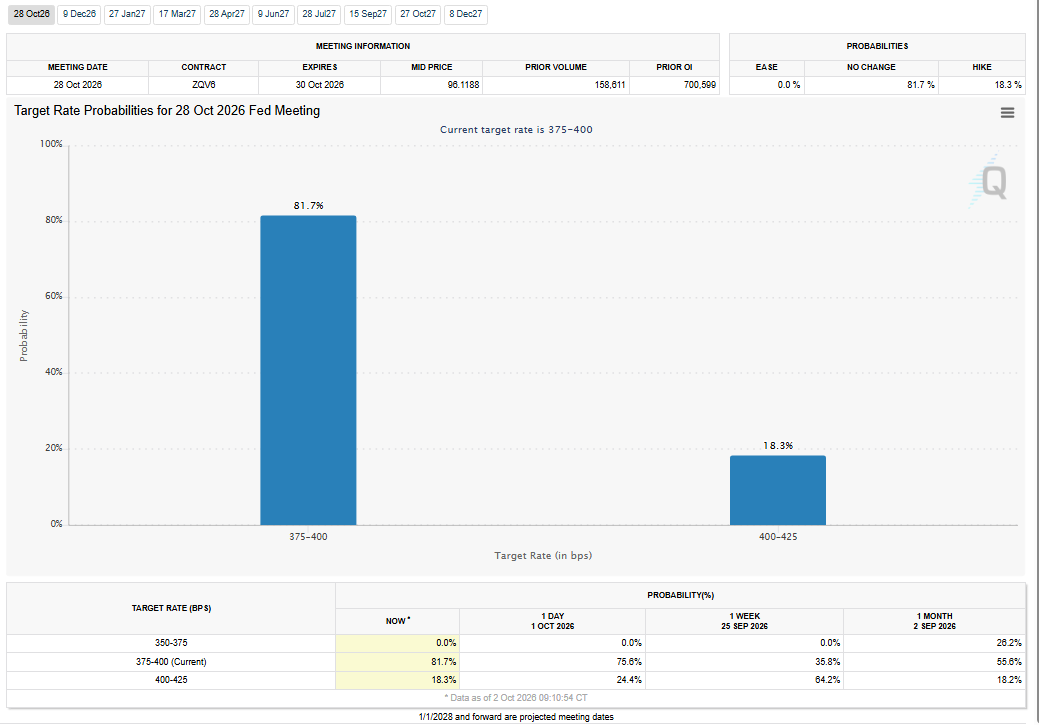
That’s enough to kill the argument that the labor market is tightening again. The CME FedWatch Tool now shows an 81.7% chance policymakers leave rates alone in October. The chance of a hike is down to 18.3%, from 24.4% a day ago, 64.2% a week ago and 18.2% a month ago.
Gold buyers got the short-end rate relief they were looking for. The October meeting is no longer carrying the urgency it had at the start of the week.
The Market Pushed the Rate Trade to December
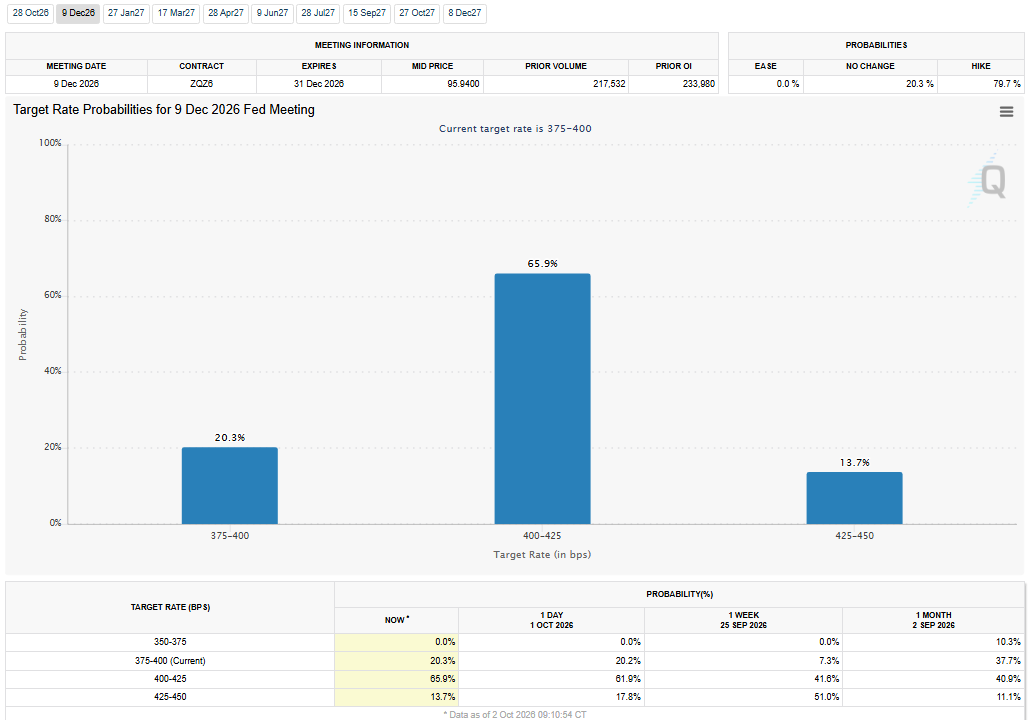
October isn’t the same thing as the Fed being finished. December FedWatch pricing still has only a 20.3% chance rates stay where they are. The market is assigning a 65.9% chance of one more quarter-point increase by then and a 13.7% chance of two.
That leaves nearly 80% odds that rates are higher by the December meeting. All the jobs report changed was the timing.
The market will buy a weak payrolls report and squeeze some shorts, but nobody’s pricing a clean path from rate hikes to cuts yet. Inflation is still above target, energy remains a risk and December is now where the hawks get their next chance.
Treasury Yields and the Dollar Backed Off, but They’re Still High
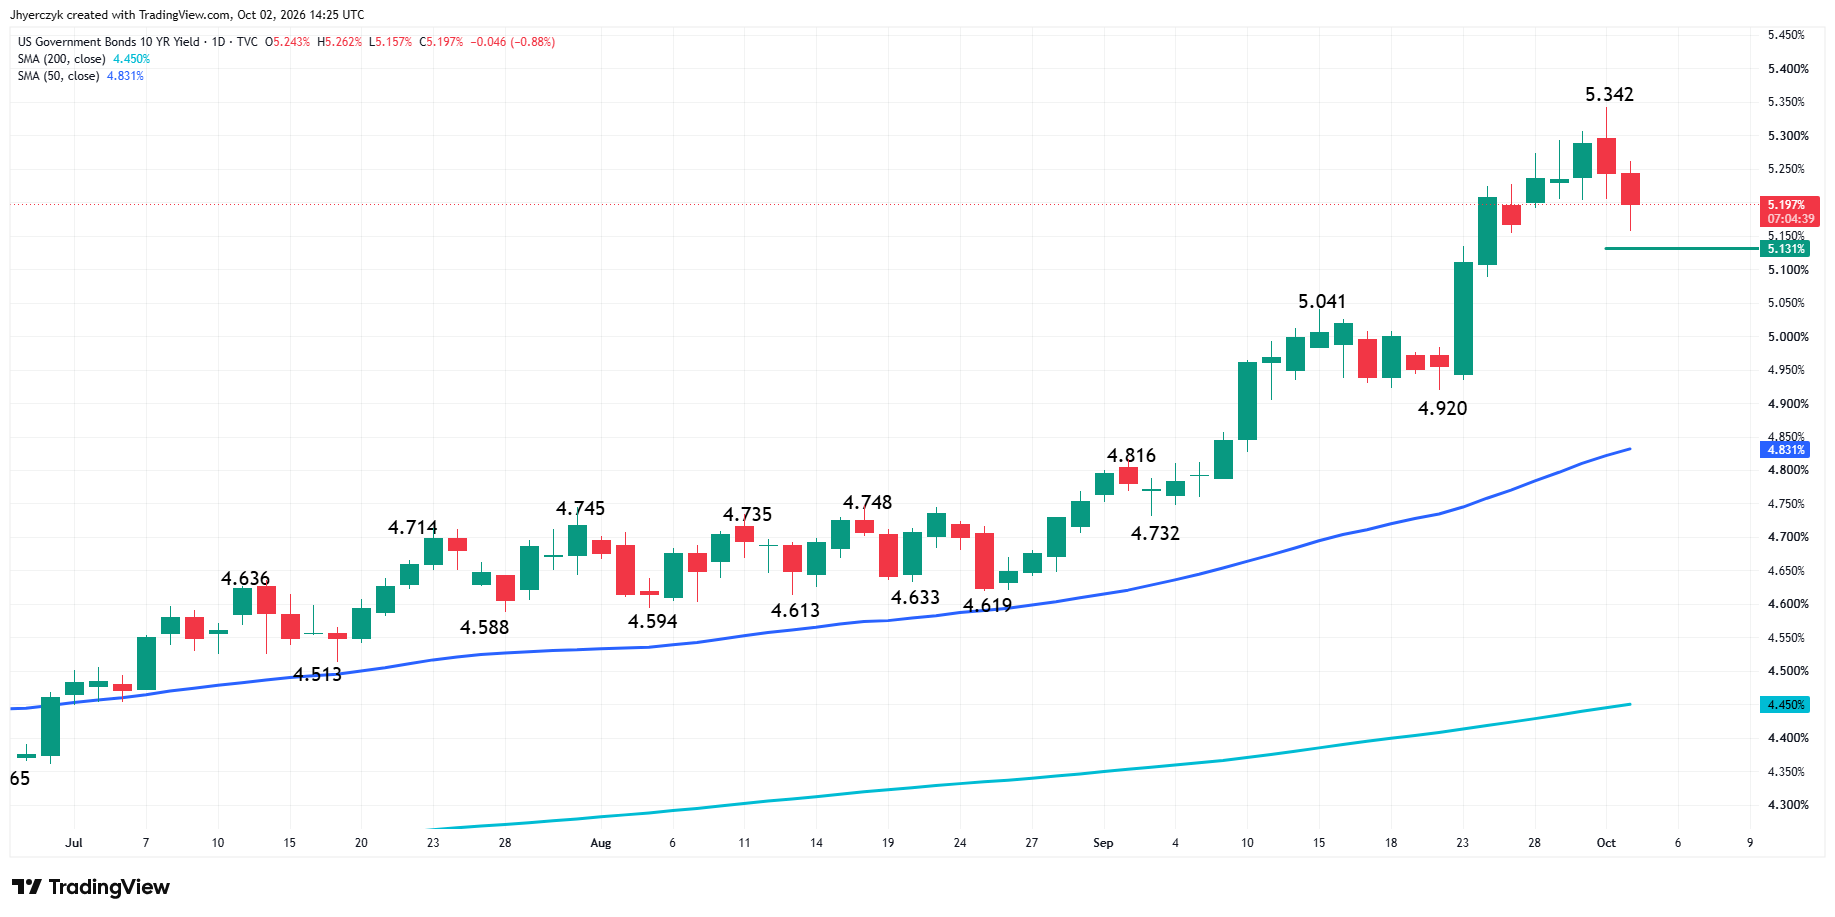
The 10-Year U.S. Treasury yield reached 5.342% Thursday, its highest level since 2002. It fell to 5.157% after payrolls and was near 5.20% in the latest trade. That’s a meaningful reversal from the high, but yields remain well above the 50-day moving average near 4.83%.
Gold needs that move to continue. One down day in yields after a fast run higher can be profit-taking just as easily as a change in the larger trade. Bond buyers have to keep taking offers before gold gets a real tailwind.
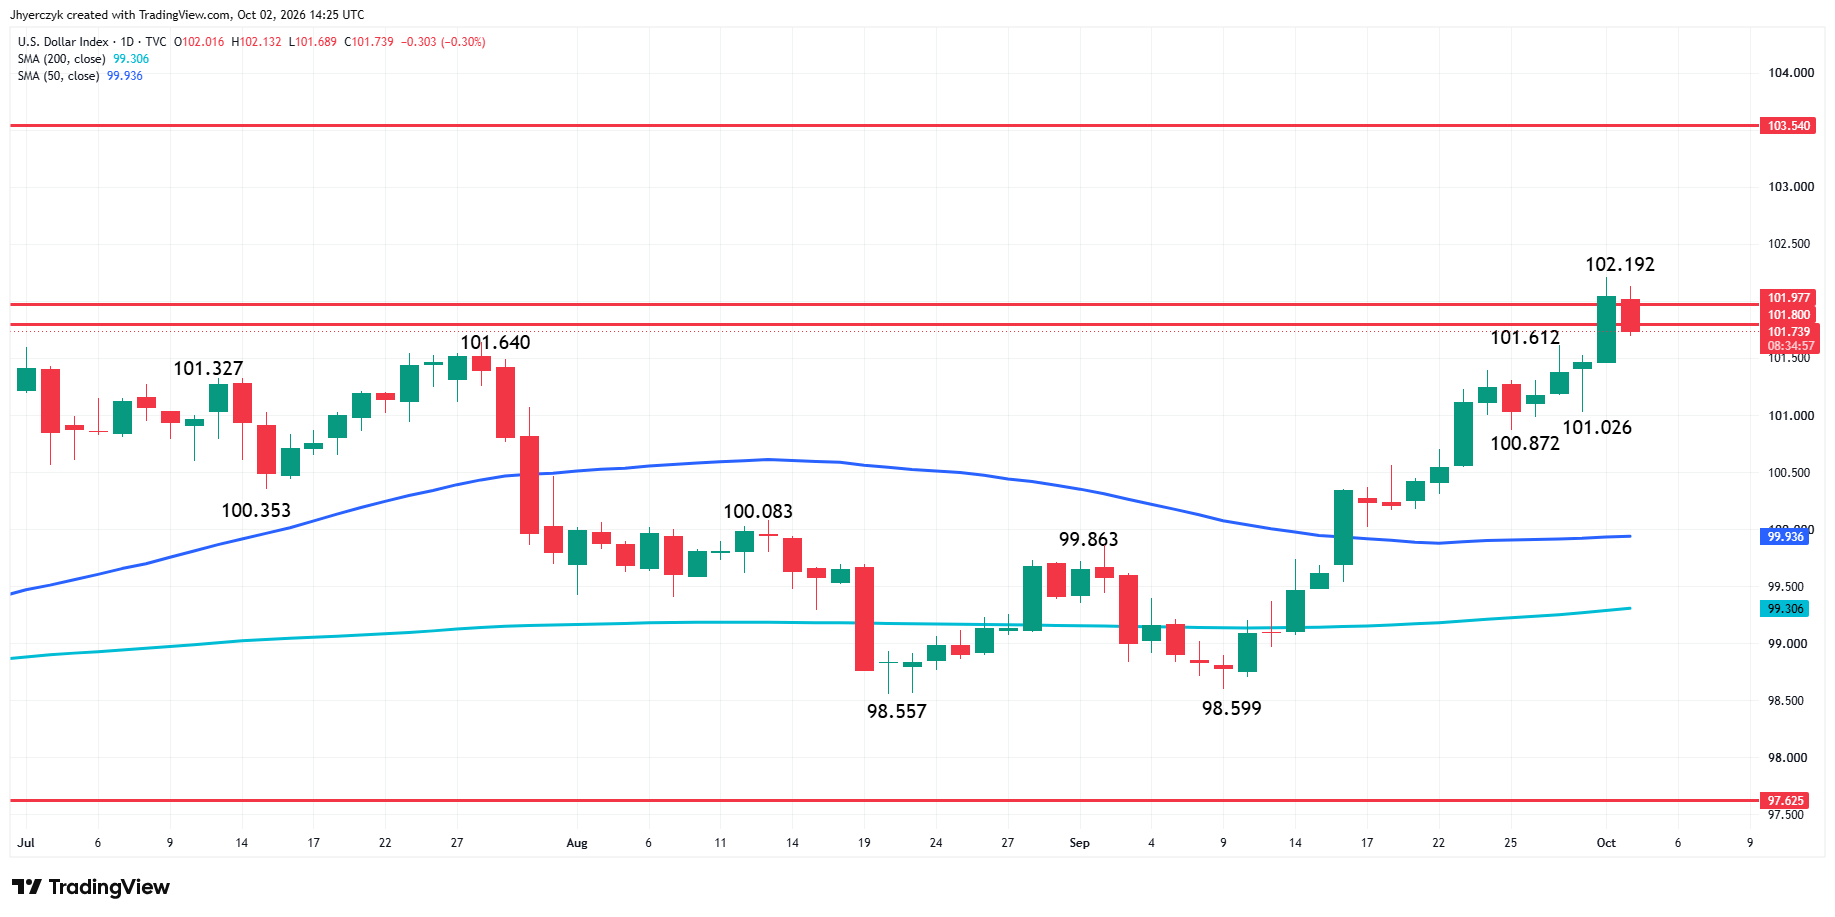
The U.S. Dollar Index eased after the report, falling from a session high at 102.132 to near 101.74. It remains above the 50-day moving average at 99.94 after a sharp run higher. The dollar gave gold some room Friday. Control of the currency trade is another matter.
That’s why gold couldn’t hold the first spike. The metal got a weaker jobs report, lower October hike odds, a lower 10-Year yield and a softer dollar. It still couldn’t take out the 61.8% level.
What to Watch
The payrolls report pushed the October rate trade out of the way. Friday’s bounce is running on short-end relief. Gold still needs the long end of the bond market to follow it lower. The 10-Year and the dollar backed off Friday without breaking anything on their charts.
The bias is to the downside with the main trend down on the swing chart. The jobs report gave gold a chance to repair the break and it stalled before the 61.8% level at $4,230.51. Spot Gold is still trading under the 50% level at $4,319.61 and the 50-day moving average at $4,327.50. This week’s low at $4,110.87 is the level underneath.
If you’d like to know more about how to Spot Gold, please visit our educational area.