SpaceX and Sandisk Bounce but Cannot Hold the Recovery
The AI spending trade is still under pressure Thursday. SpaceX found buyers after breaking to $105.11 and bounced to $115.75, then faded back to $109.22. Sandisk ran from $1558.61 to $1696.37 and gave most of it back. Those are bounces off weak lows from traders picking at oversold names, not a market deciding the AI investment story is fixed.
The indexes are quiet and that is hiding a rough session underneath. The Dow is pulling back after a run of record closes. The Nasdaq is barely positive despite the intraday recoveries. AppLovin is sharply lower after mixed results. The market is still cutting positions in companies where earnings were strong but the spending bill was stronger. Hormuz talks continue with Iran and Oman working toward a temporary arrangement, and oil is slightly higher.
The S&P 500 is trading 7715.00, down 8.55 or 0.11% at 16:00 GMT. The Nasdaq Composite is up 0.04%. The Dow is down 295.25 points or 0.54%.

SpaceX Lockup Bounce Stalled at Resistance
SpaceX is trading $109.22, up $1.55 or 1.43% at 16:07 GMT. The session high is $115.75. The low is $105.11.
The 6.4% intraday rebound looked good for about an hour. Buyers stepped in near the all-time low at $104.83 and the stock ran, but it stalled right at the retracement zone and came back. The lockup allows up to 20% of restricted insider and early-investor shares to be sold, and the stock is still more than 25% below where it traded after its June 12 debut. The earnings report was strong on revenue. The market focused on $18.4 billion in second-quarter capital expenditures, most of it going into AI infrastructure, and decided the cost of the buildout matters more than the top line right now.
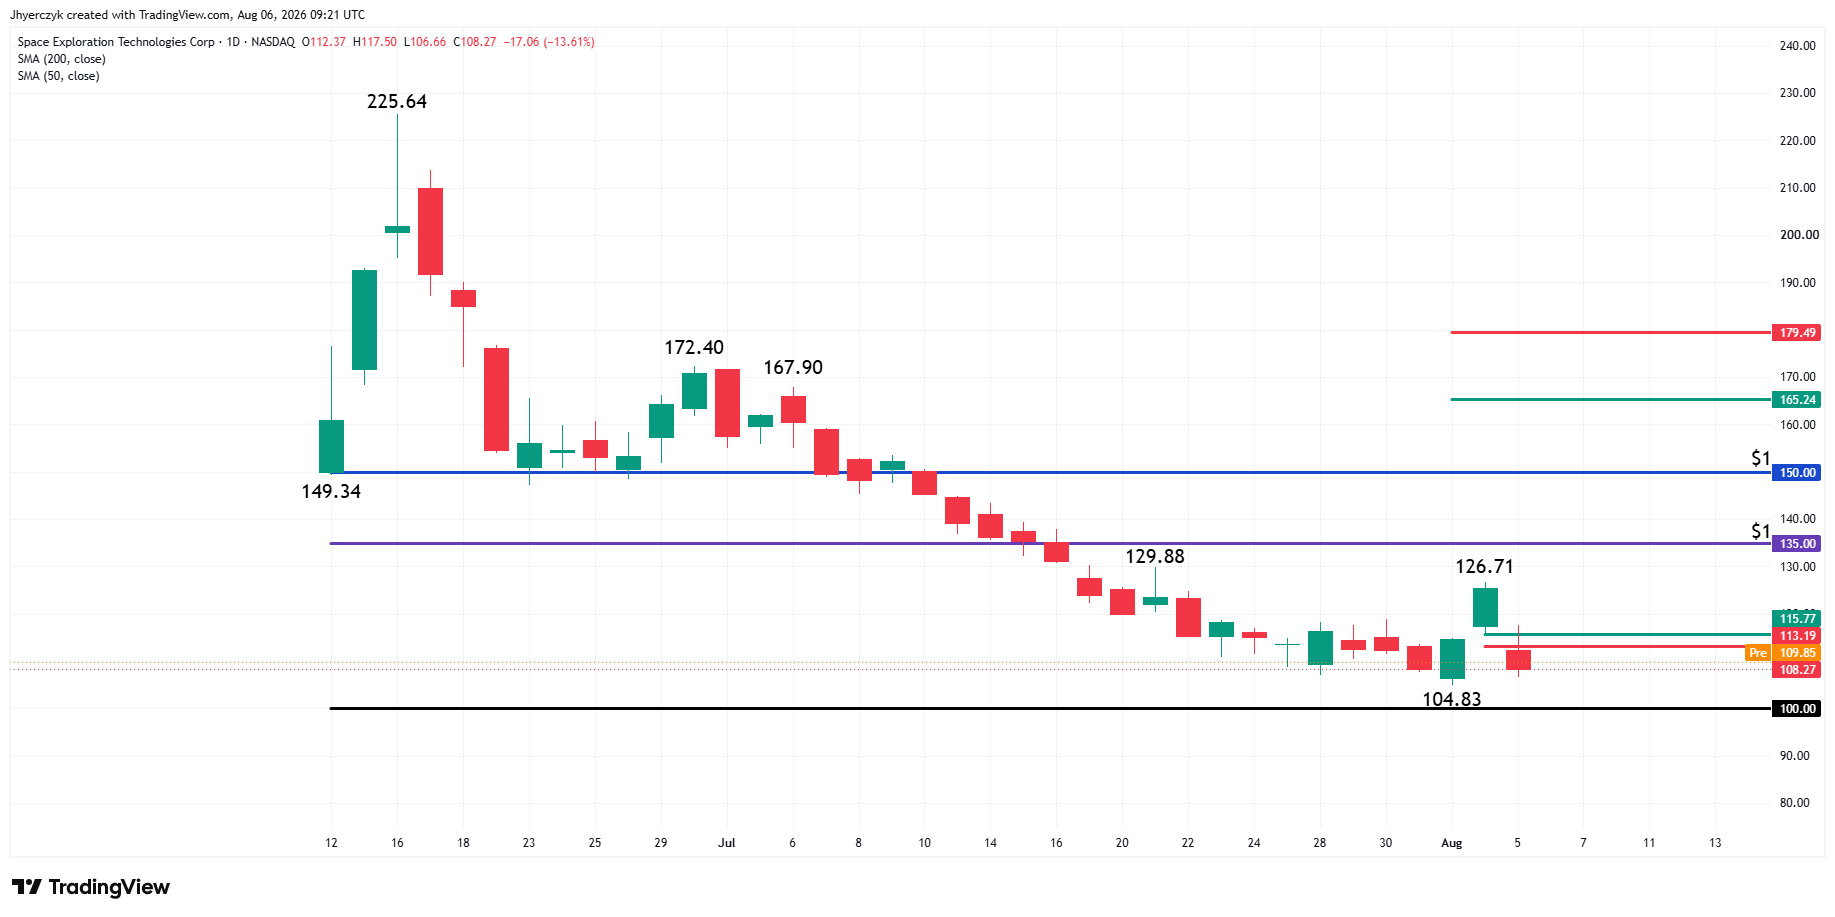
Technically, SpaceX is trading higher after an intraday break to $105.11 attracted buyers ahead of the all-time low at $104.83 and the psychological $100.00 level.
The short-term range is $104.83 to $126.71. Its retracement zone at $113.19 to $115.77 capped gains Thursday. A sustained move over $115.77 will indicate the buying is getting stronger. If this creates enough upside momentum, this week’s swing top at $126.71 will come into play. Taking out this level with conviction will put the IPO price at $135.00 back on the map.
On the downside, a trade through $104.83 will reaffirm the downtrend. Taking out $100.00 would be a negative psychological event and could trigger an acceleration to the downside.
Dow Jones Price Forecast
Every new Dow Jones analysis as it publishes, today's technical signal and key levels, live price — on one page.
See all Dow Jones forecastsSandisk Rebound Does Not Fix the Chart
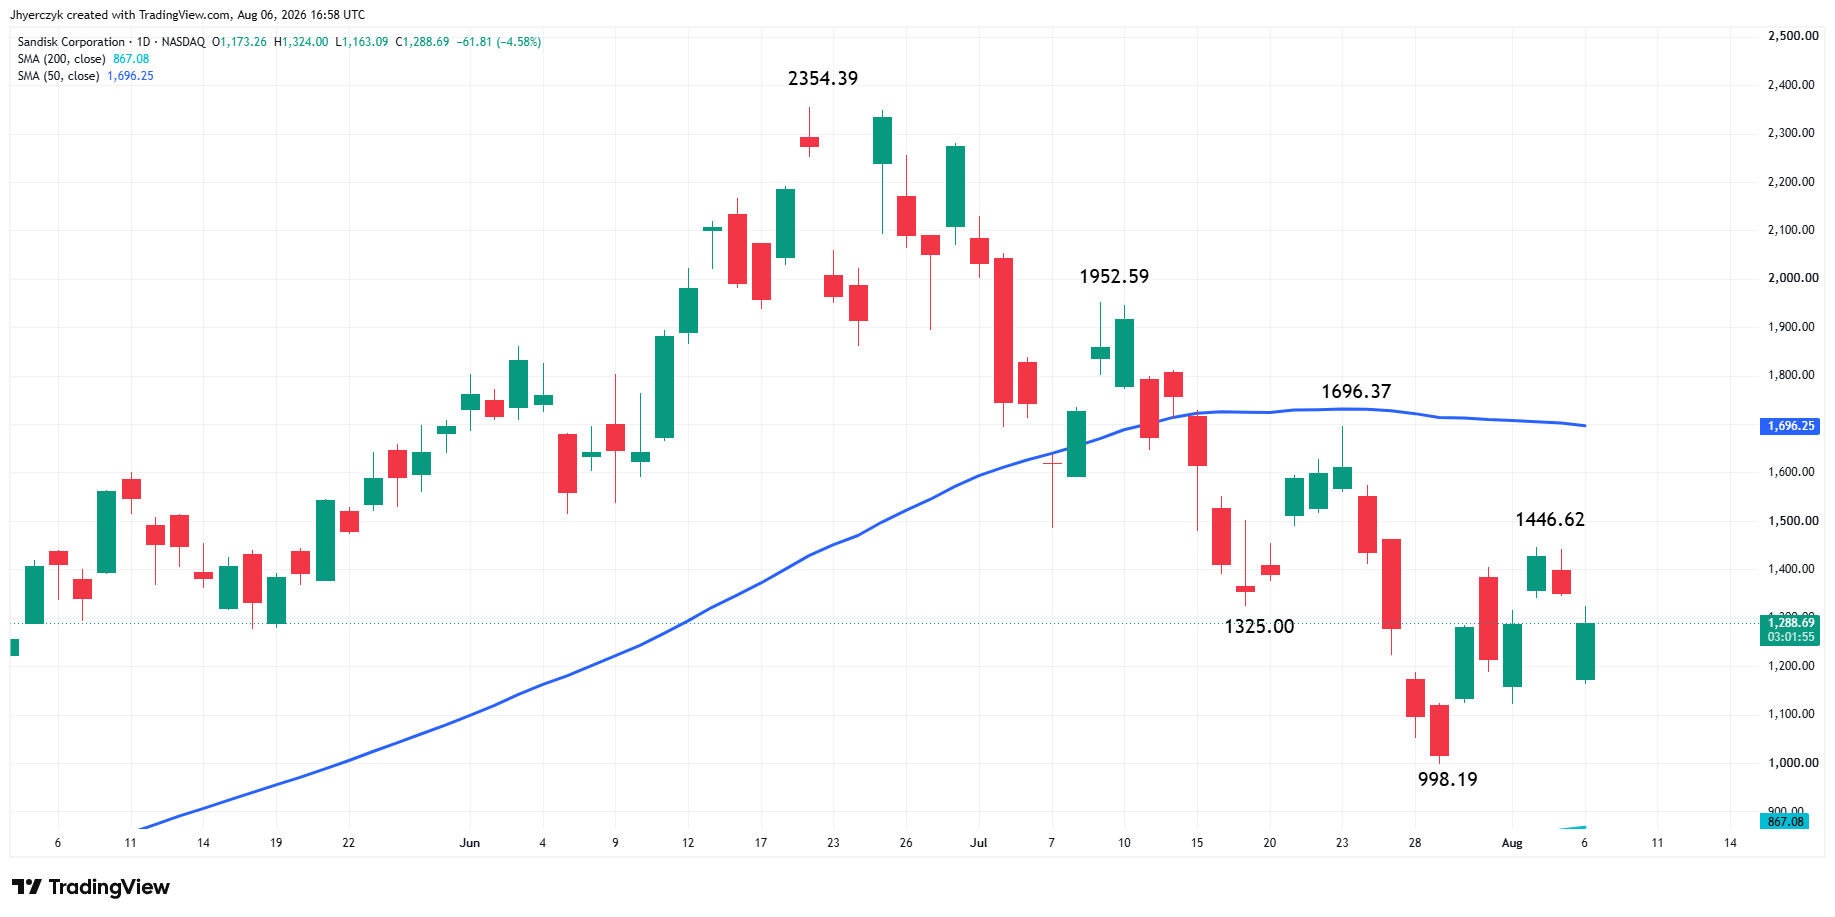
Sandisk is trading $1610.33, up $11.06 or 0.69% at 16:10 GMT. The stock recovered from $1558.61 but could not hold $1696.37.
The bounce does not change the larger picture. Sandisk has been posting lower tops and lower bottoms since the $2354.39 all-time high in June. The 50-day moving average offered almost nothing when it was tested in mid-July and is now resistance.
Data-center revenue rose more than 400% in 2026 from 2025 and doubled quarter over quarter. High-end memory is tight. The market is not selling demand. It is selling the idea that upside revisions keep coming at the same pace after a historic run. Sandisk guided first-quarter revenue between $10.3 billion and $10.8 billion. Western Digital forecast roughly $4.1 billion. Both beat estimates. Both were sold.
The 200-day moving average at $867.04 is the major downside level on the chart.
Hormuz Talks Continue but Ships Have Not Moved
Oil is slightly higher Thursday as Iran and Oman work toward a temporary arrangement that would reportedly allow transit without fees or tolls. The larger question of Iranian control over the route is still unresolved. The market has traded multiple diplomatic headlines during this conflict and the next confirmation has to come from normal tanker traffic, not another statement. If the arrangement holds, crude stays contained and the inflation pressure stays off equities. If it falls apart, oil comes back and the rate trade follows it into stocks.
Stocks in the News
AppLovin is sharply lower after mixed results. Seagate, Micron, SK Hynix, Intel, AMD and Marvell remain under pressure as traders reduce exposure to names priced for another upside surprise.
Daily S&P 500 Index (SPX) Technical Analysis
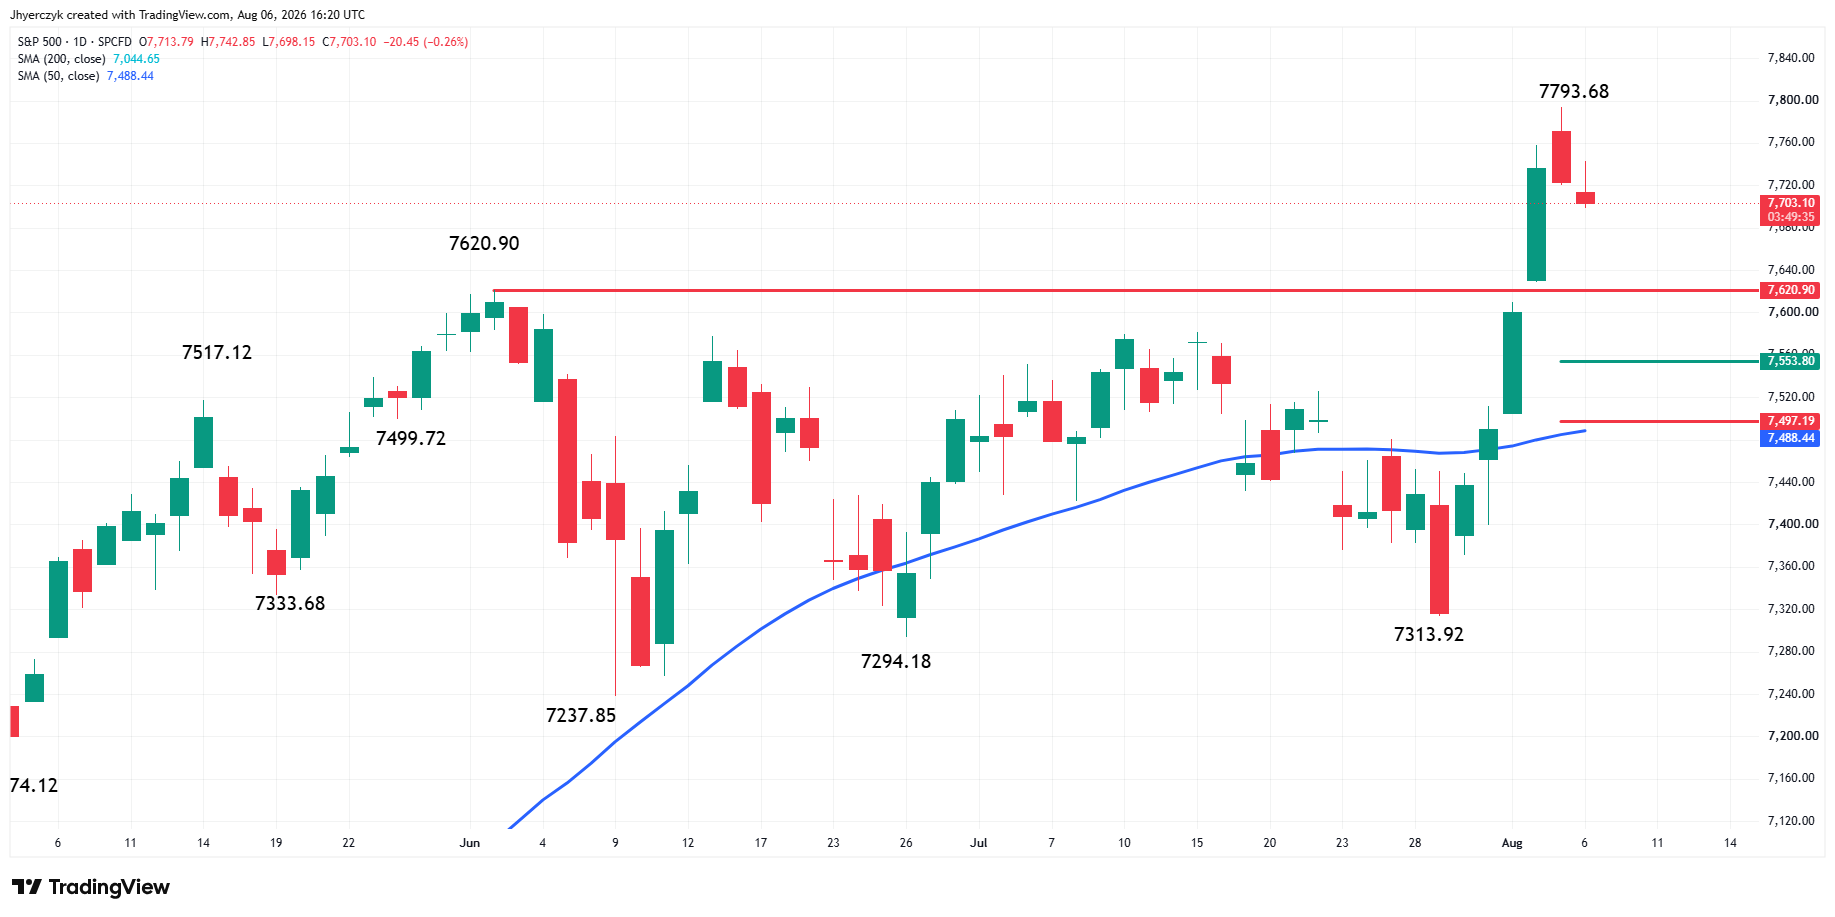
The S&P 500 Index is edging lower at the mid-session. Taking out yesterday’s low at 7720.17 confirmed Wednesday’s closing price reversal top at 7793.68.
A trade through 7793.68 will negate the potentially bearish chart pattern and reaffirm the uptrend. However, the confirmation of the chart pattern means we could see the start of a two to three-day correction back to 50% to 61.8% of the rally from 7313.92. This target zone is 7553.80 to 7497.19, which is slightly above the 50-day moving average. This is the indicator that launched the start of the current rally.
Daily Nasdaq Composite (IXIC) Technical Analysis
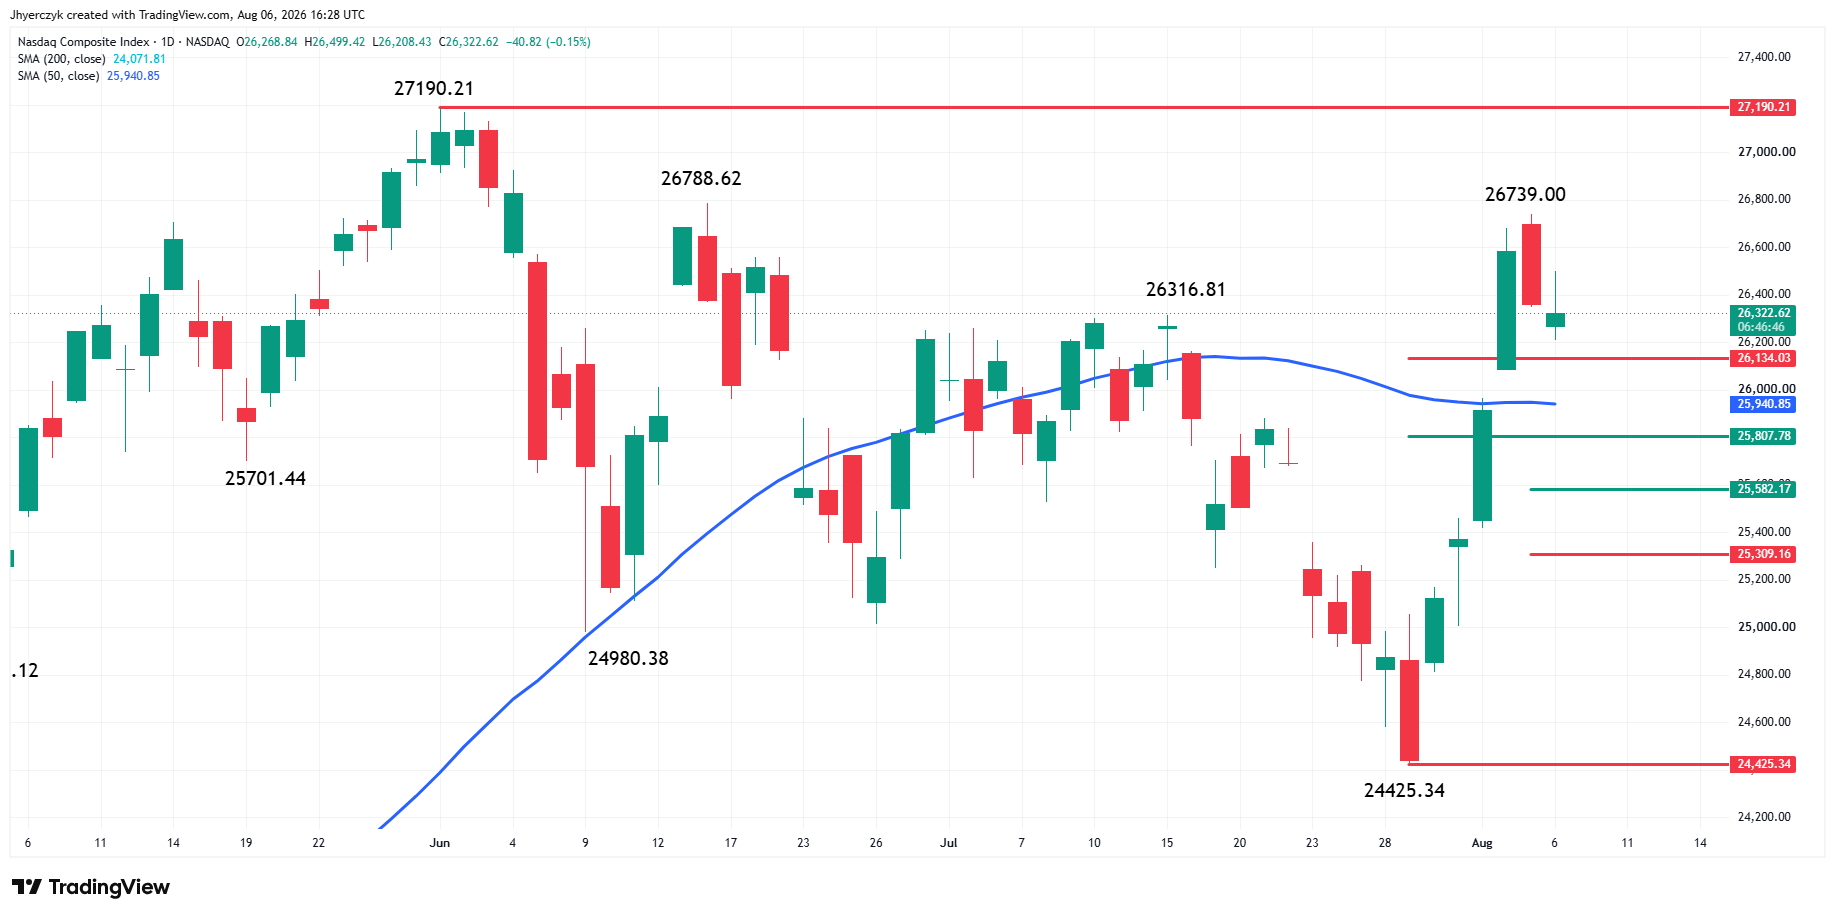
The Nasdaq Composite is whipsawing on Thursday, but lower after confirming yesterday’s closing price reversal top at 26739.00. The first downside target today is the long-term Fibonacci level at 26134.03, followed by the 50-day moving average at 25940.59 and the long-term 50% level at 25807.78.
If all of these early support levels fail then look for a 50% to 61.8% correction of the entire rally from 24425.34 to 26739.00. This target zone is 25582.17 to 25309.16.
What to Watch
SpaceX bounced off its low and stalled at the retracement zone. The intraday recovery in Sandisk looked the same way, a fast run that faded before it could change the pattern of lower tops the stock has been building since June. Until one of these names can close above resistance instead of just visiting it for an hour, the AI spending trade is still a sell-the-rally market dressed up as buy-the-dip.
The indexes are flat because the selling is selective, not because it stopped. Buyers are supporting companies with visible revenue growth and manageable costs. Everything tied to heavy AI capital spending is getting sold until the returns catch up. Friday’s payrolls is still ahead and a strong report rebuilds the rate trade on top of a tech sector already dealing with valuation questions. The confirmed reversal patterns on the S&P 500 and Nasdaq point to a possible pullback toward the 50-day moving averages if selling picks up from here.
More Information in our Economic Calendar.