Amazon Carries Friday but Most Stocks Finished Lower
Wall Street closed higher Friday on Amazon’s 15% surge, but declining S&P 500 stocks outnumbered advancers 1.3 to 1. The rally came from a handful of names. The breadth did not follow.
The S&P 500 gained 0.70% to 7,489.72. The Nasdaq Composite rose 1% to 25,373.85. The Dow added 0.53% to 52,485.03. Volume hit 20.6 billion shares, well above the 20-session average of 17.1 billion.
The S&P 500 rose 1.05% for the week and the Nasdaq gained 1.59%. July was a different story. The S&P 500 finished the month roughly flat. The Nasdaq lost 3.2%. Friday put a better number on the screen. It did not fix what July did to technology.

Daily S&P 500 Index (SPX) Technical Analysis
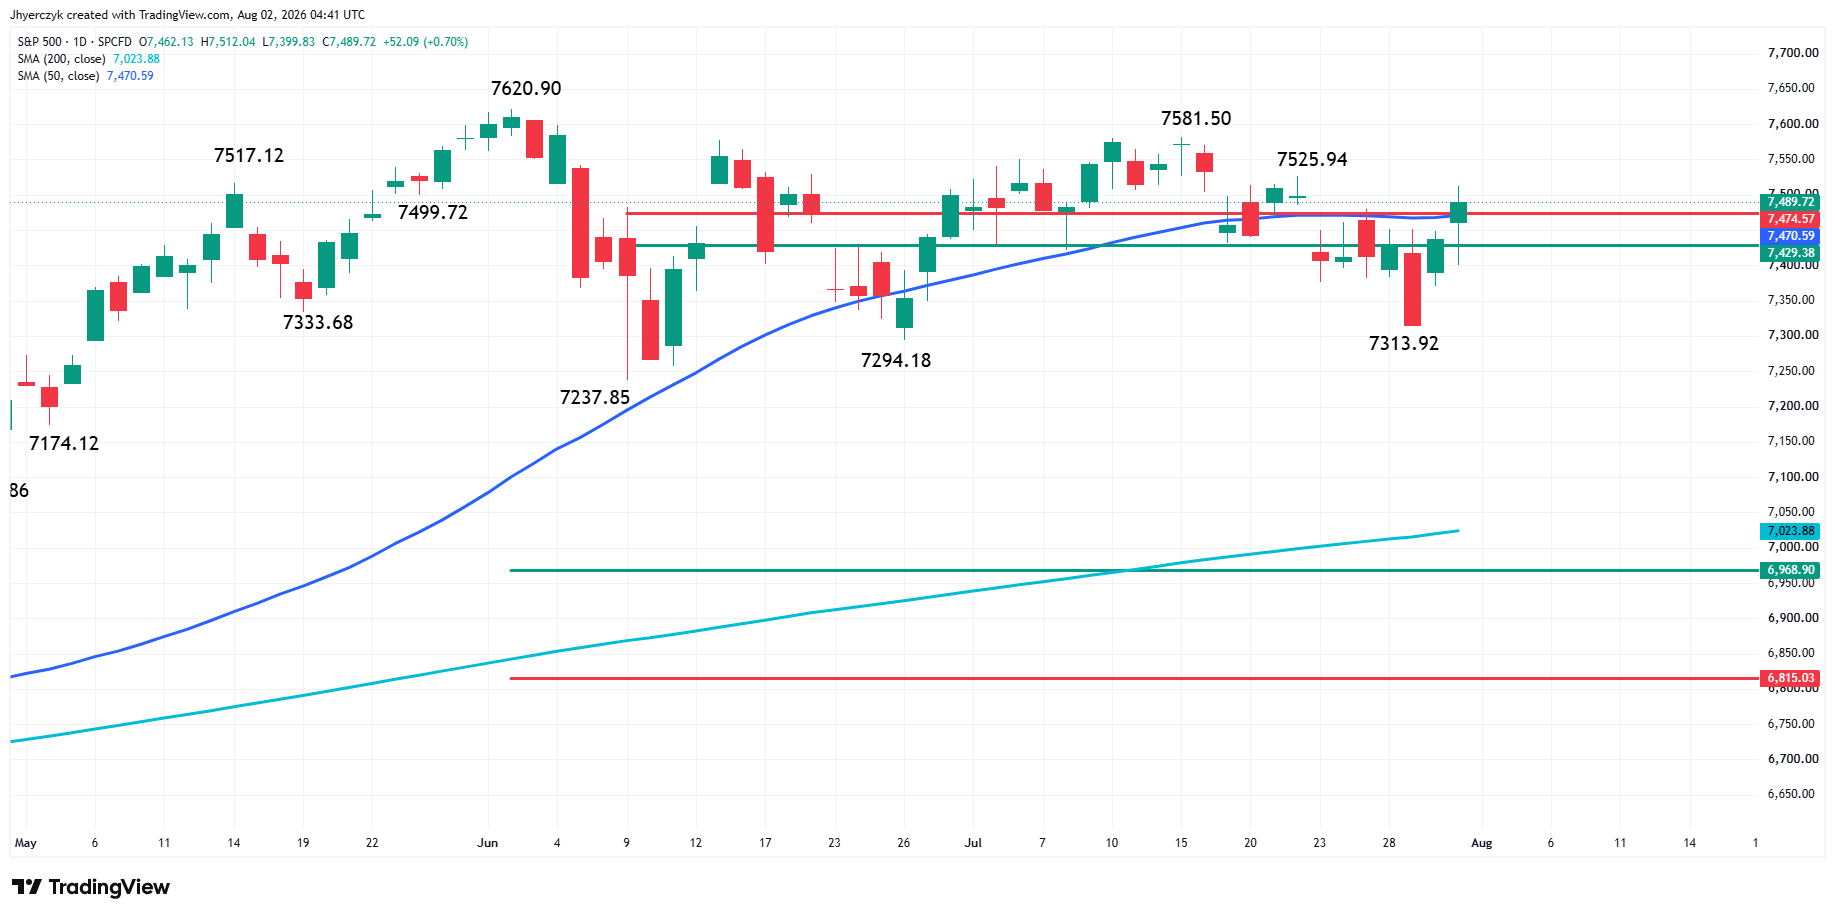
The S&P 500 Index edged higher on Friday in another volatile session. More importantly, however, it closed on the strong side of a short-term retracement zone at 7429.38 to 7474.57 and the 50-day moving average at 7470.59.
The upside momentum created by the move could target the swing top at 7525.94 for a breakout with the swing top at 7581.50 the next potential resistance level. This is the last main top before the record high at 7620.90.
Ideally, we’d like to see a support base form on the strong side of the 50-day MA, but there remains the possibility of the support base being formed inside the short-term retracement zone.
Daily Nasdaq Composite Index (IXIC) Technical Analysis
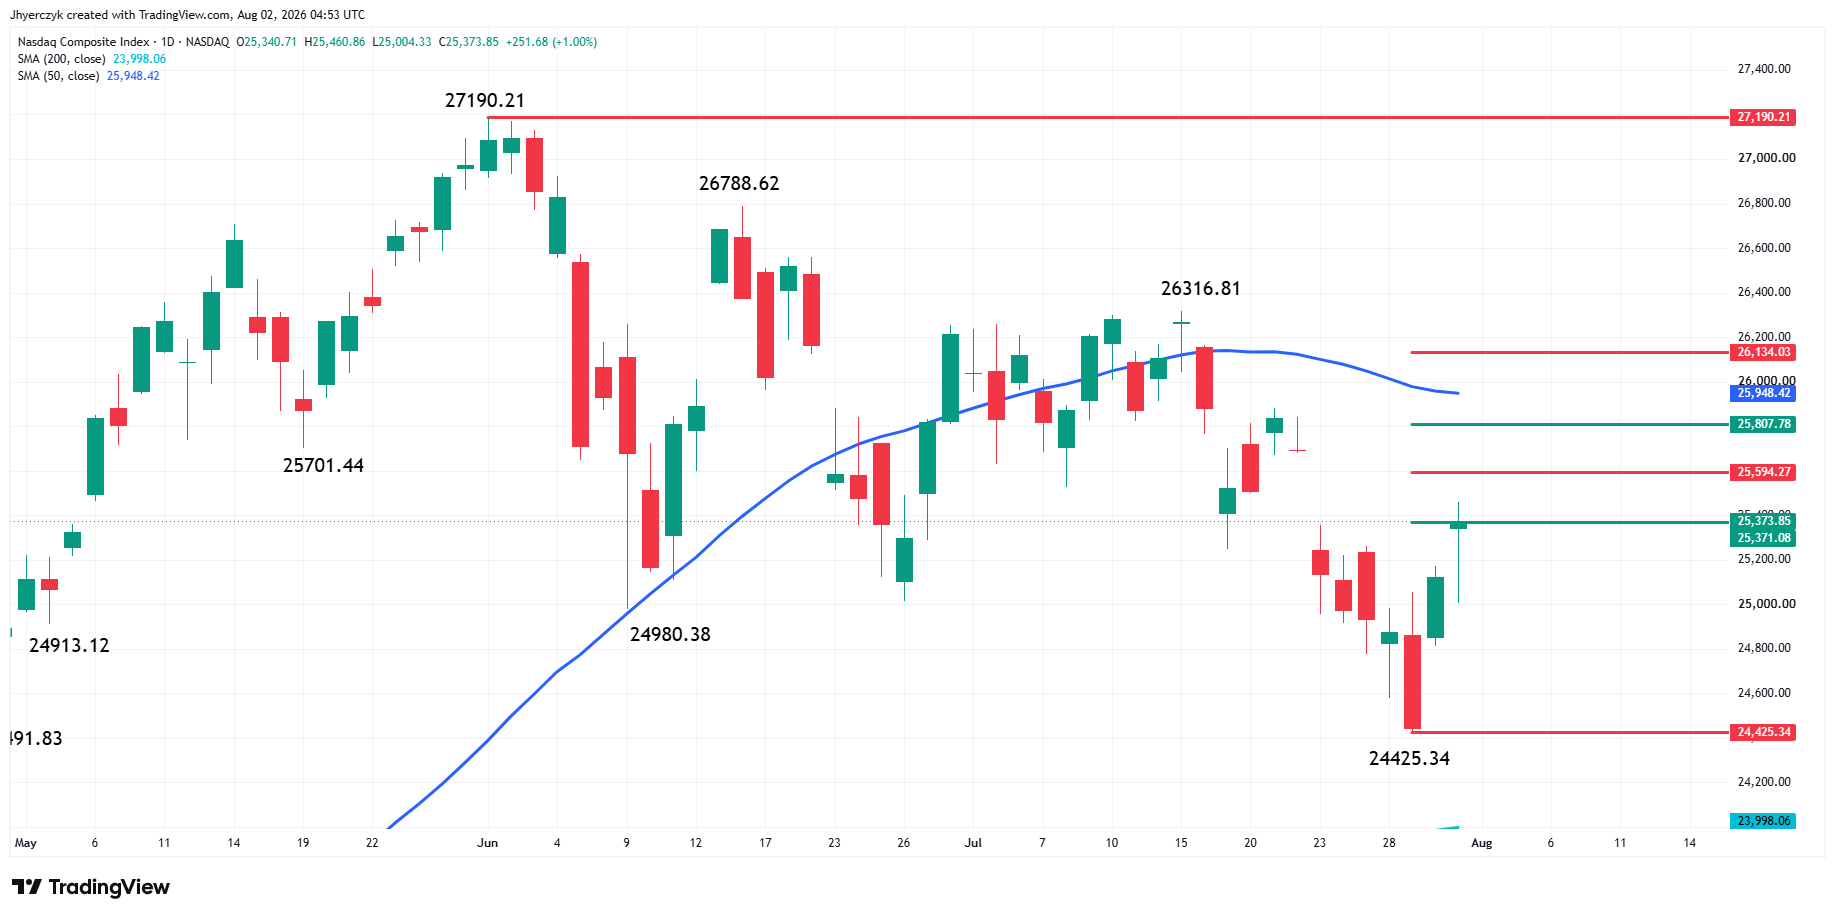
The Nasdaq Composite Index closed sharply higher on Friday, even after running into a short-term retracement zone at 25373.85 to 25594.27. This isn’t the major retracement zone, however, that we are eyeing.
The main range formed by the June 1 main top at 27190.21 and the July 29 main bottom at 24425.35 has created the critical retracement zone at 25807.78 to 26134.03. Inside this zone is the 50-day moving average at 25948.42. This is the area that has to be overcome to get me excited about the upside and a new record high.
The fast two-day rally from 24425.34 to Friday’s high at 25460.86 has left the Nasdaq Composite vulnerable to a possible pullback to at least 24943.10 so be prepared if there is no follow-through rally early next week. Good rallies tend to need support bases. Right now we have a spike bottom so more work may be needed to solidify the support.
Daily Dow Jones Industrial Average (DJI) Technical Analysis
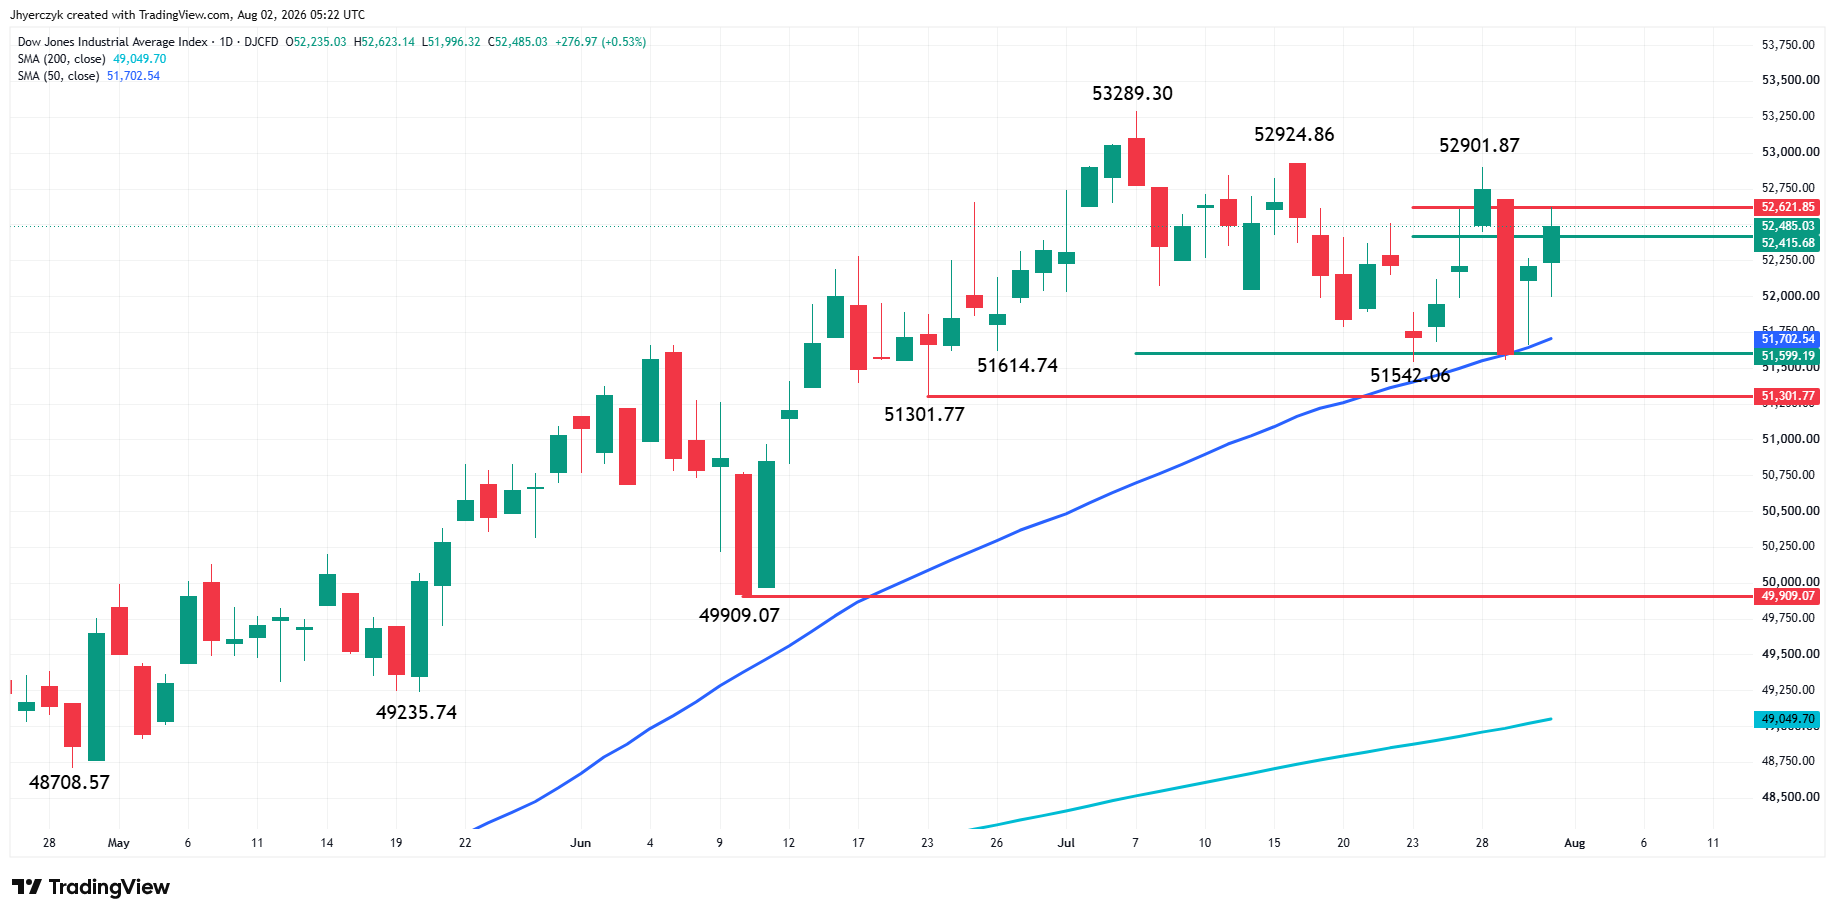
The Dow Jones Industrial Average closed higher on Friday. However, the key event was on Wednesday when a 1000 point sell-off was stopped by the 50-day moving average. It closed on Friday at 51702.54 and is the key support and trend indicator.
The short-term range is 53289.30 to 51542.06. It created a retracement zone at 52415.68 to 52621.85. On Friday, the Dow closed on the strong side of its lower level, but in order to generate the upside momentum needed to overcome the swing tops at 52901.87, 52924.86 and the all-time high at 53289.30, it’s going to have to overcome the upper end of the range.
Amazon and Microsoft Stopped the AI Bleeding
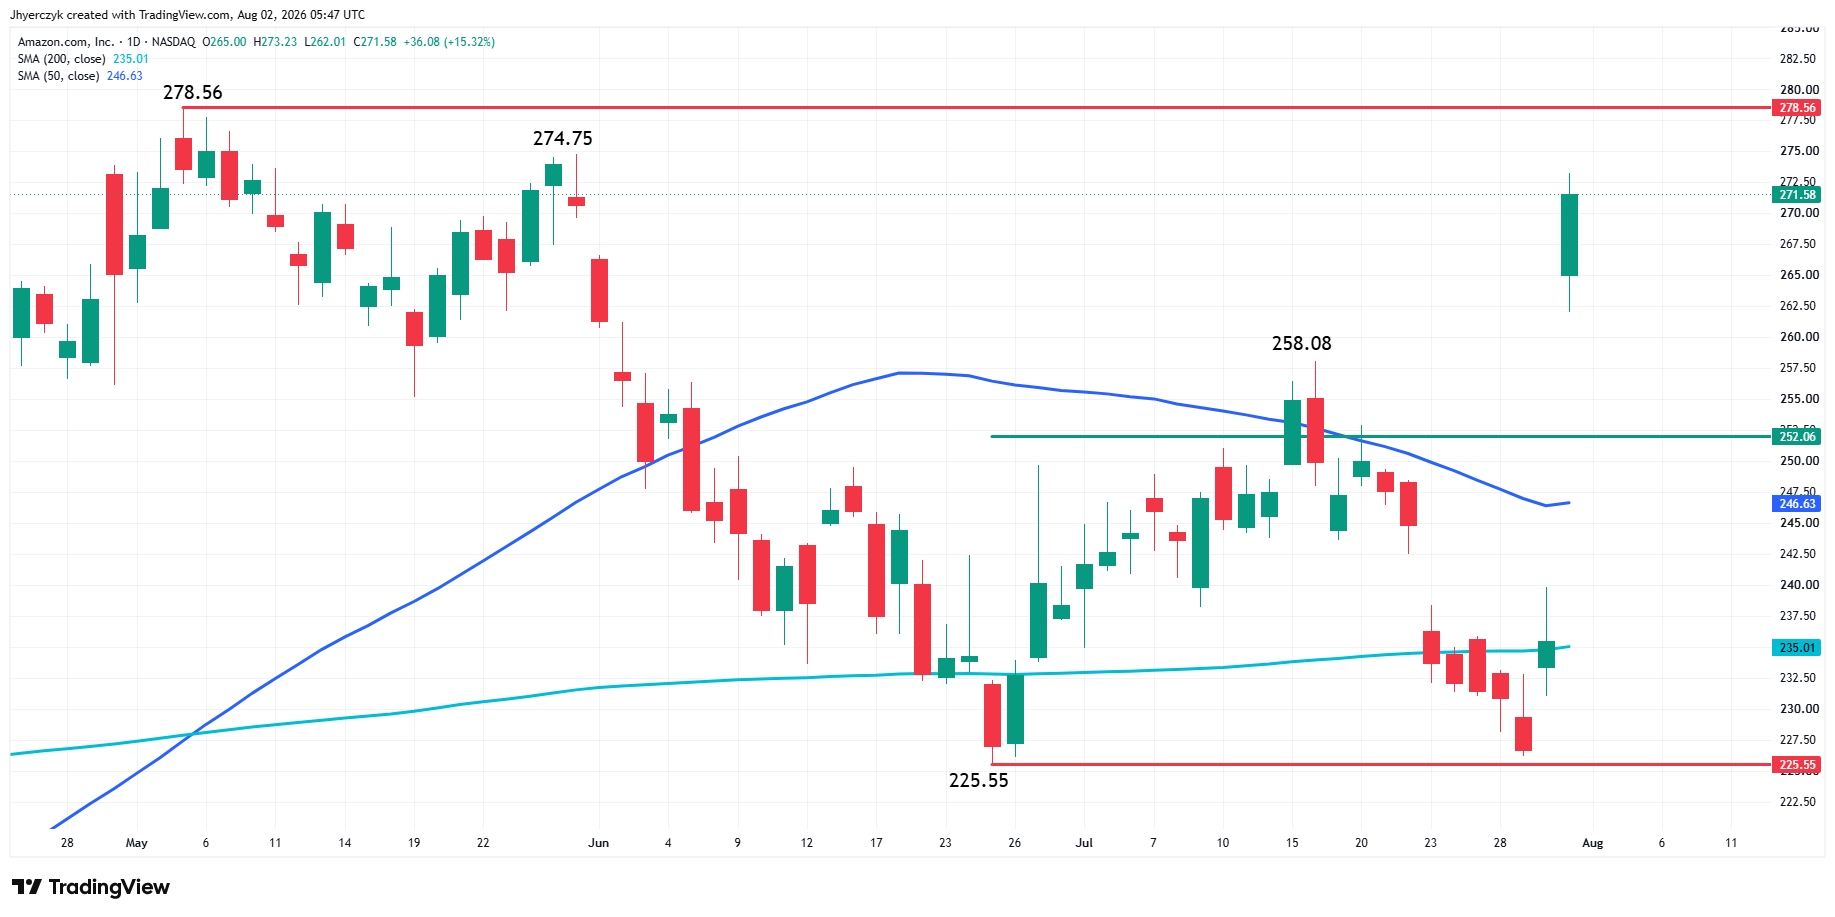
Amazon ripped 15% higher after cloud revenue drove its strongest quarterly growth in more than four years. Microsoft added another 3% Friday on top of Thursday’s 15% gain, the biggest single-day move that stock has made since 2008. Two weeks ago the market was ready to bury the hyperscaler trade. Amazon and Microsoft killed that narrative in back-to-back sessions, and the shorts who had been pressing the supply chain all month paid for it.
The PHLX Semiconductor Index added only 0.07% Friday and sits more than 20% below its June 22 record close. Amazon and Microsoft stopped the selling. They have not rebuilt the chip trend.
Apple Dragged Technology Lower on Its Own
Apple fell 7.4% on supply constraint warnings. iPhone sales were strong. The market sold the guidance and took the entire technology sector down with it. Consumer discretionary jumped 6.07% on Amazon. Communication services gained 4.60%. Technology, materials, health care, utilities, consumer staples and real estate all finished lower.
Stocks in the News
Monolithic Power Systems added more than 8% after forecasting third-quarter revenue above estimates. GoDaddy dropped nearly 17% after narrowing its annual revenue forecast.
What to Watch
Amazon and Microsoft proved the AI spending story is producing revenue, but the chip group needs to follow through on its own before the July break gets called finished. The PHLX index is still 20% below its record and two days of buying after a month of selling is not a recovery. The broader market needs participation. Most S&P 500 stocks finished lower Friday even as the index closed higher.
The S&P 500 closed above its 50-day moving average and needs to build a base there rather than fall back into the retracement zone. The Nasdaq rallied hard off the lows but the spike bottom leaves it vulnerable to a pullback early next week if there is no follow-through. The three Fed officials who dissented Wednesday called Friday for immediate action to return inflation to 2%. The two-year yield rose 5.4 basis points to 4.28% and FedWatch has September hike odds at 65%. The earnings are doing the work. The bond market is still fighting them.
More Information in our Economic Calendar.