
Oil News: Hormuz Traffic Slumps as U.S. Gas Storage Builds
August 21st oil fundamentals focus on the U.S.-Iran conflict and the reduction in shipping through the Strait of Hormuz. According to Kpler data, only seven ships transported goods through the strait on Thursday (down from 14 a day prior), and no very large crude carriers or LNG ships were counted. Before the war, Hormuz was responsible for around 20% of the world’s crude and LNG trade, meaning that the absence of trade is the primary bull market for both U.S. crude and Brent-based international trade.
Saudi Arabia has partially restarted loading in the Gulf, with three VLCCs loading crude at Juaymah and Ras Tanura from August 12 to 16, but exports are still impacted by disruptions in the Houthi conflict in the Red Sea. Alternative flows through Egypt’s Sidi Kerir are running at only about 670,000 barrels per day in August, down from around 4 million bpd processed through Yanbu.
There are also bullish fundamentals in the U.S., but in the opposite direction, as inventories are building. The EIA reported an unexpected 4.4 million barrel crude build in the latest week, while distillate inventories ended a downward trend at 97.2% refinery utilization in response to tight global supplies.
Natural gas fundamentals are more comfortable domestically as well. The EIA’s August 20 report showed working gas in storage at 3,169 Bcf after a 16 Bcf weekly inventory injection. Inventories are 185 Bcf, or 6.2%, above the five-year average and in comfortable range, despite high LNG exports.
The backdrop for August 21 is the same as before: the potential for disruptions from the Hormuz and Red Sea Straits keeps global oil and LNG supply disrupted, while increased U.S. crude oil and natural gas in storage mitigates the risk of a shortage at home.
For now, Persian gulf security is totally in the hands of the U.S. and its allies. A pessimistic Hormuz scenario would see Iran closing the straits of Hormuz.

Natural Gas Technical Analysis: NG Consolidates Near $2.75 as Rising Trendline Supports Price
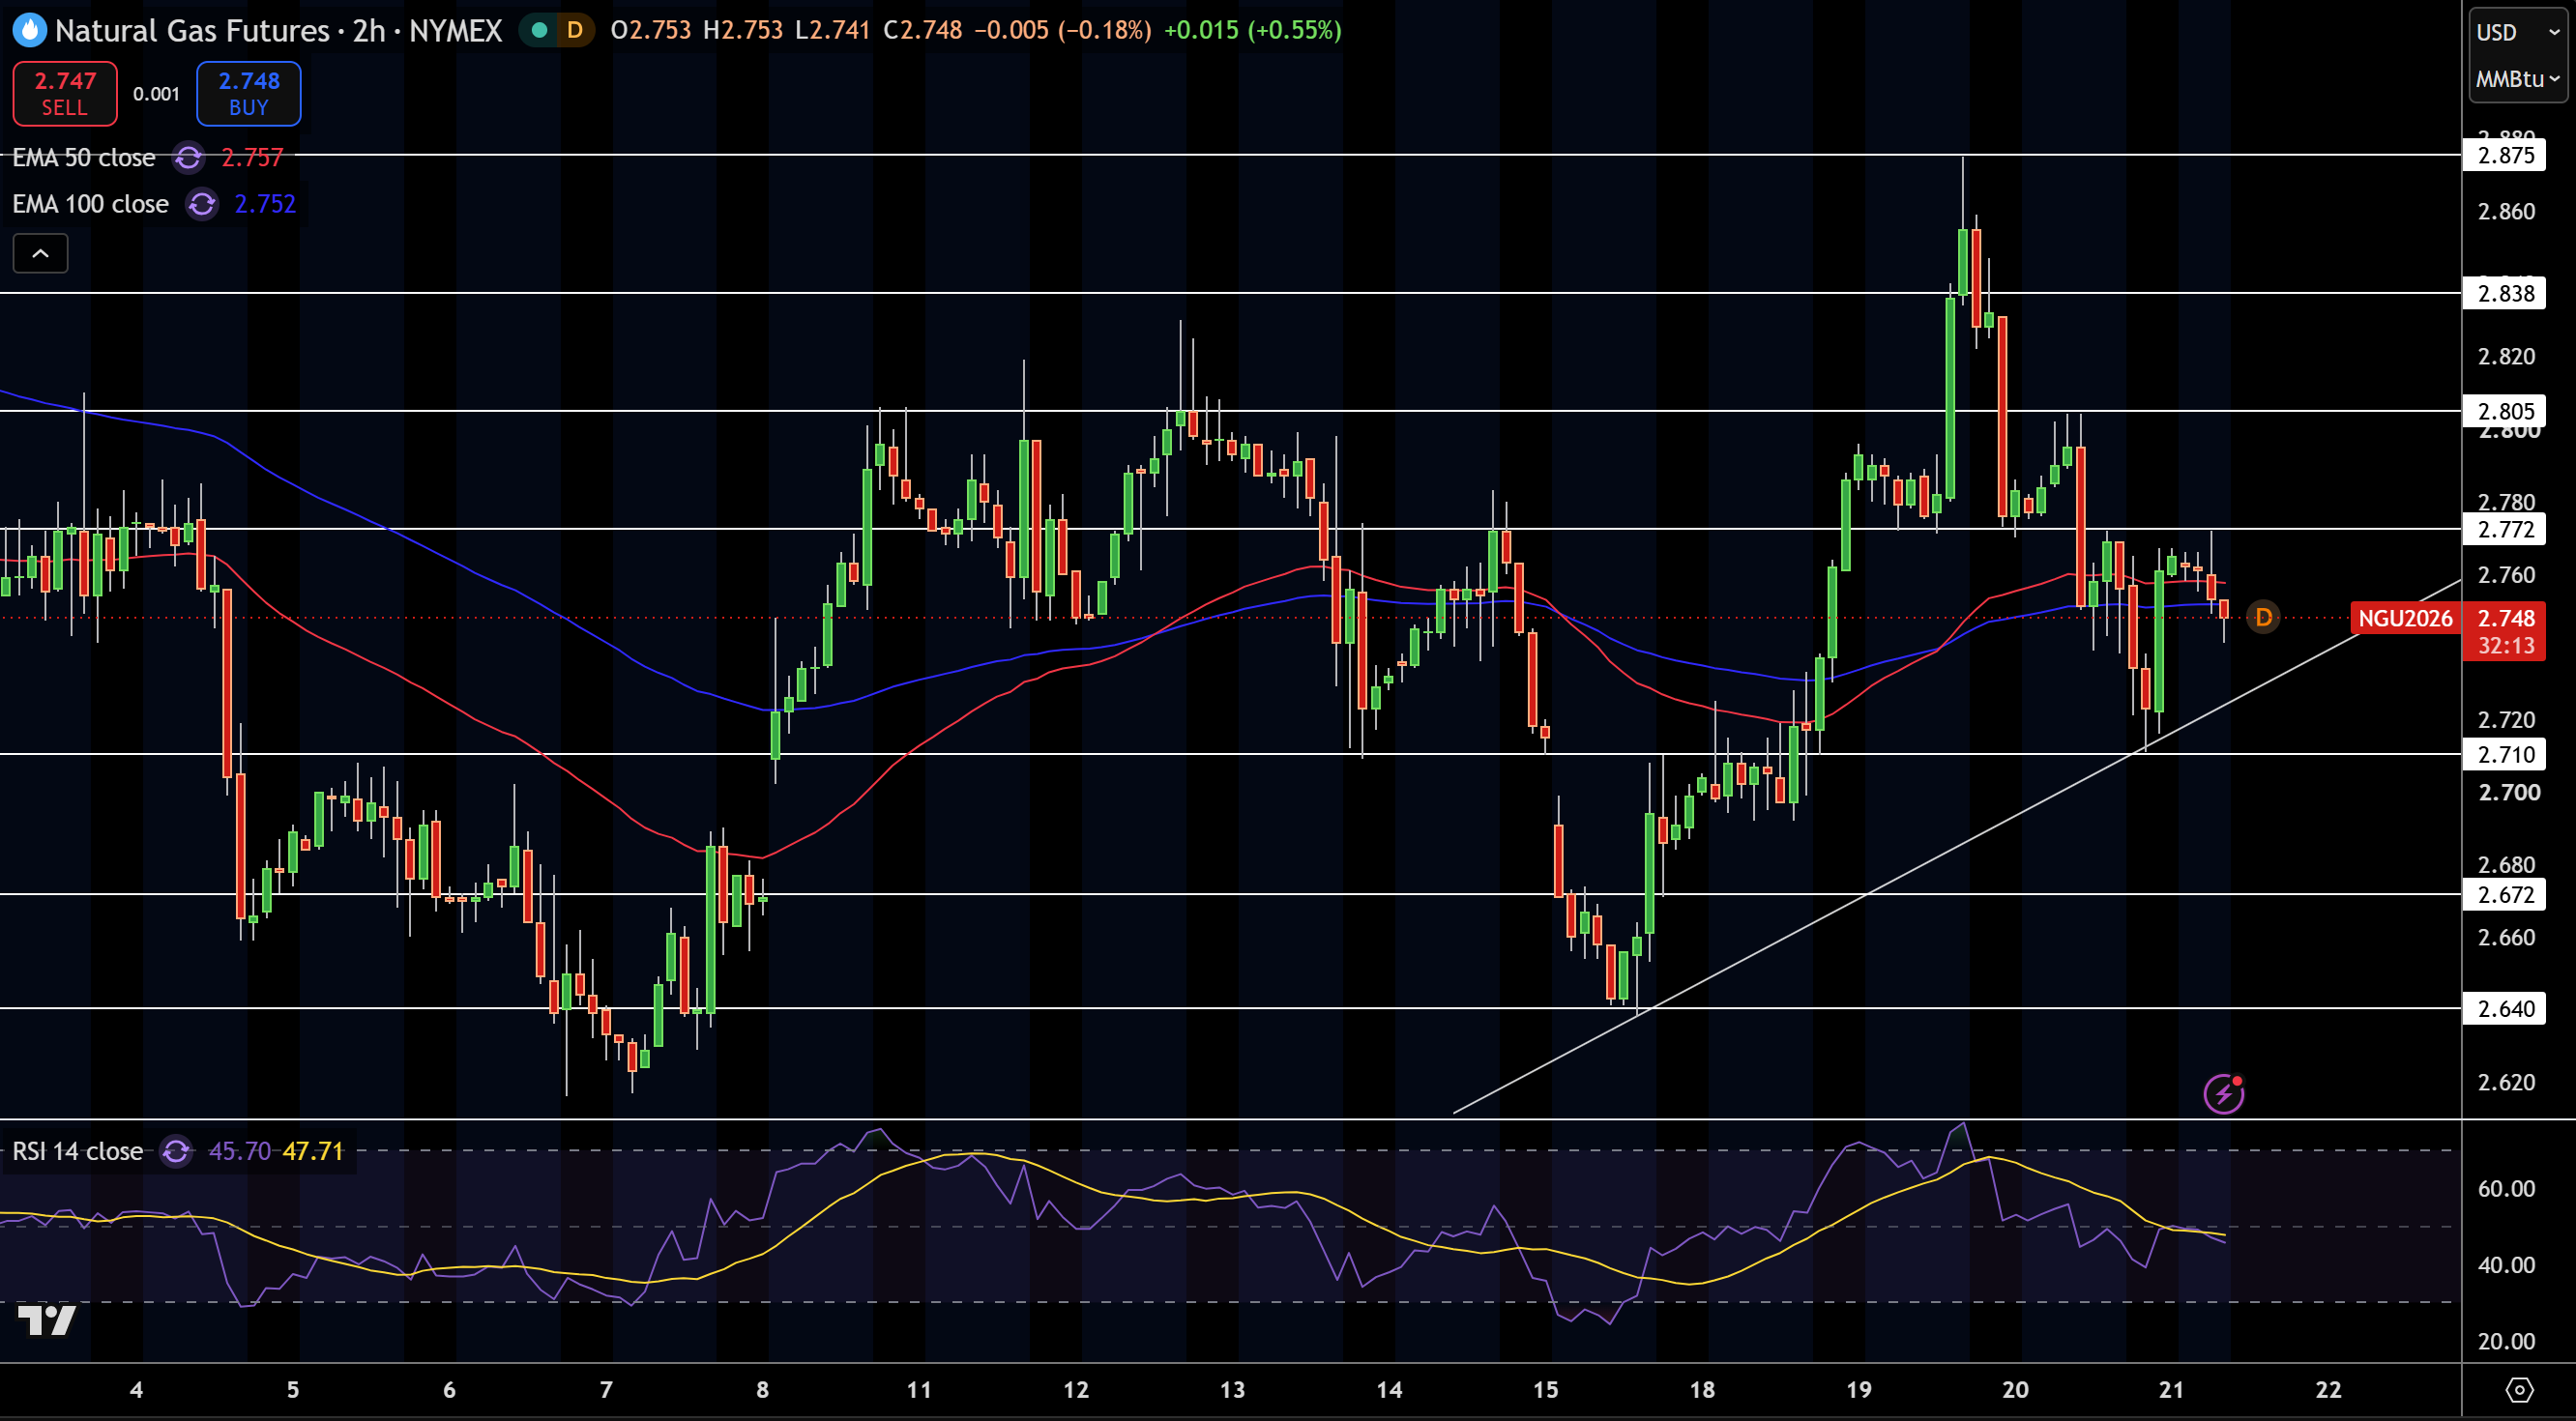
Natural gas price is consolidating at $2.75 on the 2-hour chart right above the 50-EMA at $2.76 and the 100-EMA at $2.75. Price still has support from an ascending trendline that started back at the lows at mid-August, but the recent price action at $2.84-$2.86 has price acting range bound as buyers are failing to keep the breakout going. Price range is between the support trendline and the moving average cluster.
RSI is at 46, reflecting neutral-to-slightly bullish momentum. The first resistance is around $2.77, then $2.81, $2.84, and $2.88. In the event of possible price falls, support comes in at $2.71, at $2.67, and at $2.64.
In my opinion, direction for natural gas is neutral in the territory between the rising trendline and $2.81. A break above $2.81 would bring $2.84-$2.88 into focus, while $2.71 breaking would increase the focus on a larger pullback to $2.67.
Natural Gas Price Forecast
Every new Natural Gas analysis as it publishes, today's technical signal and key levels, live price — on one page.
See all Natural Gas forecastsWTI Crude Oil Technical Analysis: WTI Holds Rising Channel as $87.24 Caps Near-Term Upside
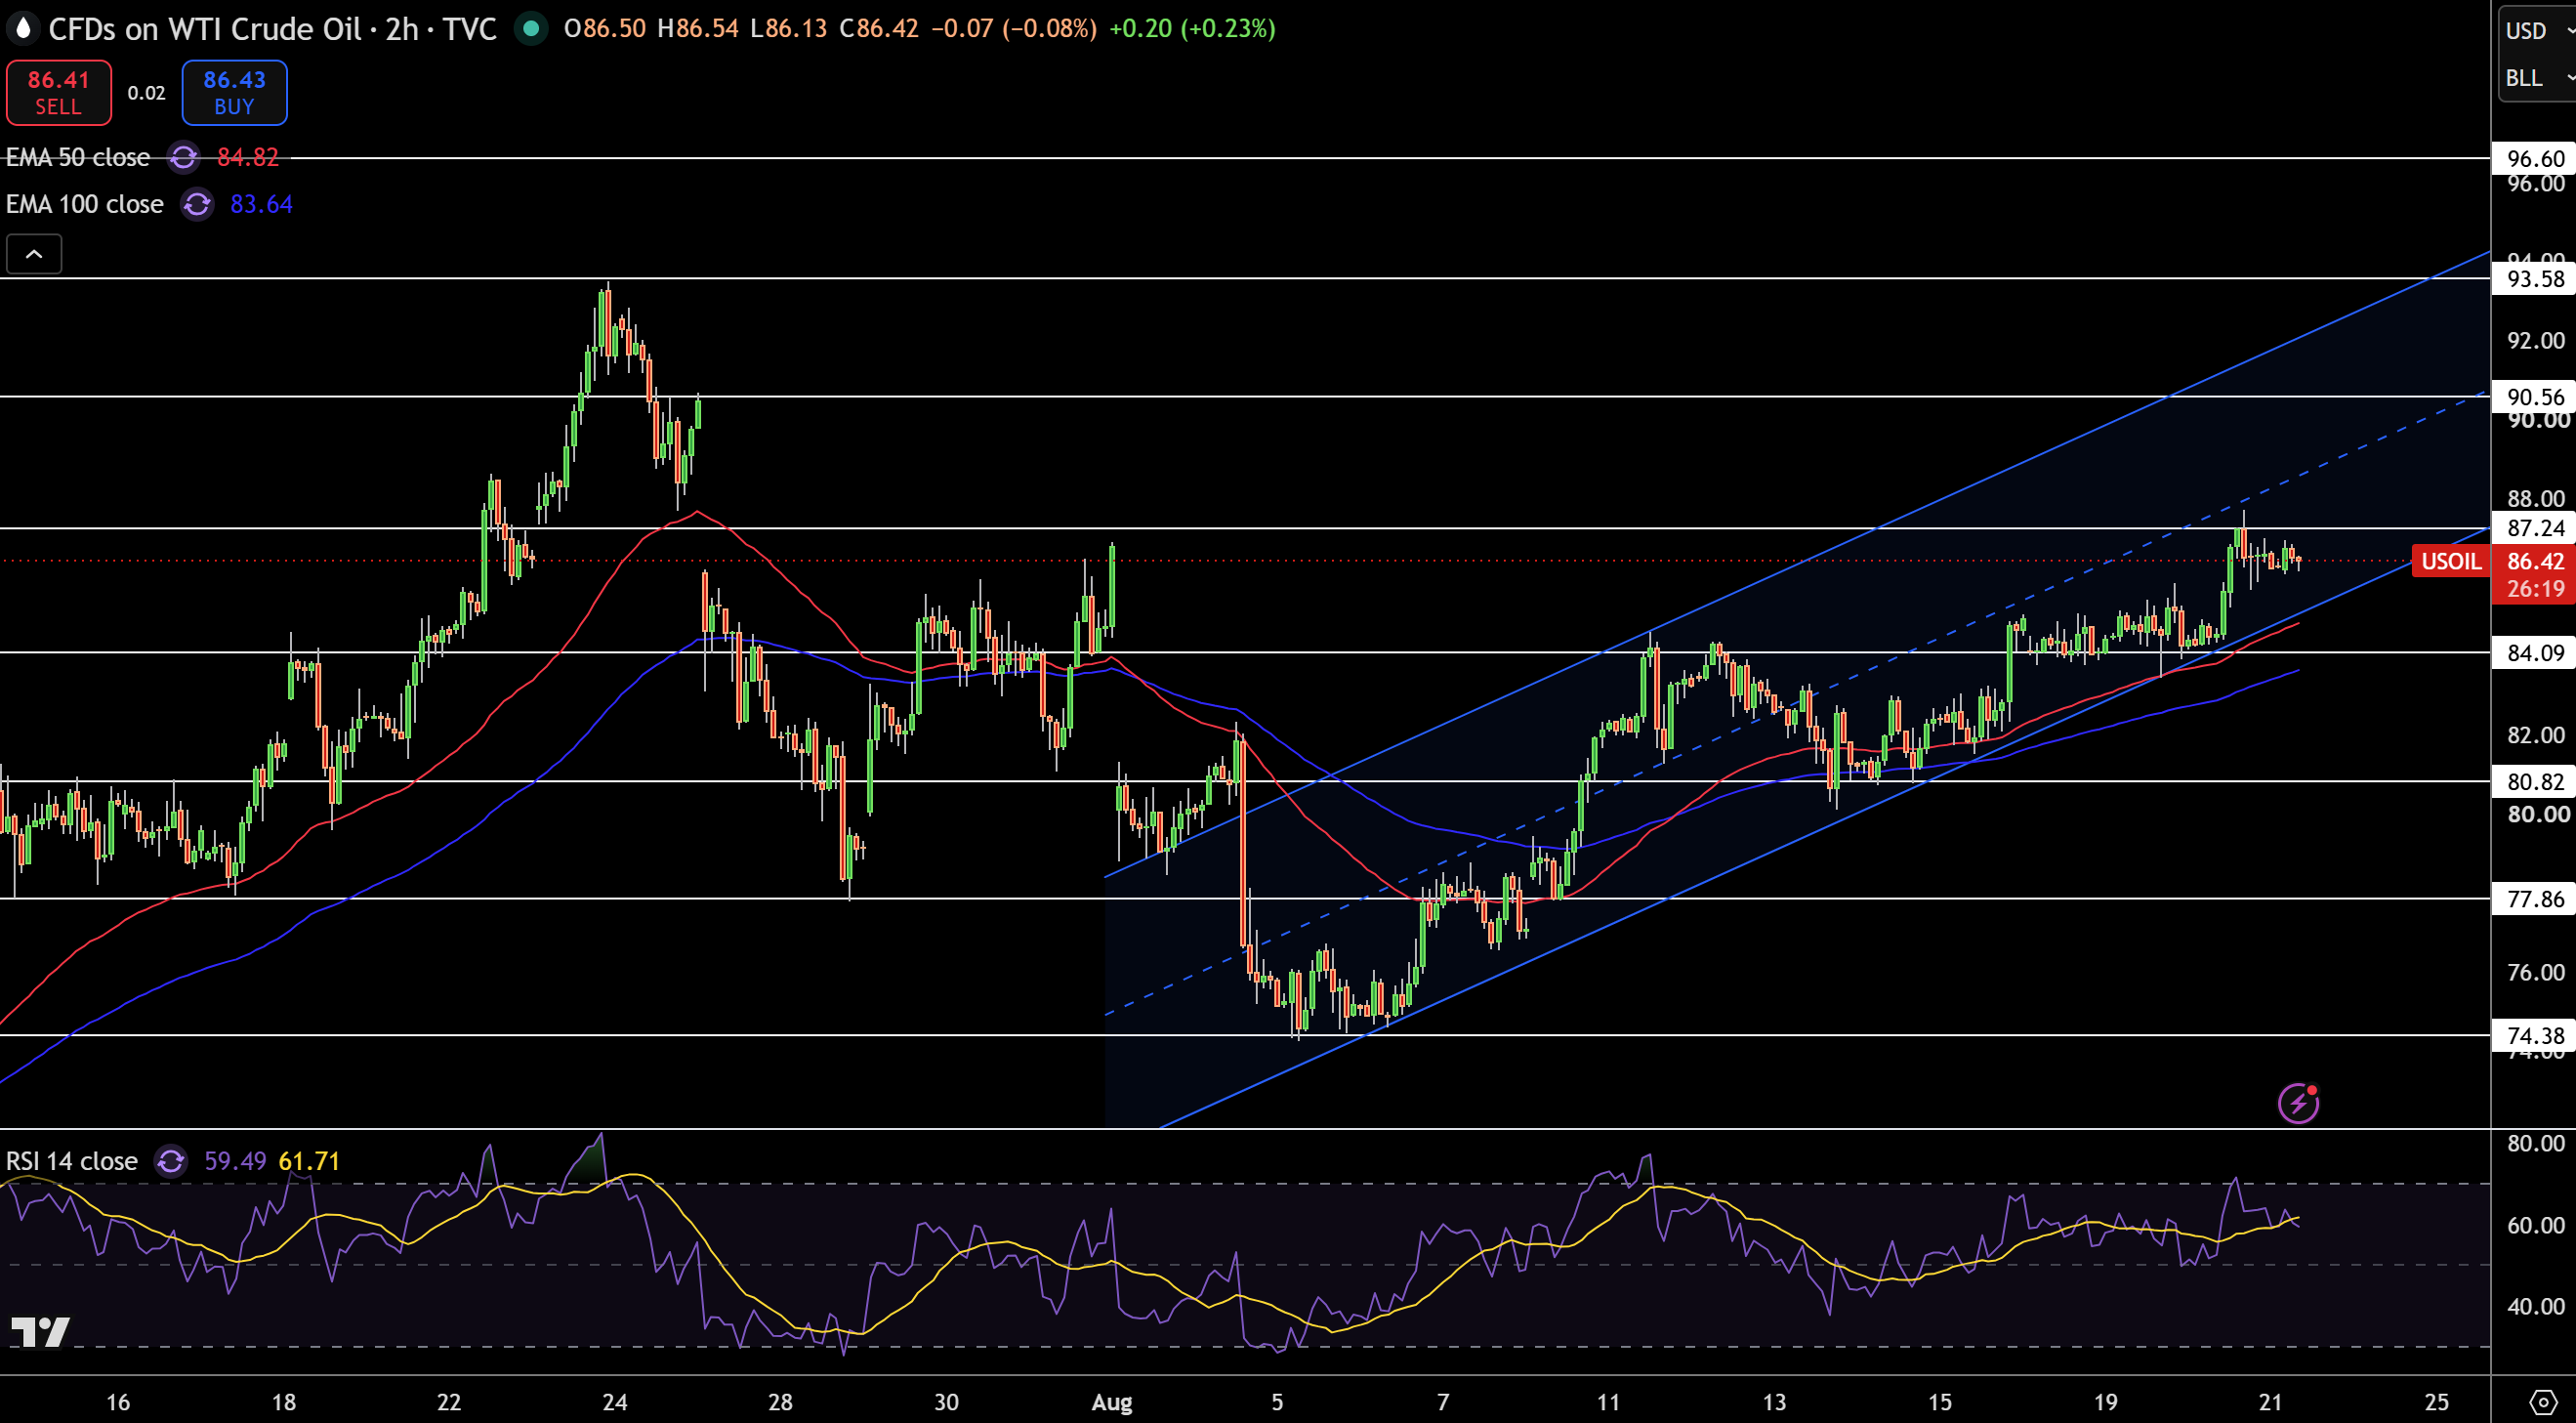
WTI crude oil trades around $86.42 and the 2-hour chart shows the rapid price action is above the 50-period EMA at $84.82 and the 100-period EMA $83.64, and is capped in the rising channel above the recent consolidation breakout around $87.24. Buyers are in control, but have run out of bullish momentum. Price action remains above the rising channel midline and supports the bullish trend.
The RSI at 59 suggests bullish momentum, but is not in overbought territory. Immediate resistance is around $87.24 and $90.56 and $93.58 beyond. Support is around $84.09 followed by $80.82 and $77.86.
WTI is bullish above $84.09 and the lower range of the rising channel. A break of $87.24 will target $90.56, but a break of $83.64 will target a bearish trend.
Brent Crude Oil Technical Analysis: Brent Presses $94.78 Resistance as Buyers Stay in Control
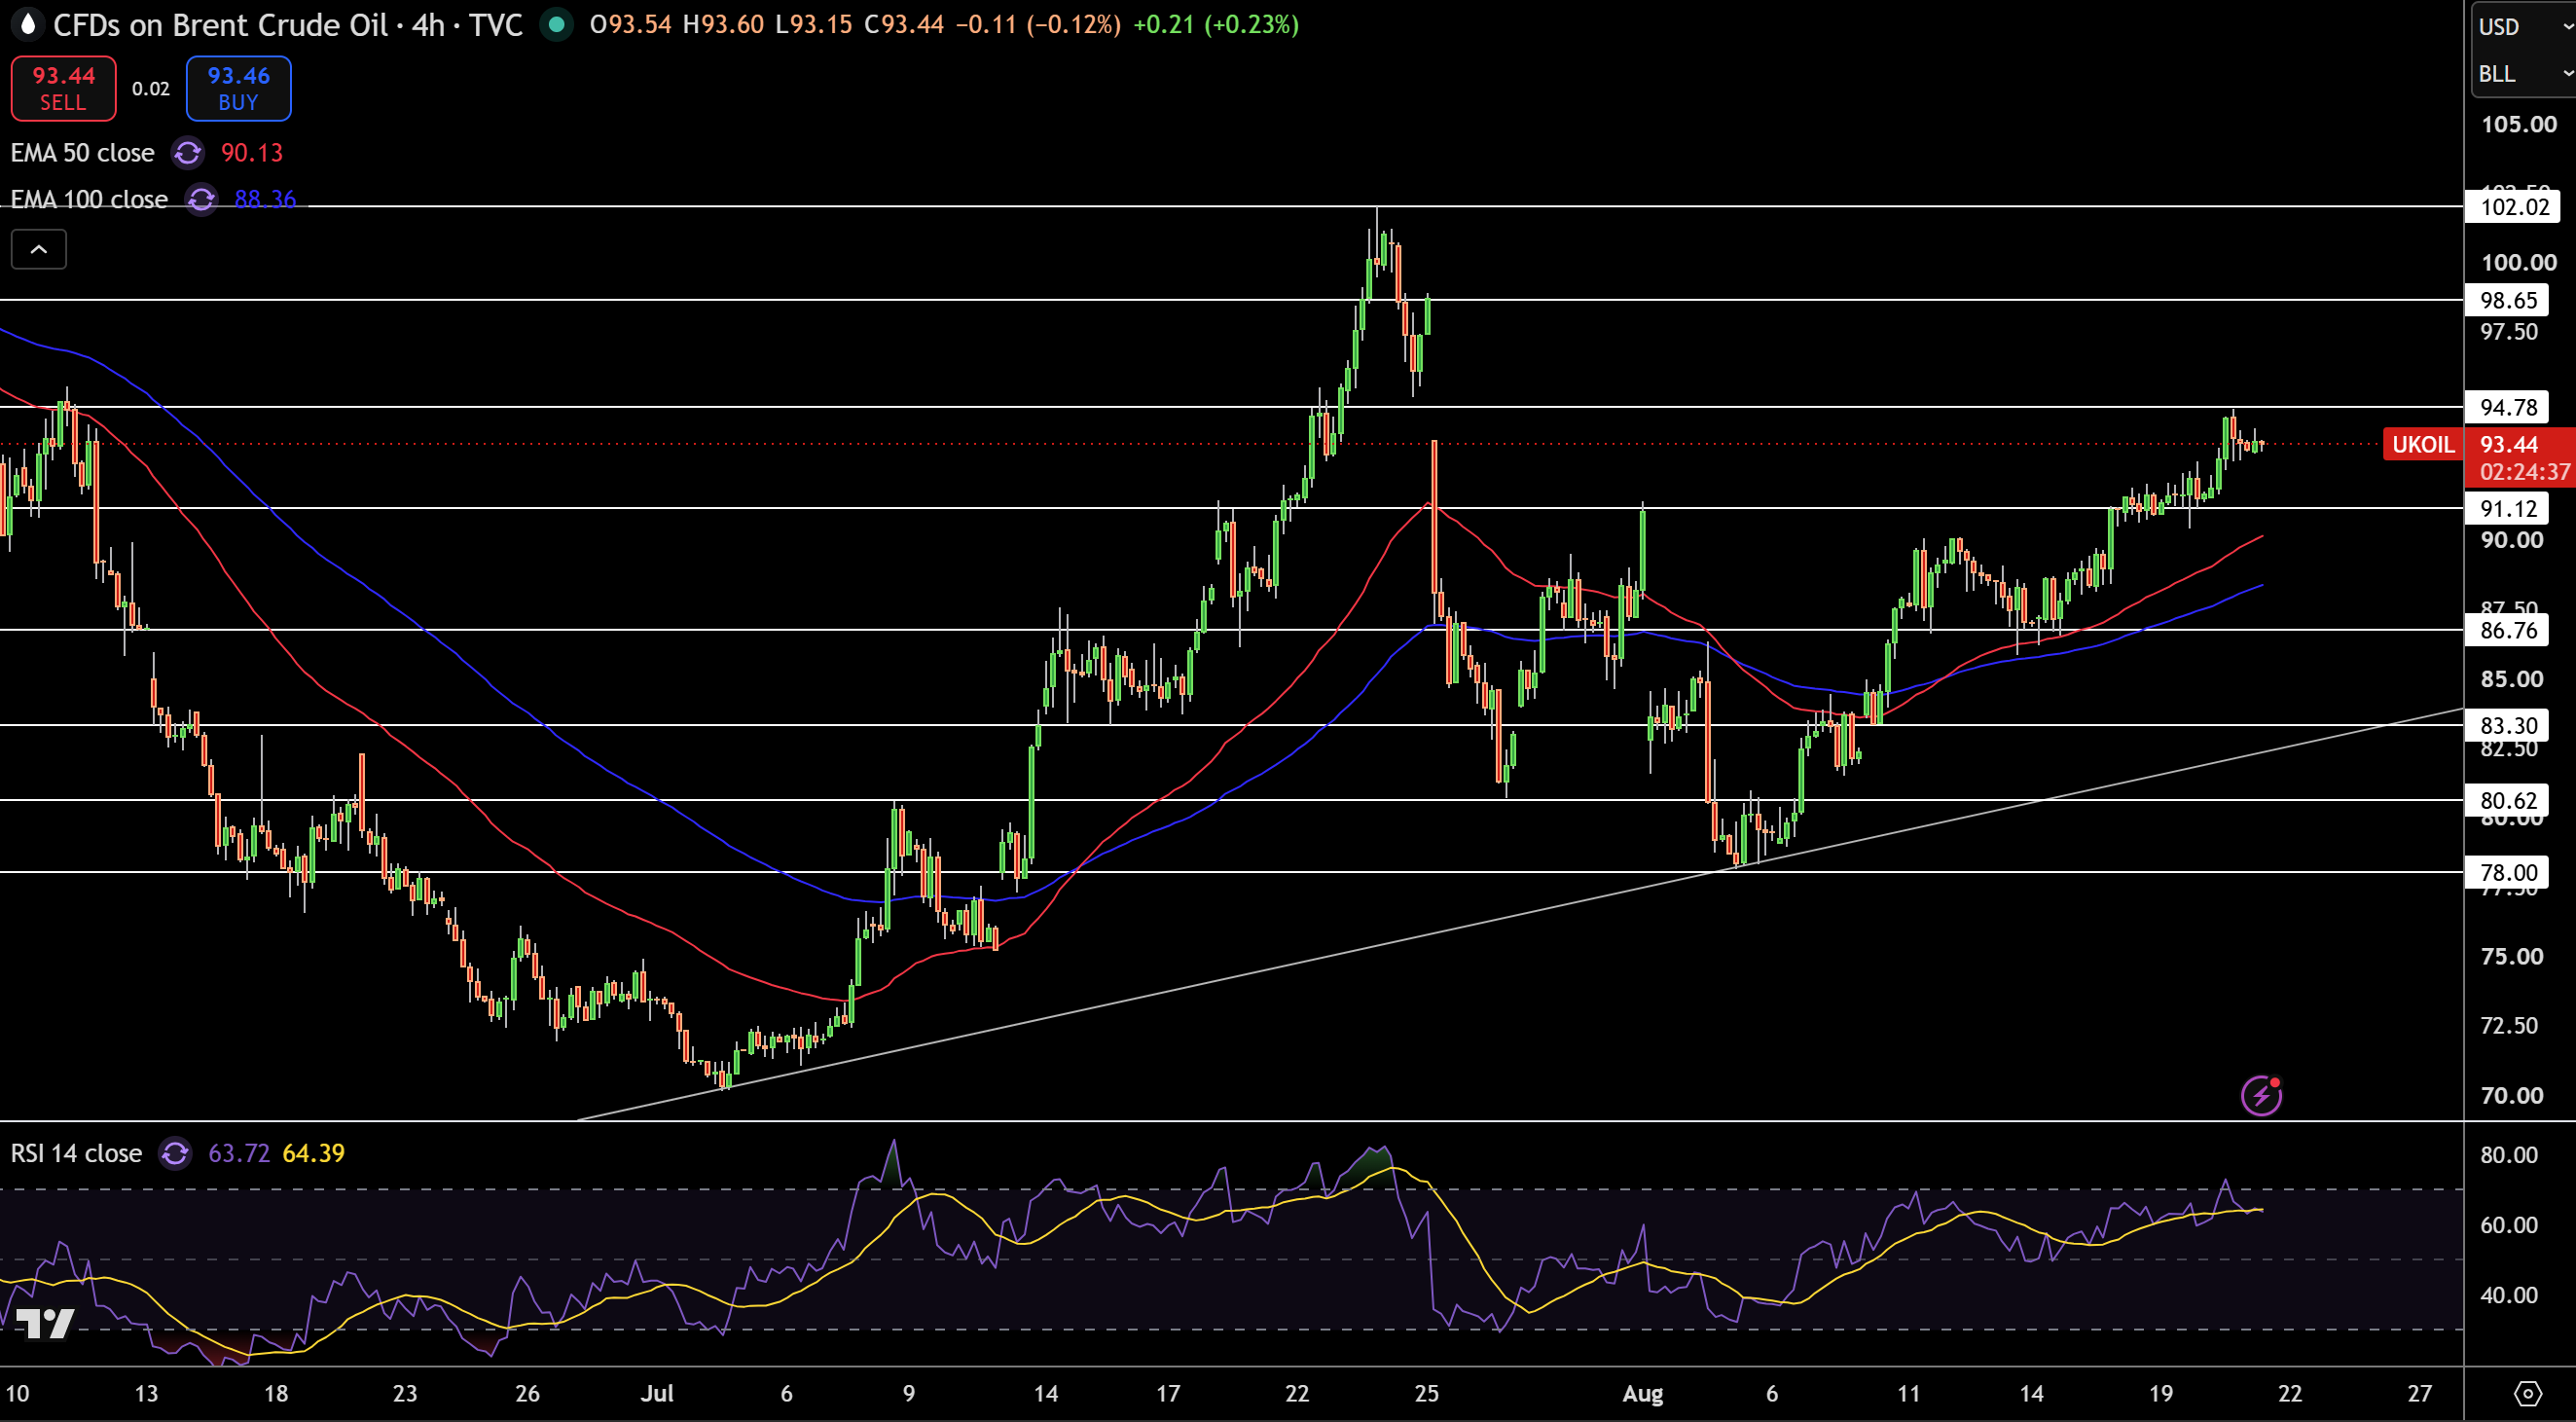
Brent Crude is trading around $93.44 after a significant price recovery from the $78 zone. Short term price action remains bullish as Brent has a rapid price action consolidation below the resistance of $94.78. Price continues to remain above the 50-period and 100-period EMAs.
The RSI is at 64, showing the pressure is strong but is not yet at overbought levels. The first resistance is $94.78, followed by $98.65 and $102.02. The first support is $91.12. Below that, supports are $86.76 and $83.30.
I see Brent as bullish while above $91.12. Breaking and holding above $94.78, makes $98.65 a likely target, while breaking the EMA cluster will signal a loss of momentum to the recovery.