



Oil News: Gulf Escalation Revives Supply Risk as LNG Disruptions Deepen
As military escalation between the U.S. and Iran continues for the second week, oil markets are signaling an increase in bullish sentiment, and supply from the Gulf of Mexico may be at more risk than it was previously. U.S. military strikes on Iranian missile launch sites on Larak Island re-ignited strikes across the Strait of Hormuz as Iran struck U.S. military bases in Jordan. President Trump claimed that Iran attacked their only large crude export terminal on Kharg Island. Reuters was unable to factually verify that report. Because of the renewed conflict, traffic through the Strait of Hormuz has declines and presents a serious risk to a historically busy trade route.
Although physical supplies are contracting, government reports out of the U.S. leave the impression that supplies remain adequate. However, Kpler estimates that the Asian crude imports in August were at 23.12 million barrels per day, a 14% decline from pre-war levels, and that crude exports through the Hormuz strait averaged 2.3 million barrels per day, a decline of 44% from July levels. Meanwhile, shipments of middle distillates to Africa from Indian refiners, and others, increased by 49% over August levels and reached a 4½ year high, showing that the war is disrupting supplies of middle distillates as well.
The situation in natural gas is more stable in the U.S. The EIA expects dry gas of 111.2 Bcf/d in 2026. In addition, exports of LNG are expected to reach 17.4 Bcf/d, and stockpiles are available to fill record storage of 3.985 Tcf by the end of October.
The rest of the world shows more pressure on LNG. QatarEnergy has extended the force majeure on LNG contracted to Edison SpA of Italy to early November, also cancelling another five LNG cargoes.
European buyers are filling the void caused by loss of business with alternative suppliers, including the U.S.
As of August 31, the global energy situation is clear. Tension in the Gulf region has increased the demand for crude oil, diesel and LNG from across the globe. Meanwhile, continued record production of natural gas in the U.S. has helped ease the energy burden at home.

Natural Gas Technical Analysis: NG Falls Back Below $2.87 as Breakout Support Comes Under Pressure
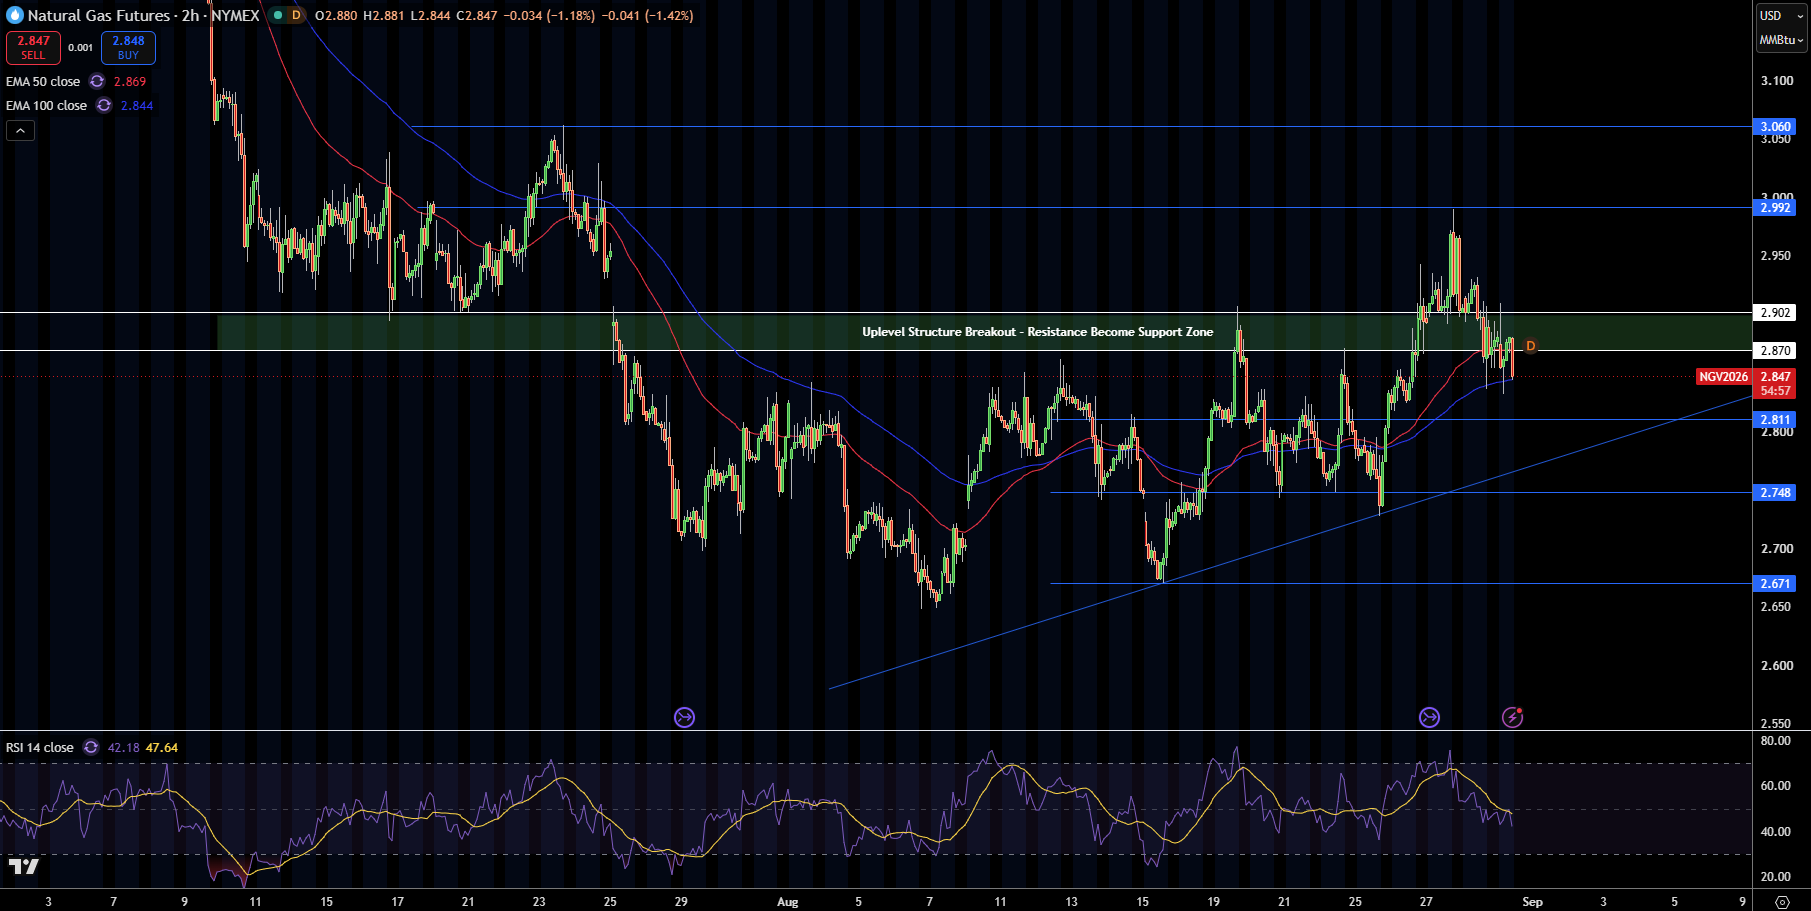
Natural gas is currently trading at about $2.85 on the 2-hour chart from where it pulled back from a spike to the $2.99 region. Price fell below the $2.87-$2.90 breakout zone, which further discourages bullish continuation. NG is currently trading below the 50-EMA at $2.87, with the 100-EMA at $2.84 providing immediate support.
RSI is currently at 42, indicating trading momentum has slowed from the recent trading run. Resistance is expected at $2.87-$2.90, then $2.99 and $3.06. Support is expected at $2.81 then $2.75 and $2.67.
Based on this analysis, I believe that the breakdown of the natural gas trading zone below breakout support of $2.90 has begun, with trading expected to fall toward the support of $2.81. A break above $2.90 would indicate the continuation of the trading bull zone.
Natural Gas Price Forecast
Every new Natural Gas analysis as it publishes, today's technical signal and key levels, live price — on one page.
See all Natural Gas forecastsWTI Crude Oil Technical Analysis: WTI Tests Descending Trendline Near $85.73 as Bulls Push Higher
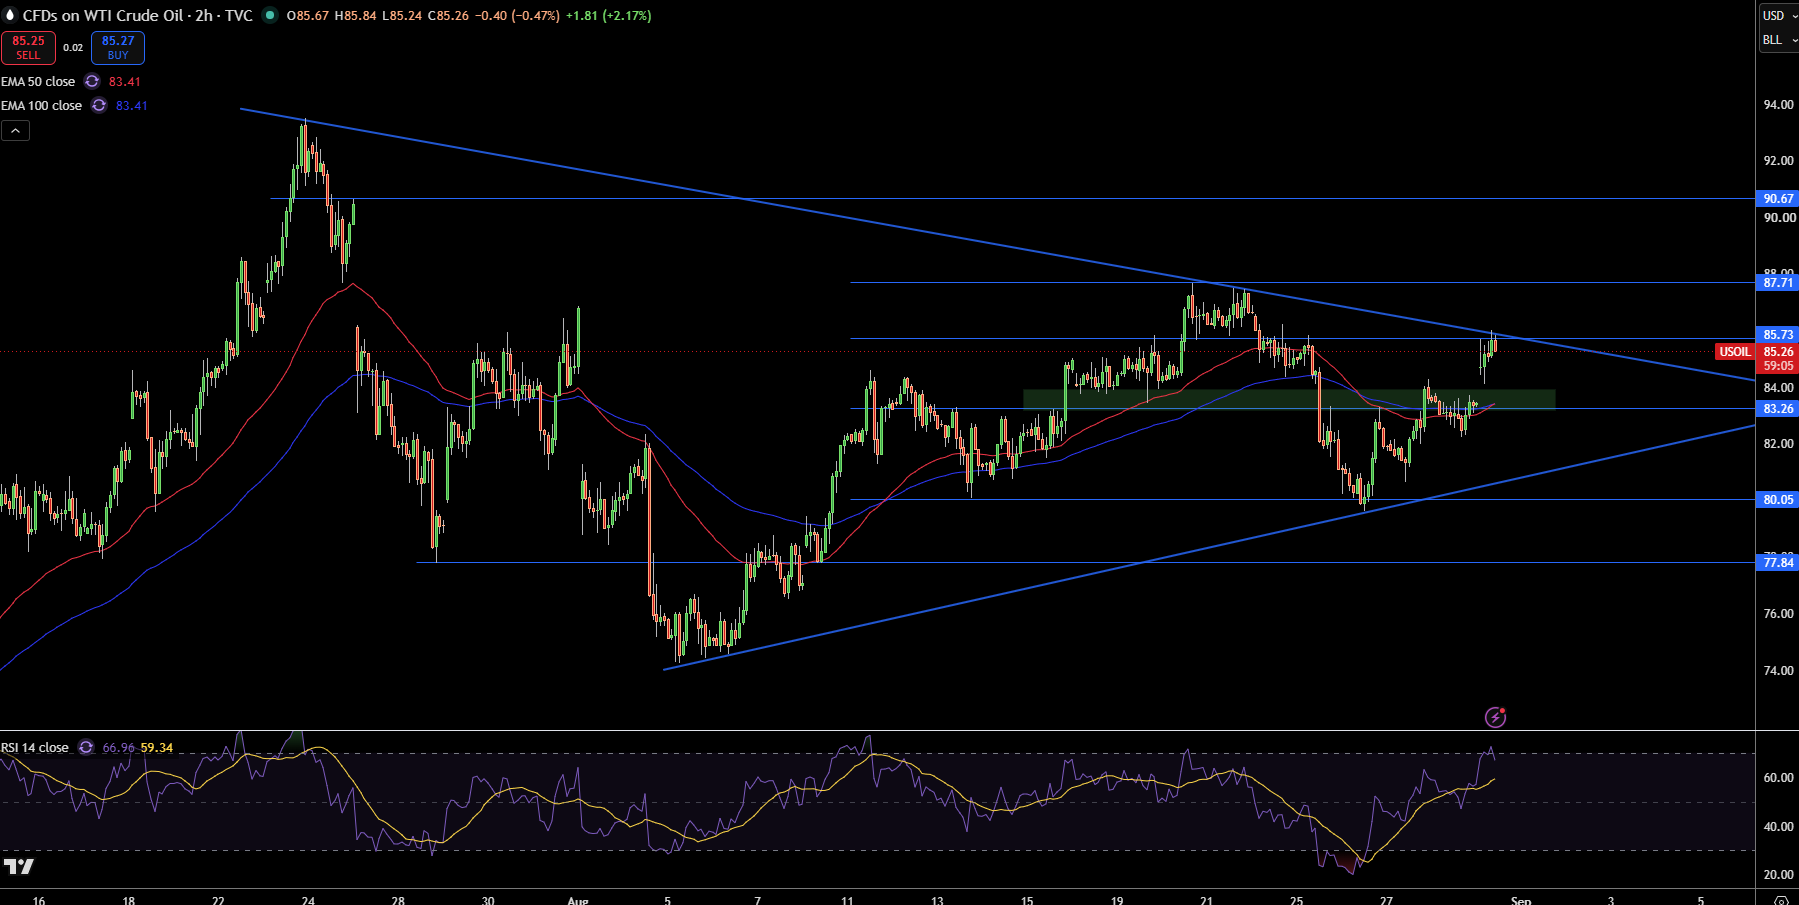
WTI crude oil is currently trading at approximately $85.28 after rebounding from a support level at $80.05. WTI crude oil also appears to be testing a descending trendline at the intersection of the $85.73 resistance level. The area is a critical breakout test level. WTI is also trading above the 50-EMA and 100-EMA at $83.42 and $83.41 respectively, strengthening the short-term bullish outlook.
The Relative Strength Index (RSI) is currently at 67, indicating strong momentum, and approaching the overbought level. The first bullish target is at $85.73, and beyond that at $87.71 and $90.67. The first support level is at $83.26, and beyond that at $80.05 and $77.84.
In my opinion, WTI is trading at a critical breakout level. A break and close above $85.73 would add strength to the bullish outlook and target $87.71. A rejection of the breakout would target $83.26.
Brent Crude Oil Technical Analysis: Brent Holds Above $89.19 as Rising Structure Targets $91.90
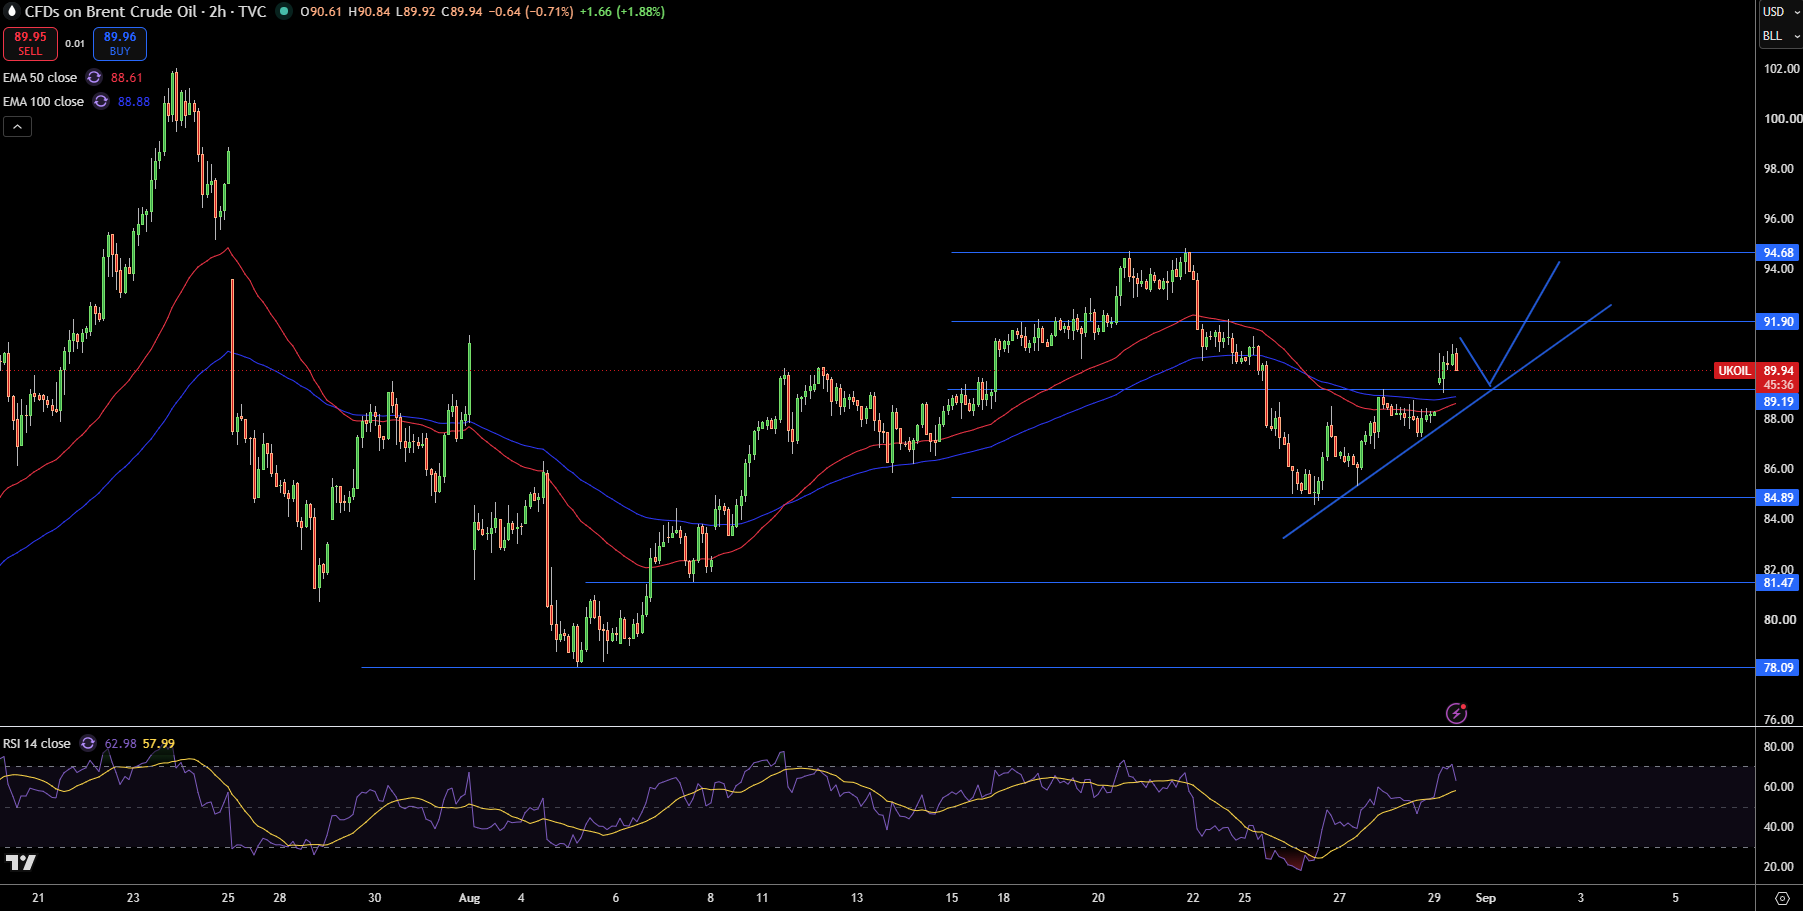
Brent crude oil has also rebounded strongly from a support at $84.89 and is trading at $89.94. Brent crude has also bullishly crossed the 50-EMA at $88.61 and the 100-EMA at $88.88. The resistance target for the current ascending structure is at $91.90.
RSI at 63 indicates increasing buying activity although not at overbought levels. Current price support stands at $89.19, then $88.61 – $88.88, and $84.89. Resistance levels are at $91.90 and $94.68.
Brent looks good above $89.19. If prices hold above $91.90, then $94.68 is the next price target. Prices falling below $89.19 erodes momentum with the possibility of testing the EMA cluster.


