
Ethereum’s Rally Peaks After Five Waves: Larger Correction Begins
Since our July 1 update and subsequent August–September updates, we have tracked a potential five-wave impulsive advance from the June low using the Elliott Wave Principle for Ethereum (ETHUSD). That structure remains intact. Namely, in our last update, when ETH was trading at ~$2,740, we found “Hold $2,480, and the path of least resistance remains toward ~$3,000. A break below $2,427–$2,358 would suggest the five-wave impulse is over and that a deeper retrace (a 2nd wave) to ideally $1900 +/-100 is underway, before a 3rd wave can take hold and rally price to new all-time highs.”
Ethereum Price Forecast
Every new Ethereum analysis as it publishes, today's technical signal and key levels, live price — on one page.
See all Ethereum forecastsFast-forward to today (see Figure 1 below). Ethereum reached $2,804 on September 21, and bottomed at $2,323 today, breaking below the aforementioned “$2,427-2,358” warning zone. Thus, a larger correction (red Wave-ii) has most likely begun before the next bull run can start.
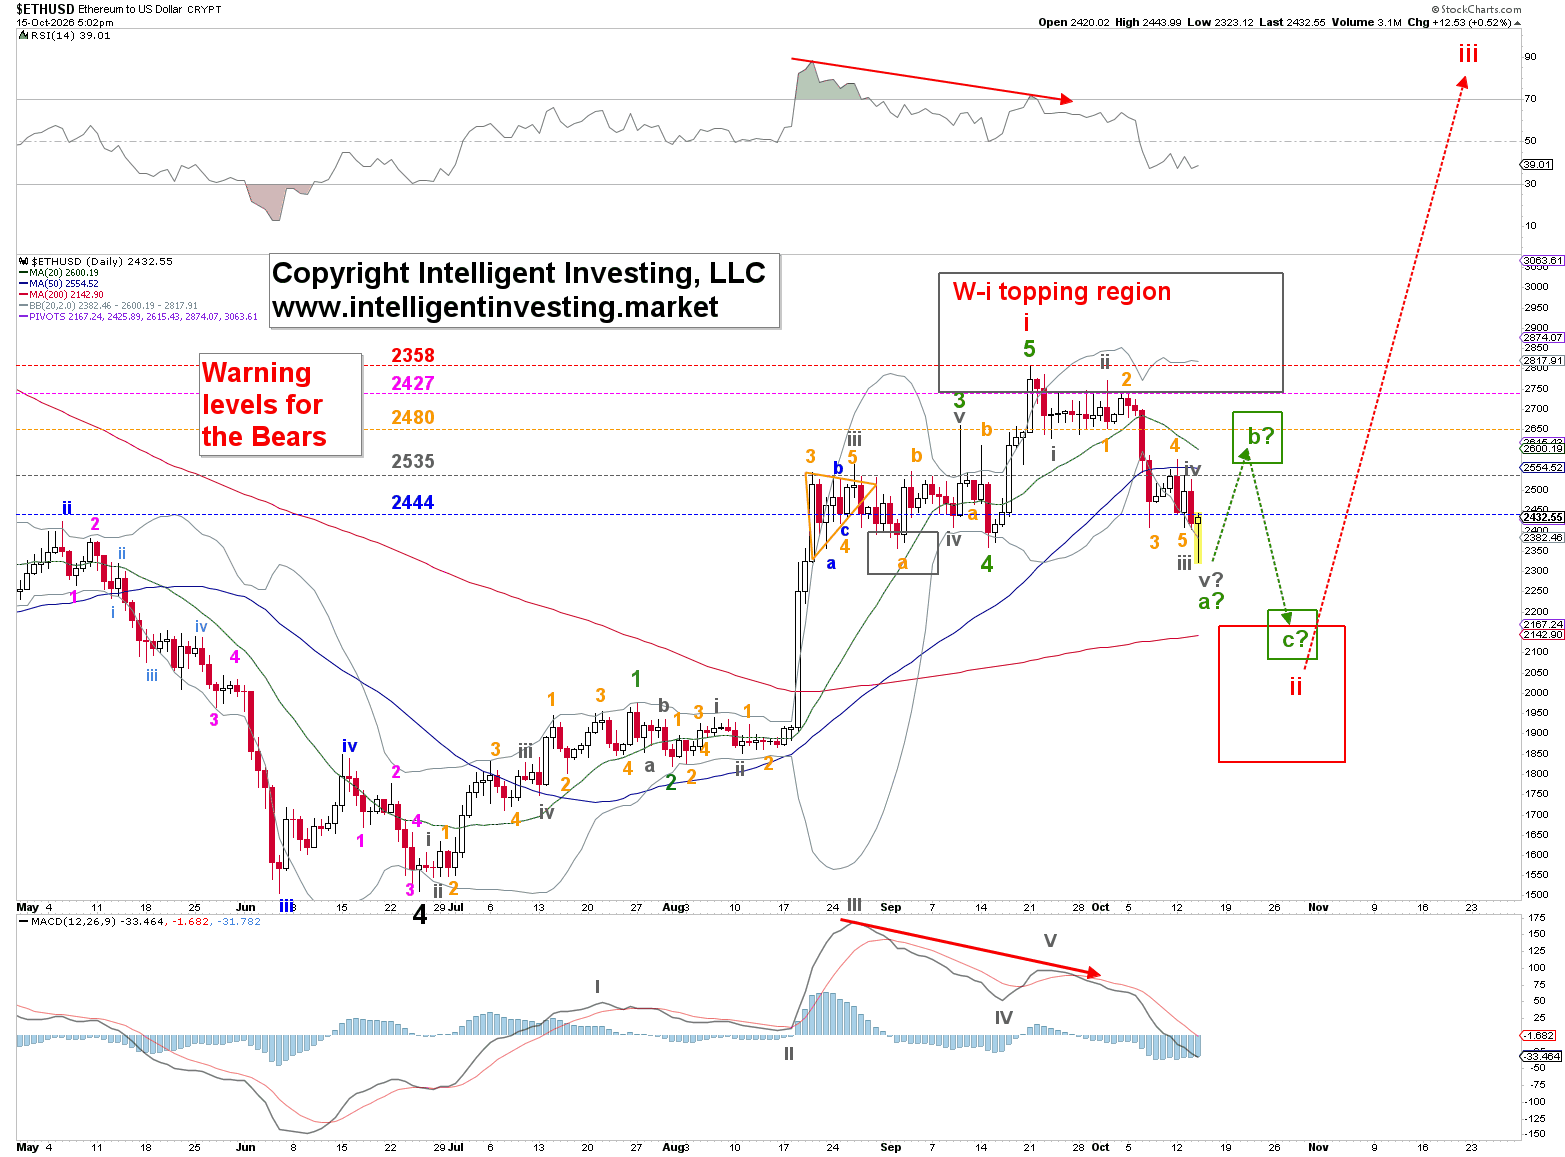
In addition, the decline from the September 21 high comprised five (gray) waves, which make up the larger (green) W-a. This tells us, the red W-ii will be a zigzag as those are 5-3-5 (a-b-c) patterns. As such, we expect a three-wave bounce (green W-b) to ideally $2,625+/-50 from where the five-wave (green) W-c can take hold, to ideally $2150+/-100 as C- and A-waves are often of equal length in a zigzag, though C-waves can extend. That also is at the upper end of the ideal red W-ii target zone (50-76.4% retracement of the prior W-i) and matches our forecast in our previous update.

Long-Term Ethereum Outlook Continues to Point to $6,000-9,000+
We now have five waves up from the July 1 low, and the Bull is confirmed. So, the bigger picture remains unchanged. See figure 2 below. Ethereum has spent almost five years in a complex black wave-4 consolidation that evolved into a multi-year bull flag/triangle. History supports the simple rule on the chart: the longer and larger the base, the larger the eventual expansion. Monthly RSI has again moved out of the green “low risk buy zone,” the same area that marked prior cycle turns.
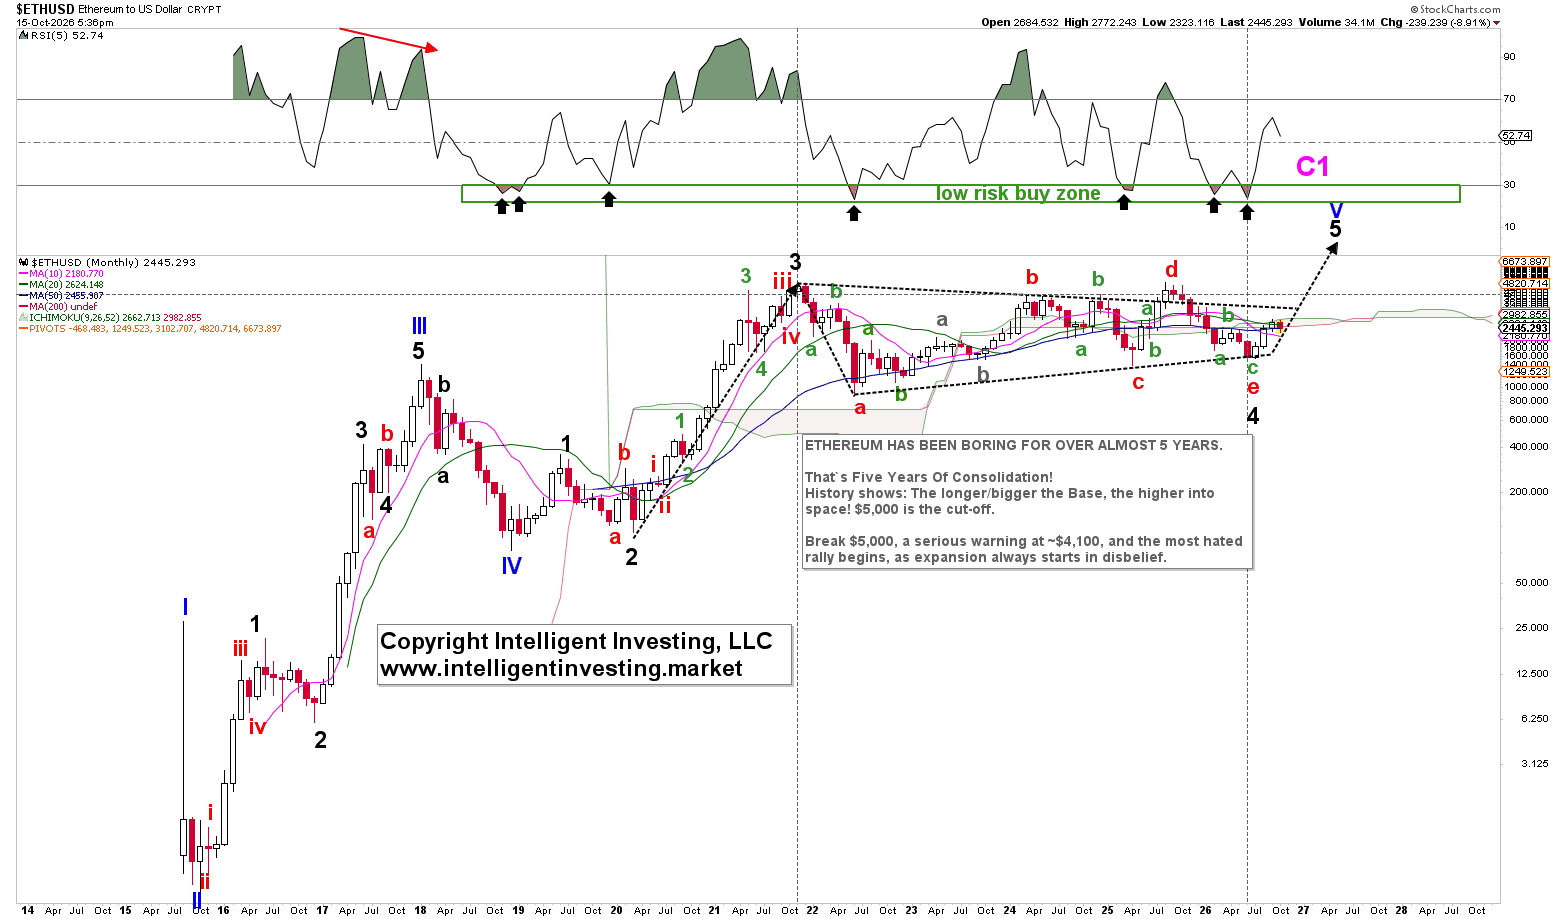
The next major target remains at least $6,250 for black W-5 of blue wave V, though $9000+ seems more likely. The monthly chart also keeps the upside roadmap honest:
- ~$4,150 is the cut-off that would confirm the larger breakout
- ~$2,425 is a serious warning if that breakout later fails
Expansion, if it comes, is likely to start as the “most hated rally,” because this base has lasted long enough for disbelief to become the consensus.