
Oil News: Iran Escalation Tightens Hormuz as OPEC+ Holds Supply
As of September 3, the focus continues to be on renewed U.S.-Iran military conflict and disruption of the Strait of Hormuz. New U.S. strikes on Iranian radar, missiles, and maritime targets prompted Iran’s missile and drone strikes against U.S. facilities in Bahrain, Jordan, Kuwait and Iraq, concerns around broader regional conflict returning to the region. Iran has continued its threats towards tankers in Hormuz, thereby continuing to put disruption of global crude flows at risk.
Conditions for shipping remain very unusual. Reuters reported that Hormuz traffic continues to see a sharp decline, and Iran has expanded the restrictions on vessels it believes are non-compliant. Iraq has begun to provide a partial supply make up, as its crude exports reached 2.34 million barrels per day in August, and are due to increase in September.
OPEC+ will remain unlikely to react strongly. Producers are most likely going to maintain the pumped volume for the month of October, following the completion of the reversal of voluntary supply cuts of 1.65 million bpd, at the meeting scheduled for Sunday.
The U.S. is also taking steps to examine its emergency reserves. The Strategic Petroleum Reserve has fallen to a 44-year low, and Energy Secretary Chris Wright said the U.S. is considering swaps of Venezuelan heavy crude, to restock.
The fundamentals of Natural gas are split. Increased U.S. production and more LNG exports continue, while Gulf LNG supply remains very constrained. Qatar and the UAE have undertaken rare ship-to-ship LNG transfers outside Hormuz, to keep cargoes moving, with Asian spot LNG prices more than doubling pre-war.
On September 3, the key points are equilibrium maintenance in global oil and LNG supply, and an imbalance in supply due to the Gulf conflict. The temporary relief that higher Iraqi export quotas, steady OPEC+ policy, and stronger U.S. gas supply provide does buy some time.
For October, the continental U.S. is set to receive a record amount of LNG. Russian sanctions and strong European demand are expected to maintain high prices, despite the record level supply.

Natural Gas Technical Analysis: NG Breaks Above $2.99 as $3.03–$3.11 Becomes the Next Test
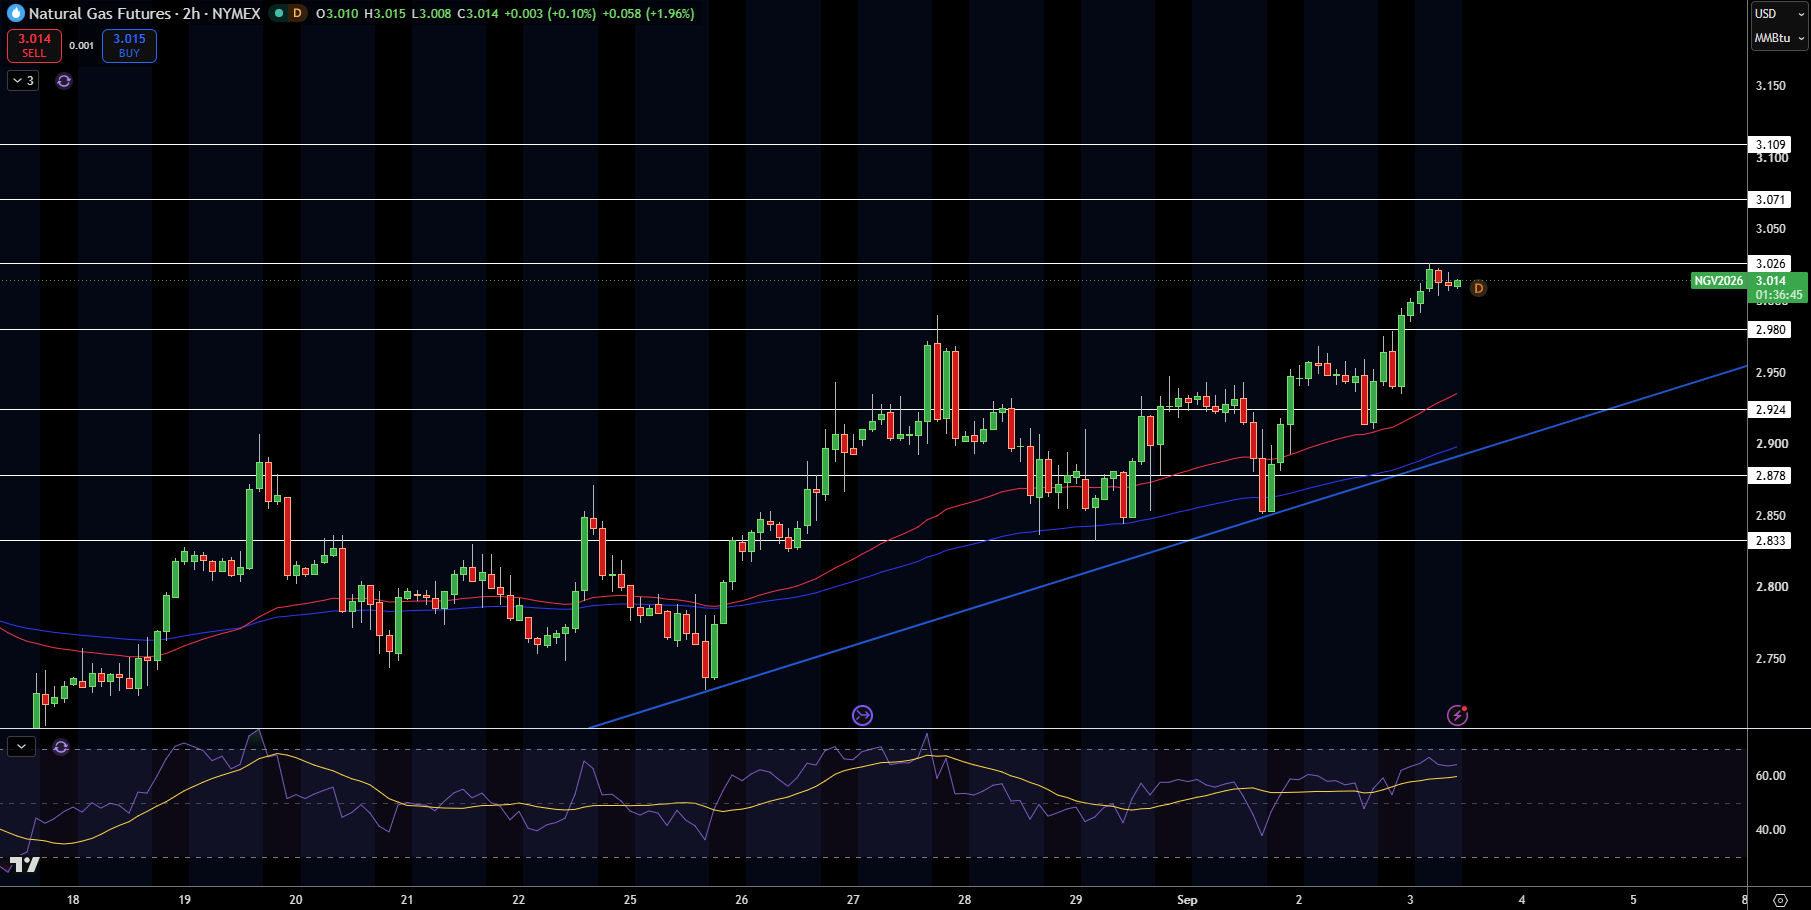
Natural gas is currently trading at $3.01 on the 2-hour chart having broken the resistance at $2.99. In this area, I see some higher lows beginning at around $2.83 and $2.87 and price is holding above both moving averages. This breakout is looking healthy, in my opinion, compared to the single momentum spike.
Rising resistance becomes $3.03, and then $3.07 and $3.11. Falling support becomes $2.98, falling to $2.92, and then $2.88 and $2.83. The current falling support test is a rising trendline that has pulled buyers into recent downtrends.
RSI is currently around 60, meaning there is strong, but not extreme, upward momentum. I am bullish as long as natural gas stays above $2.92 and $2.98. A drop below $2.88 would mean no more buying for me. A move above $3.03 and toward $3.07 and $3.11 would continue to strengthen the resistance levels.
Natural Gas Price Forecast
Every new Natural Gas analysis as it publishes, today's technical signal and key levels, live price — on one page.
See all Natural Gas forecastsWTI Crude Oil Technical Analysis: Breakout Holds Above $87.75 as $92.67 Stays in Sight
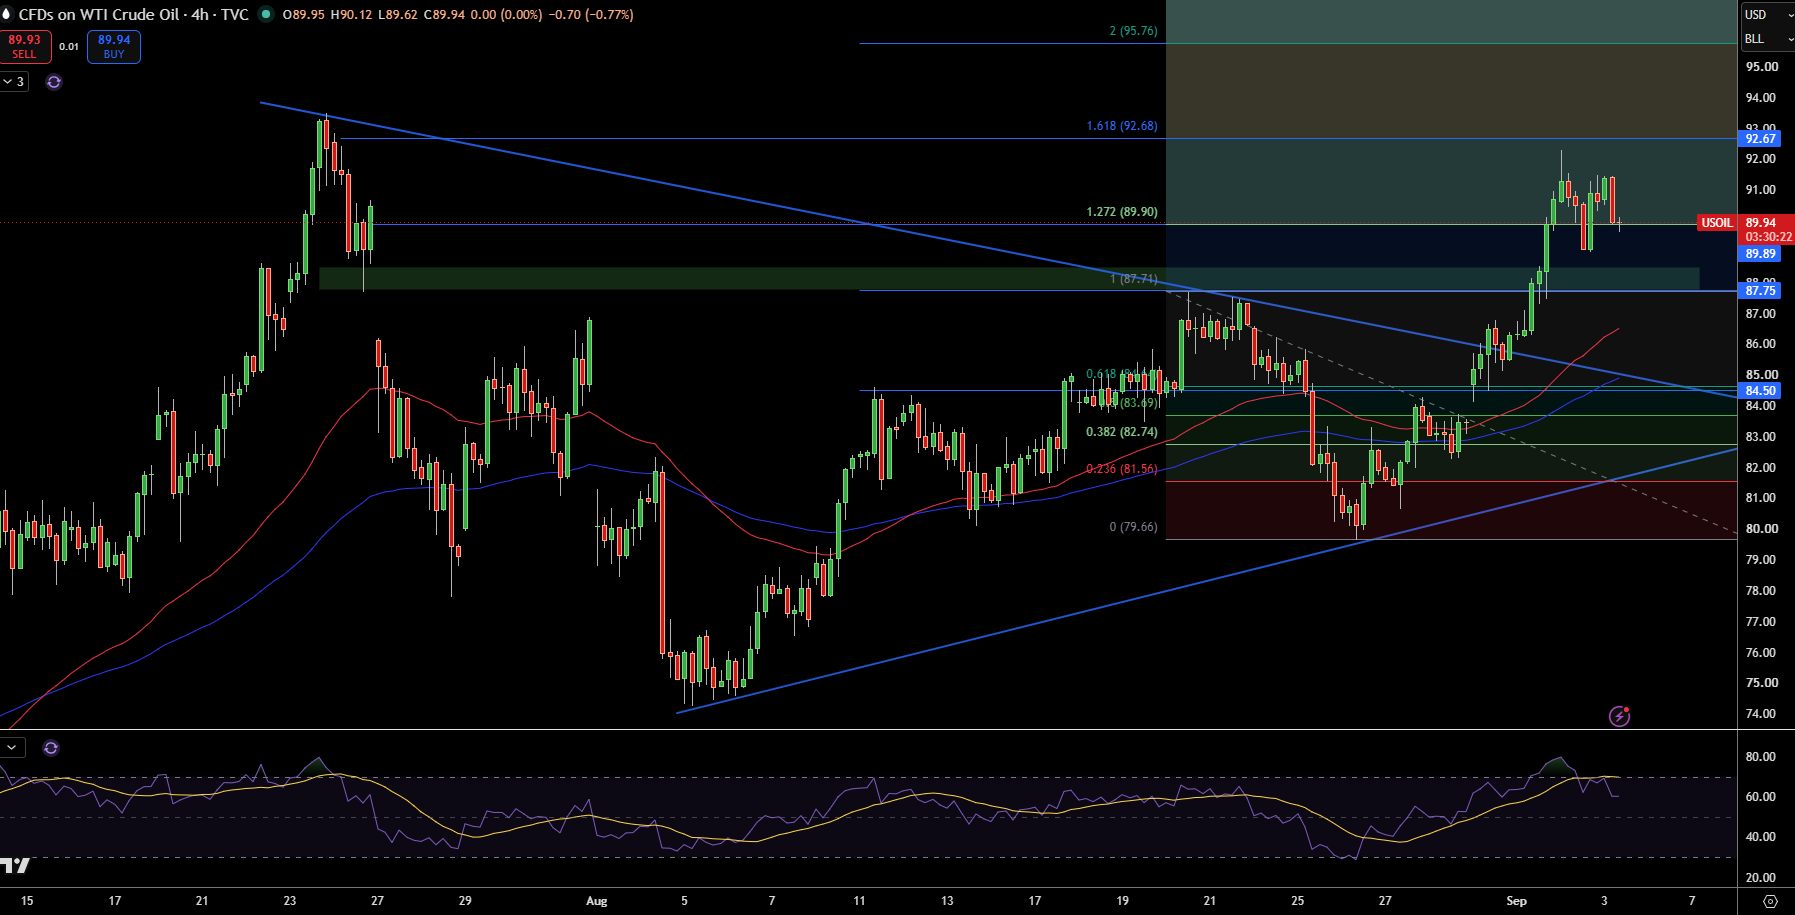
The price of WTI Crude Oil has broken through upward resistance at $87.75, followed by an ascending trend line on the 4-hour chart, and has settled at $89.94. While the price did not immediately reverse, buy-side orders have stepped up to defend $89.90, which is a 1.272 Fib extension of the prior move. This level now serves as my first area of interest as I look for confirmations of the breakout.
If we continue higher, the next areas of interest would be $92.67, $95.76. Meanwhile, on the downside, we would defend $89.90, with more importance placed on $87.75, which was the breakout resistance. Beyond that we would defend $84.50.
The RSI has eased off from very overbought levels, taking momentum out of the rapid move, and I actually consider this a bullish signal. I will continue to be bullish as long as WTI stays above $87.75. If price breaks and closes below this level, I will begin to question the breakout. Conversely, a clear break of $92.67 would strengthen the case for $95.76 as the next target.
Brent Crude Oil Technical Analysis: Brent Tests $94.08 Support After Rejection Below $96.95
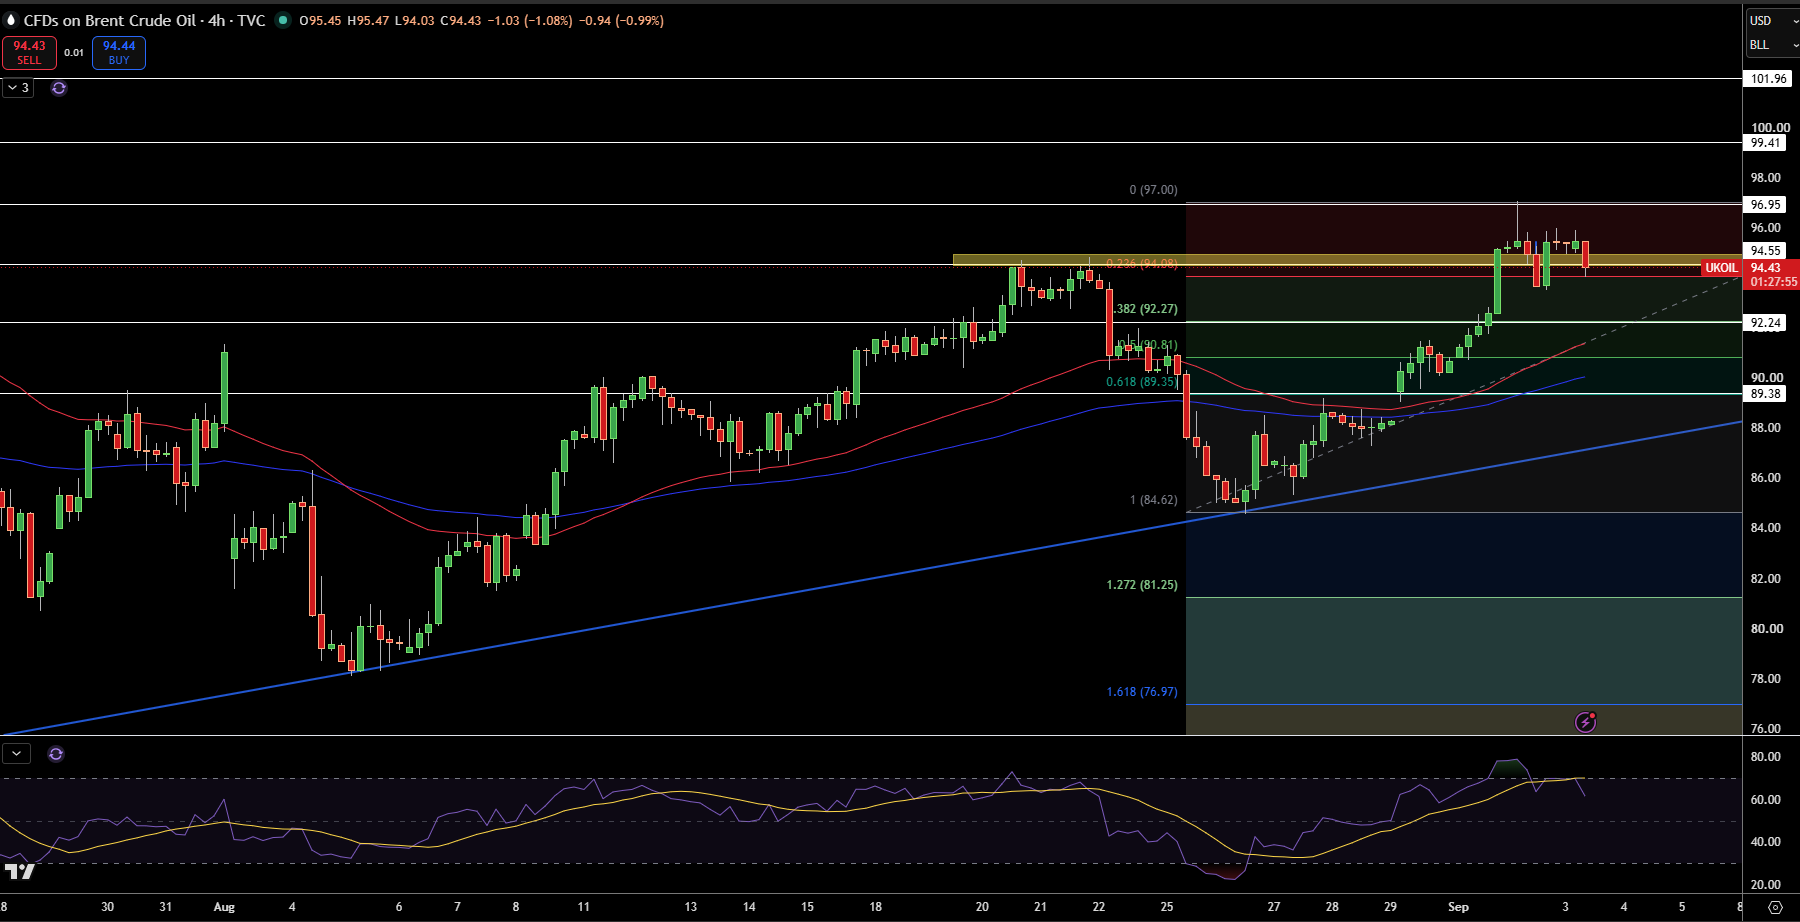
Brent crude currently sits around $94.43 after failing to break the $96.95 resistance level on the 4 hour chart. The level I would like to mention is $94.08 which seems to be an area of congestion in the market above the 23.6 % Fibonacci level. This area is an area of support and where buyers are currently active. $94.08 is the first level to watch for an area of potential support. Below this level we have $92.27, $90.81, and $89.38.
Conversely, we have $96.95 which is the resistance zone above $94.08. Above this level are the resistance levels at $99.41 and $101.96. The crude oil market is sitting above the two key EMAs (50-EMA and 100-EMA) so I wouldn’t consider the bullish structure on the bear trend broken.
The RSI is in a good spot to be buying as it is still in a bullish zone, but has eased off above the overbought level. I would agree that a break below $92.27 is more likely to happen and would indicate the recent breakout is unsuccessful. On the other hand, a break above $96.95 would lead to a better chance of reaching $99.41 and higher.