
Global Energy Dispatch: Geopolitical Friction and Storage Surplus Shape Markets
Unprecedented shifts in the physical balances and signals from world leaders have created challenges for many energy markets. An unusually dramatic dip in oil prices over the last two days was partially reversed with today’s spot market price increases. West Texas Intermediate (WTI) is trading at $75.90 a barrel, and Brent is trading at $79.62, its first sub $80 oil price since July.
Progress in mediation from Qatar has most notably contributed to oil’s most recent price pull back with the goal of deescalating tensions between the U.S. and Iran and creating a safer route through the Strait of Hormuz. Although this situation has partially unwound the risk premium, there has been a surprising tight physical market in the U.S. The latest report from the Energy Information Administration (EIA) showed a huge 7.17 million barrel draw in crude oil inventories, dropping total commercial crude oil inventories to 404.5 million barrels, a 6% draw from the five year seasonal average. Driving this crude oil draw is an increase in the U.S. refinery utilization, reaching 97.2% of its capacity to consume 17.3 million barrels daily.
In the U.S. Natural Gas markets, a buffer has been created for summer use, despite a high demand for natural gas from power generation. Underground storage working inventory increased by a lesser than expected 28 Bcf this week. Total working inventory of natural gas has been reduced to 3.084 Tcf. Natural gas inventories are down 1% from last year and 6.4% above the five year average. With elevated natural gas inventories, peak demand for air conditioning has been met, and exports from LNG facilities are drawing a daily average of 12-13 Bcf.

Natural Gas Technical Analysis: Recovery Attempt Faces Heavy Resistance Below Moving Averages
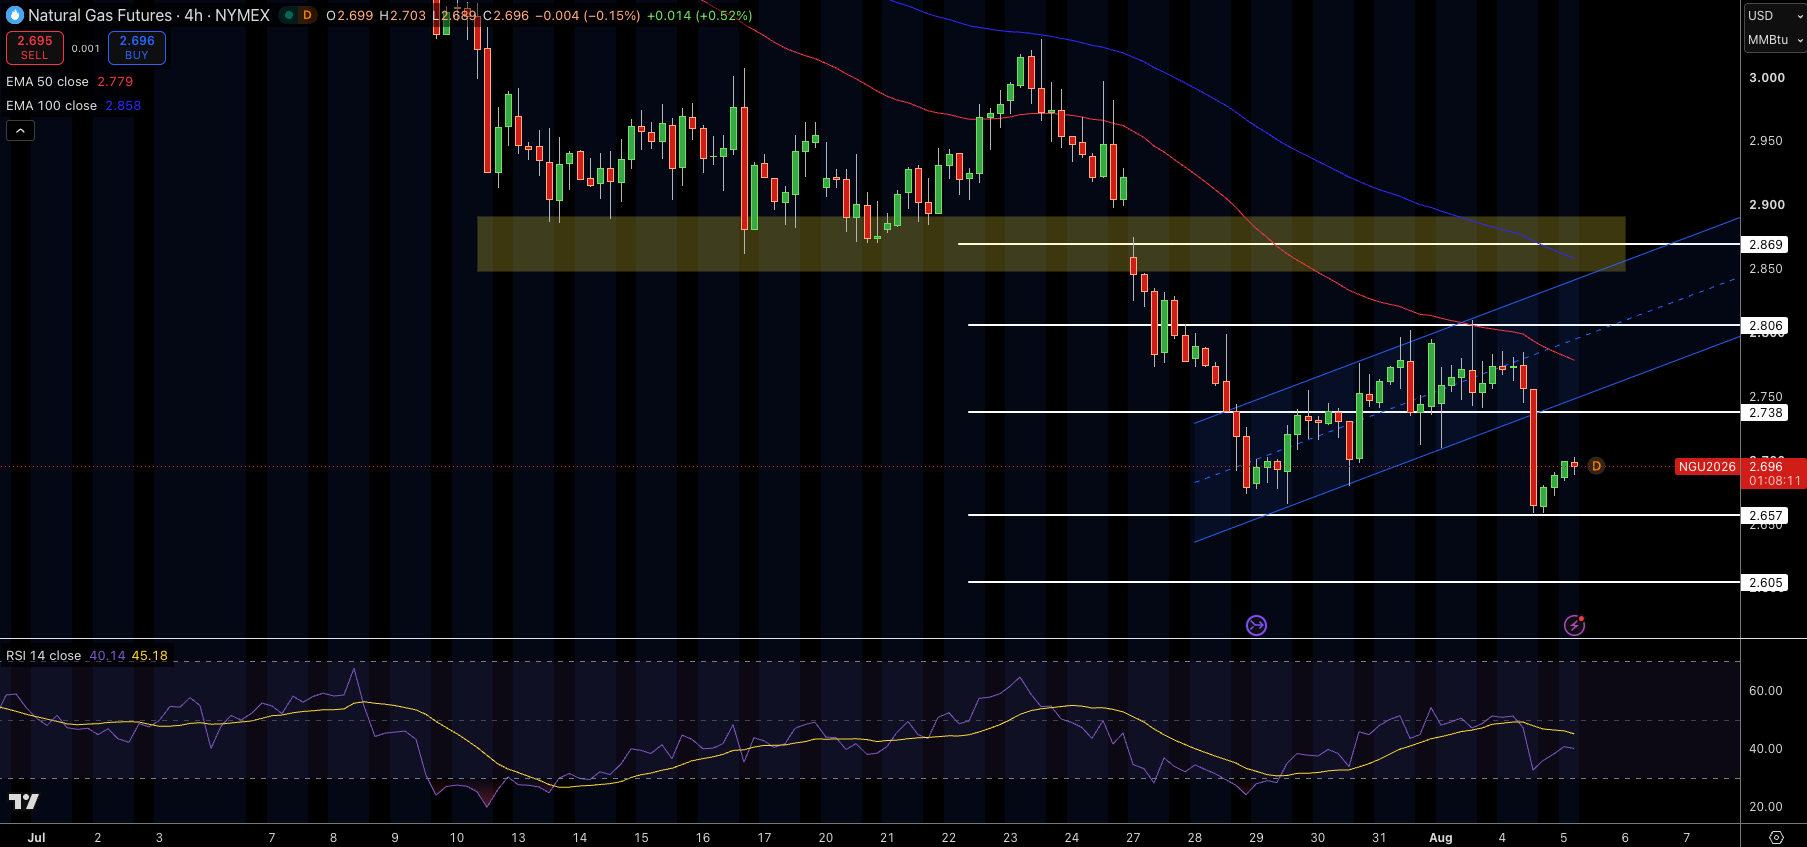
Currently Natural Gas is trading at $2.70, making a weak attempt at recovery having bounced off support at $2.66. Natural Gas has retraced slightly to form a bullish trendline, however, it remains below both the 50 EMA at $2.78 and the 100 EMA at $2.86. This makes the overall market bias still bullish.
The next major resistance is at $2.74, with $2.81 as the next level of resistance. Above those levels are major supply zones which are expected to hold further selling around $2.87. In the opposite direction, critical support is at $2.66. If this level fails to hold, then more downside is expected at $2.60.
RSI is recovering from oversold territory to about 40. While Natural Gas stays below its key moving averages, rallies should be considered as corrections rather than a Bullish reversal.
WTI Crude Oil Technical Analysis: Bears Dominate After Breakdown Below Key Trendline
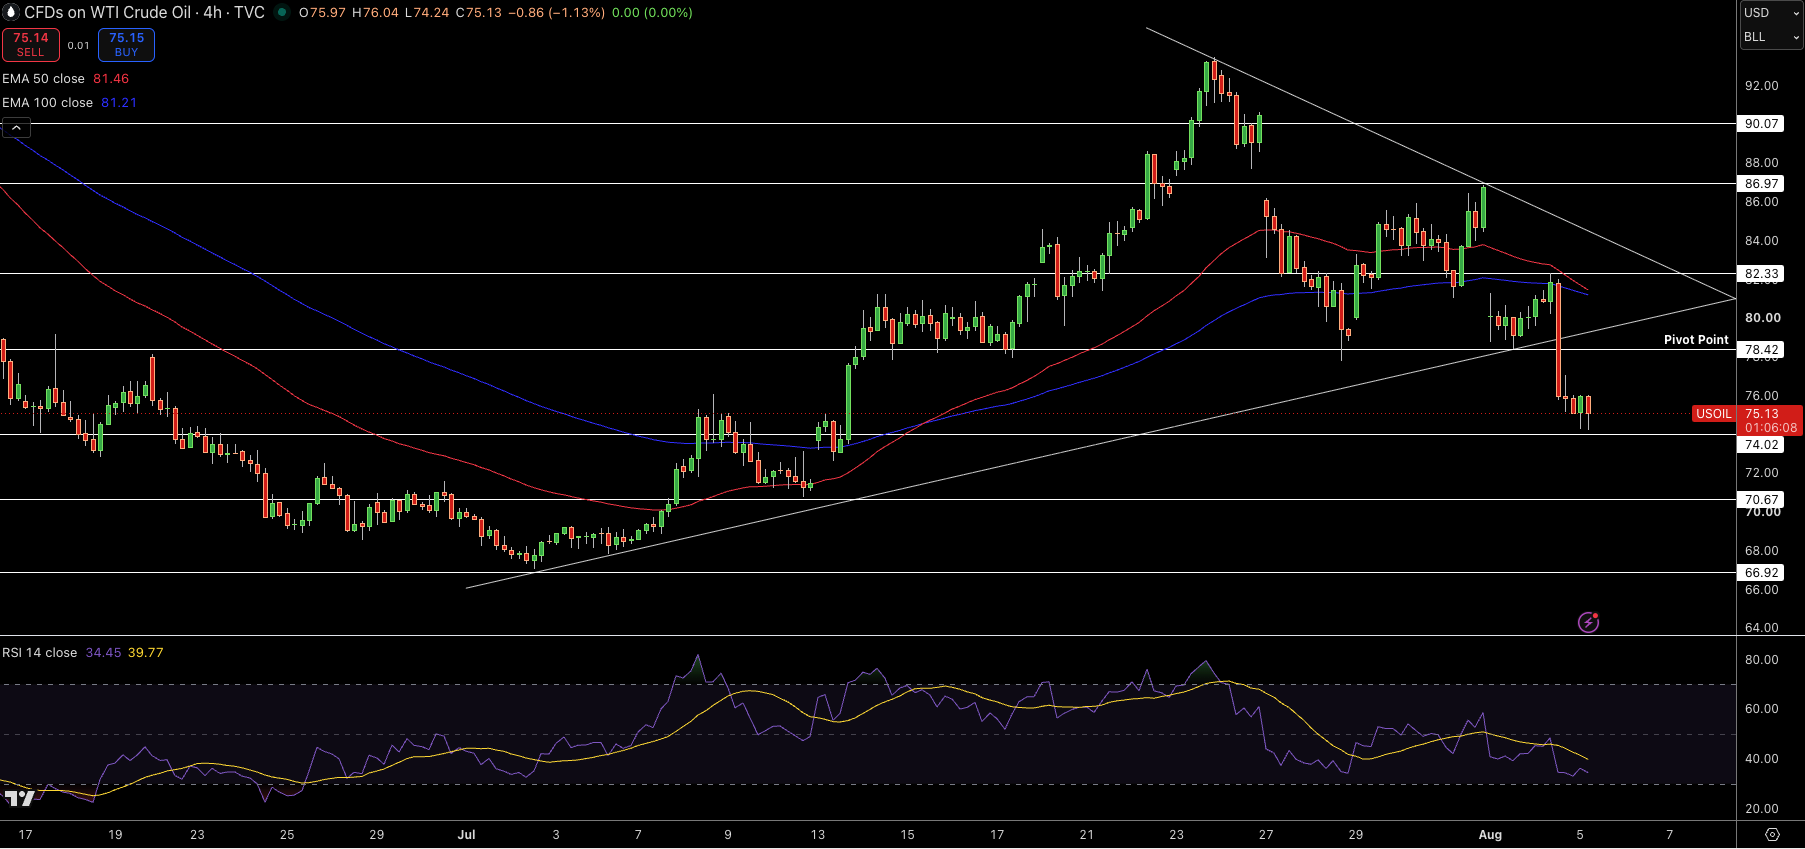
WTI crude prices approached resistance at $80 on March 31, 2023. Support at $78.40 failed to hold the price and crude fell to touch $75.10. The breakdown broke the ascending trend line and confirms a bearish market structure with prices well below the 100-EMA and 50-EMA at $81.21 and $81.46, respectively.
Natural Gas Price Forecast
Every new Natural Gas analysis as it publishes, today's technical signal and key levels, live price — on one page.
See all Natural Gas forecastsBelow $75.10 in the short-term, prices could find support at $74.00 and $70.70. A move back above $78.40 would relieve some selling pressure and allow the moving averges to converge at $82.30, indicating bullish momentum, but prices would need to sustain above this level for a confirmed bullish reversal.
RSI, although at 34, is not at oversold levels and does not signal a reversal. The broken trend line and $78.40 pivot level needs to be broken to the upside to change the short-term bearish trend. As long as WTI crude remains below the trend line and $78.40, the market structure is bearish and likely to attract selling on rallies.
Brent Crude Oil Technical Analysis: Breakdown Below $80.50 Keeps Sellers in Control
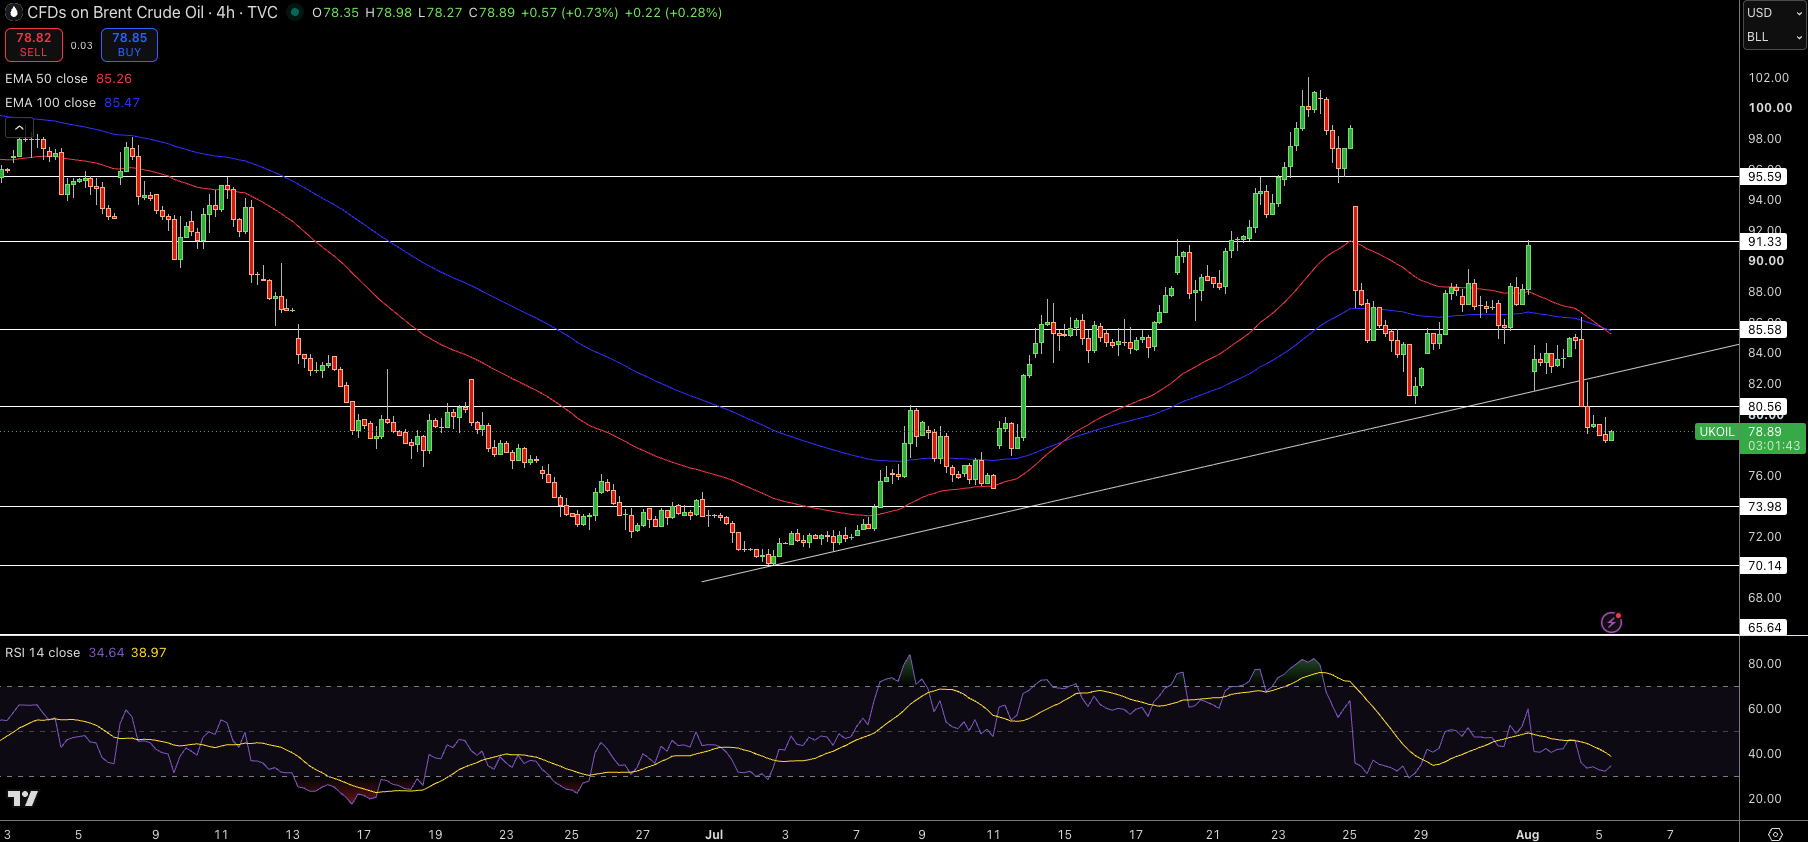
Brent crude fell below the $80.56 support level and the trend line, reaching $78.90 on March 31, 2023. The 50-EMA and 100-EMA are at $85.26 and $85.47, respectively, confirming a bearish trend in the medium term.
Sentiment has turned bearish and prices remain well below both the moving averages with a bias to the downside.
Support is developing around $77.00, and $73.98. At the moment, the first resistance level following the breakdown is at $80.56. The major level of recovery is currently at $85.58. A downward trend will only break if the market bounces and closes above these levels.
RSI has fallen to around 35. This shows strong downside momentum, but also suggests that the market is approaching oversold conditions. While a short-term bounce cannot be ruled out, Brent still remains technically weak as buyers have not reclaimed the former support zone above $80.56.