



Oil News: Hormuz Risks Keep Supply Outlook in Focus
Oil supply concerns remain in the background due to the renewed US-Iran conflicts causing the disruption of shipping traffic in the Strait of Hormuz. Normally, the Strait of Hormuz sees about 20% of the global oil trade. Crude and LNG exports are once again in jeopardy as production in the Gulf has only partially recovered. On Sunday, only 4 ships managed to pass through the Strait of Hormuz.
On August 1st, OPEC+ policies stated that an extra 188,000 barrels of oil could be produced with the possibility of pausing or reversing the increase of barrels due to market conditions worsening. Along these lines, OPEC expects there will be less global consumption and has continued to restrict the 2026 global oil demand growth forecast to 780,000 bpd.
Demand for Natural gas is being supported by the strong demand for liquefied natural gas. According to the US Energy Information Administration, LNG exports are expected to be 17 Bcf/day by 2026. At the same time, the US is expected to have natural gas inventories of 3,966 Bcf by the end of October 2026, approximately 5% over the 5-year average, with record production continuing to meet demand.
Natural Gas Technical Analysis: Consolidation Continues as Market Awaits Breakout
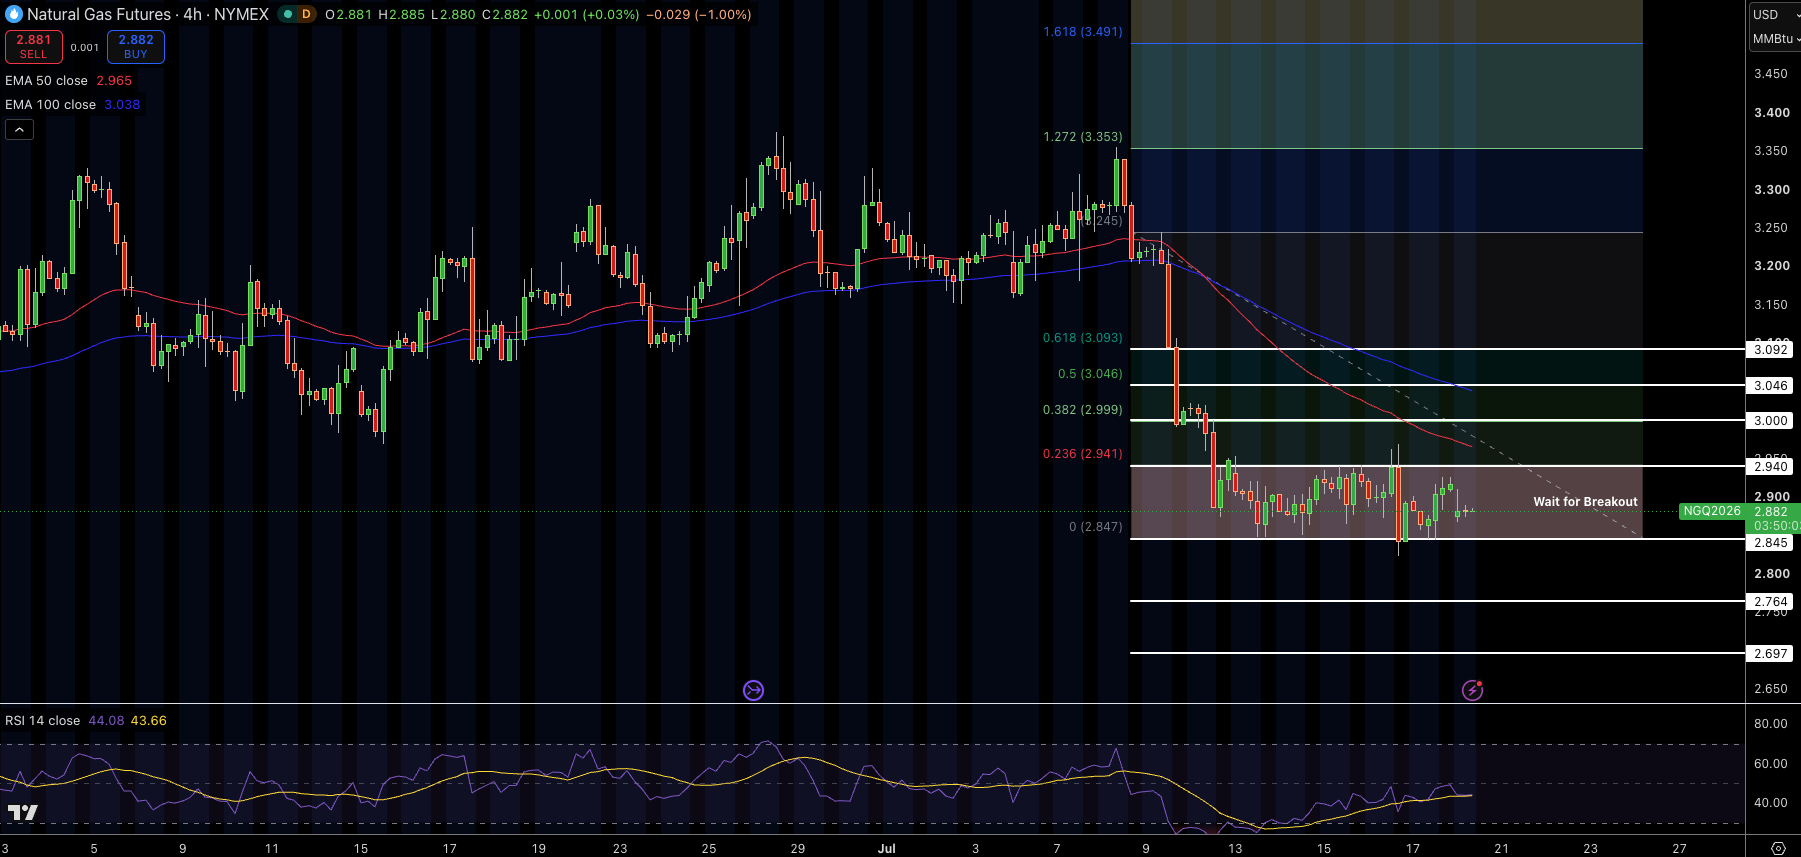
Natural Gas is still consolidating, trading at $2.88 with support at $2.85. Most recently, Natural Gas has been trading below the 50 and 100 days EMAs at $2.97 and $3.04, respectively. This is evidence of a continuing bearish trend. Resistance is at $2.94, $3.00, and $3.05, with support still at $2.85 and $2.76. With an RSI at 44, the current trend is bearish with a neutral momentum.
In my view, the price breaking resistance at $2.94 will allow it to target the $3.00 to $3.05 resistance. Alternatively, breaking support at $2.85 will expose the next lower supports, also a bearish trend.
Natural Gas Price Forecast
Every new Natural Gas analysis as it publishes, today's technical signal and key levels, live price — on one page.
See all Natural Gas forecastsWTI Crude Oil Technical Analysis: Recovery Extends Above Key Moving Averages
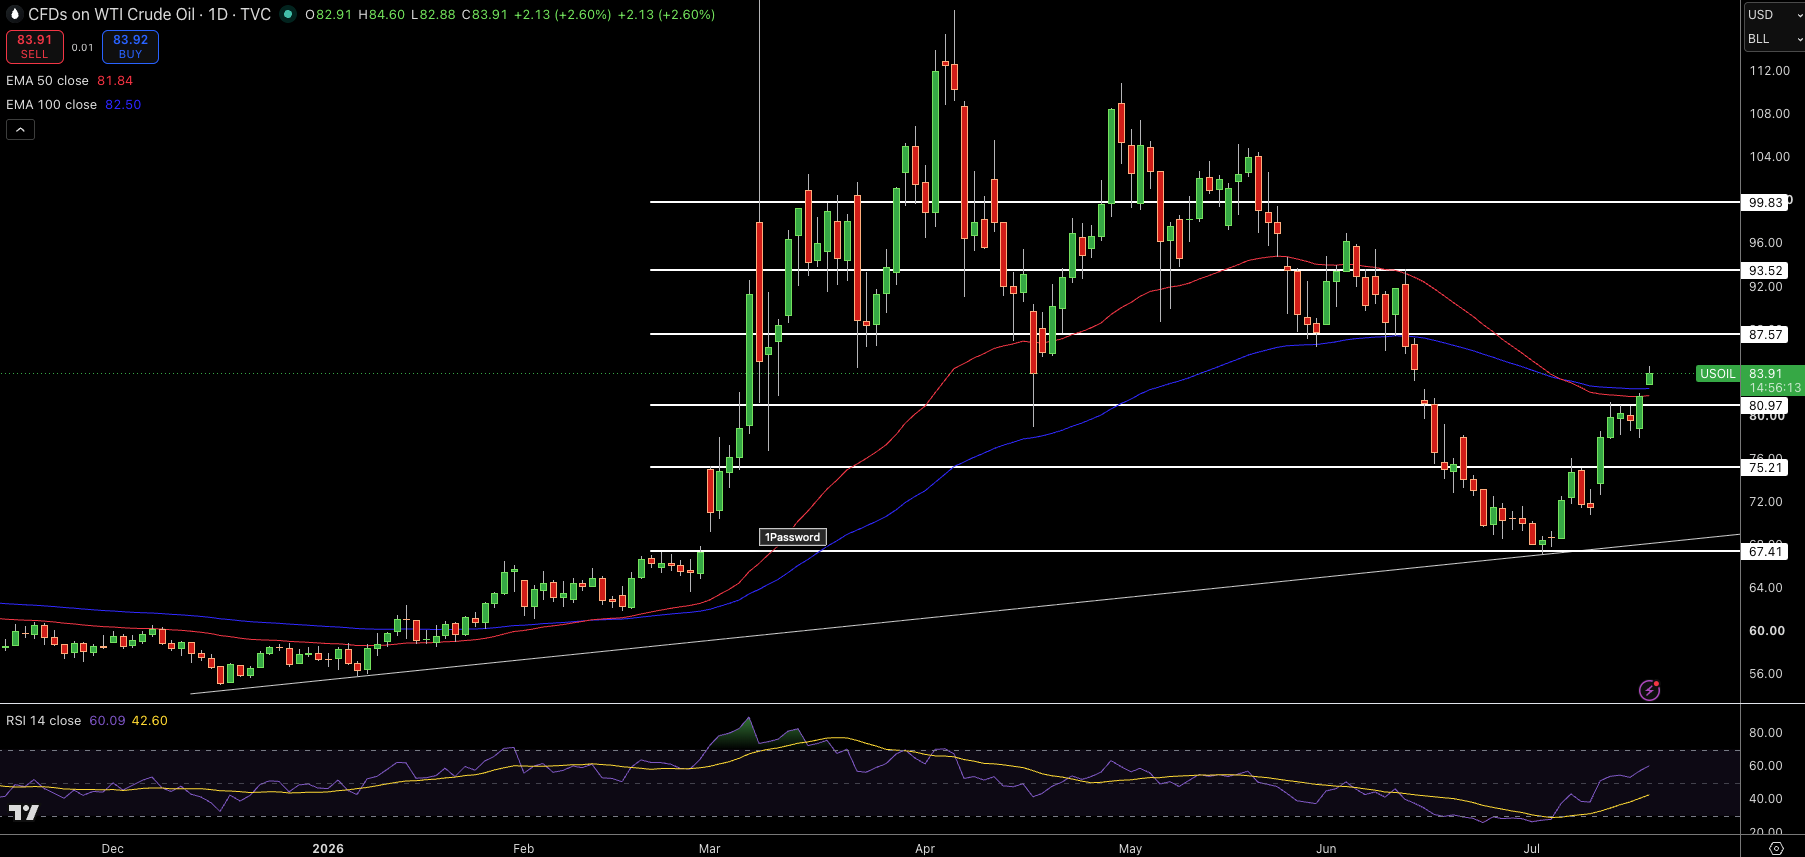
WTI Crude Oil is currently trading just under the $83.91 mark. After the low points in July, WTI was able to break the 50-day at $81.84 and the 100-day at $82.50. After this recovery and break, WTI was able to surpass the $80.97 resistance level. Short term resisitance is at $87.57 and $93.52, while short term support is at $80.97 and $75.21.
The Relative Strength Index (RSI) just under 60 and indicates bullish momentum is growing. There’s potential for the market to trend upwards with a sustain breakup past $87.57. In my view, a break below $80.97 would indicate a weakening bullish market.
Brent Crude Oil Technical Analysis: Bulls Challenge Descending Trendline
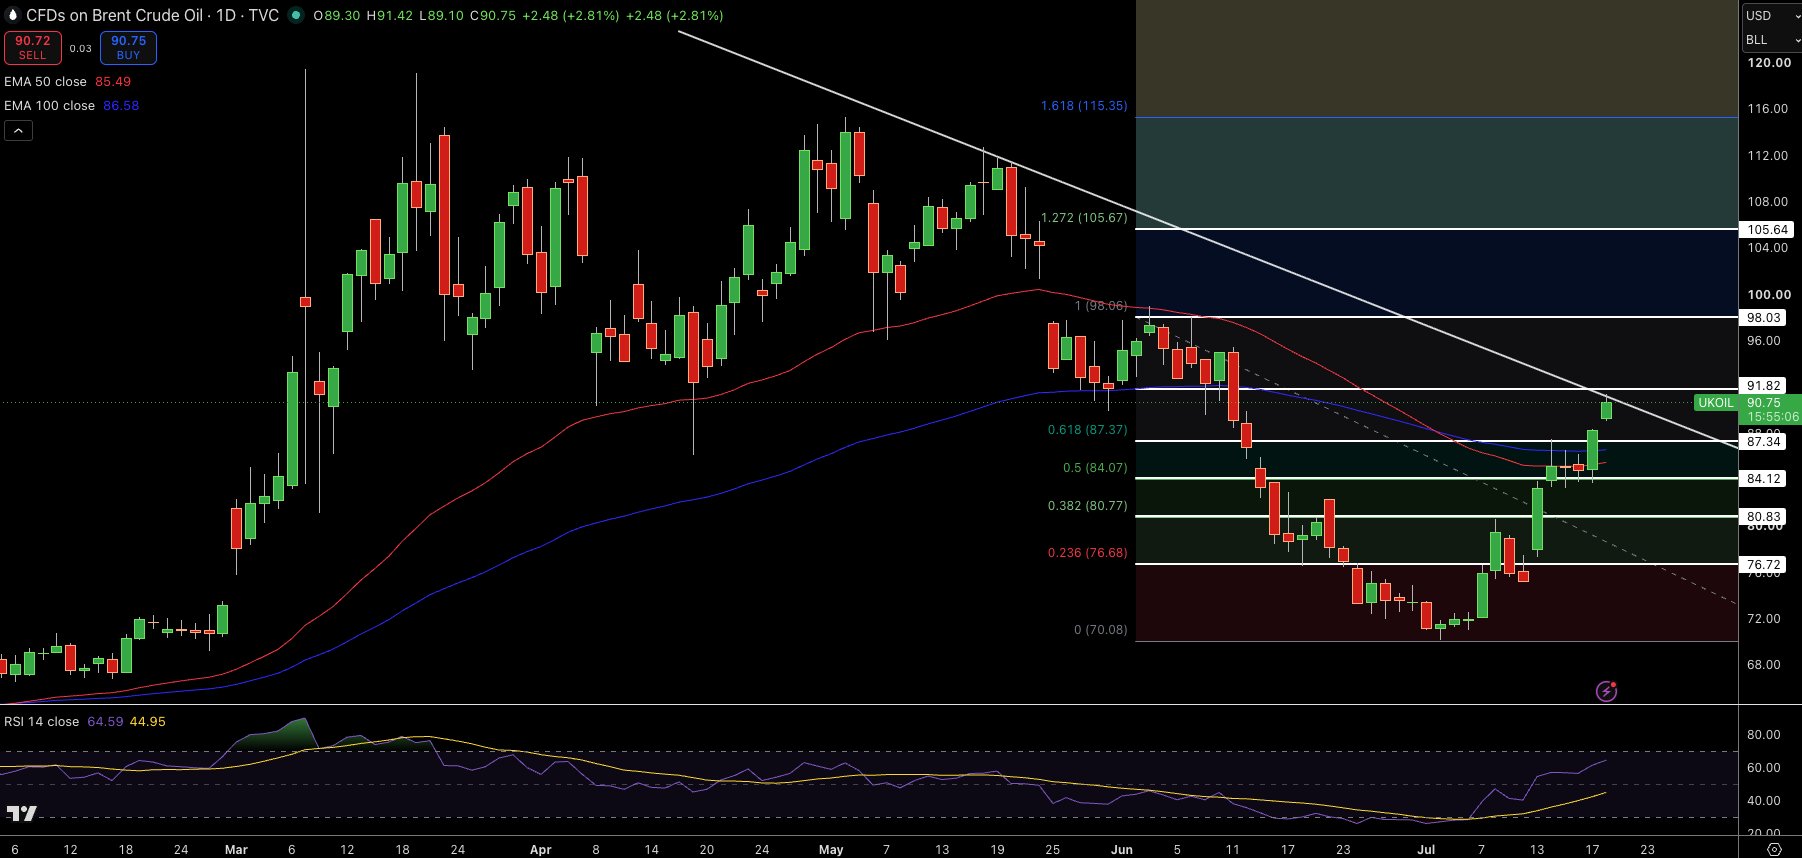
The Brent Crude Oil bulls are extending their rally to challenge the long-term descending trendline after recovering above the 50 and 100 days EMAs. Brent Crude is currently trading at $90.75 and testing resistance at $91.82. If the price breaks above that level, the downtrend will likely to subside. Until that happens, the first line of support to traders will be at $87.34 and the next at $84.12.
Resistance is at $98.03. With RSI at 65, the price is approaching the overbought territory. In my view, a confirmed break of the resistance at $91.82 and the descending trendline will rally the price to $98.03. Until that happens, the price will consolidate above $87.34.