
Oil News: Constant Risks in the Middle East Offset OPEC+ Output Increase
Oil remains balanced between increasing OPEC+ supply and persistent geopolitical supply gaps. Investors are watching how the supply gap caused by conflict and disruption will be closed against how supply will be increased. OPEC+ decided at the weekend to increase production by 188,000 barrels per day in September removing the last of the 1.65 million barrel per day voluntary production cuts implemented this year. The increases have not been as large in the case. Supply disruptions caused by the conflict in Iran and other production issues have limited how much oil some producers are actually able to export.
Most of the price patterns are a response to geopolitical events. Prices increased again on Tuesday after a drop on Monday. The reason for the drop on Monday was a lack of clarity. President Trump stated that negotiations had started and that he had suspended military operations. The Iranian officials denied that the negotiations had started. For the Strait of Hormuz and the Bab el-Mandeb, there are active threats to shipping and increases in the cost of insurance and the length of transport which keeps a risk premium on all crude oil.
Even with high LNG inventories, the fundamental outlook for LNG remains bullish. This week, the U.S. JOLTS job openings, factory orders, ADP employment, ISM Services PMI, and Nonfarm Payrolls will help develop the market’s expectations for the Fed’s policy and the outlook for industrial energy demand. Additionally, the U.S. is continuing its efforts to become the world’s largest LNG exporter and is benefitting from strong demand for LNG abroad to offset high inventories at home. For the remainder of the week, we are likely to see strong LNG export volumes supported by supply management from the OPEC+ group and volatile geopolitical environments continue to dominate energy price movements.

Natural Gas Technical Analysis: Buyers Attempt Break Above Rising Channel Resistance
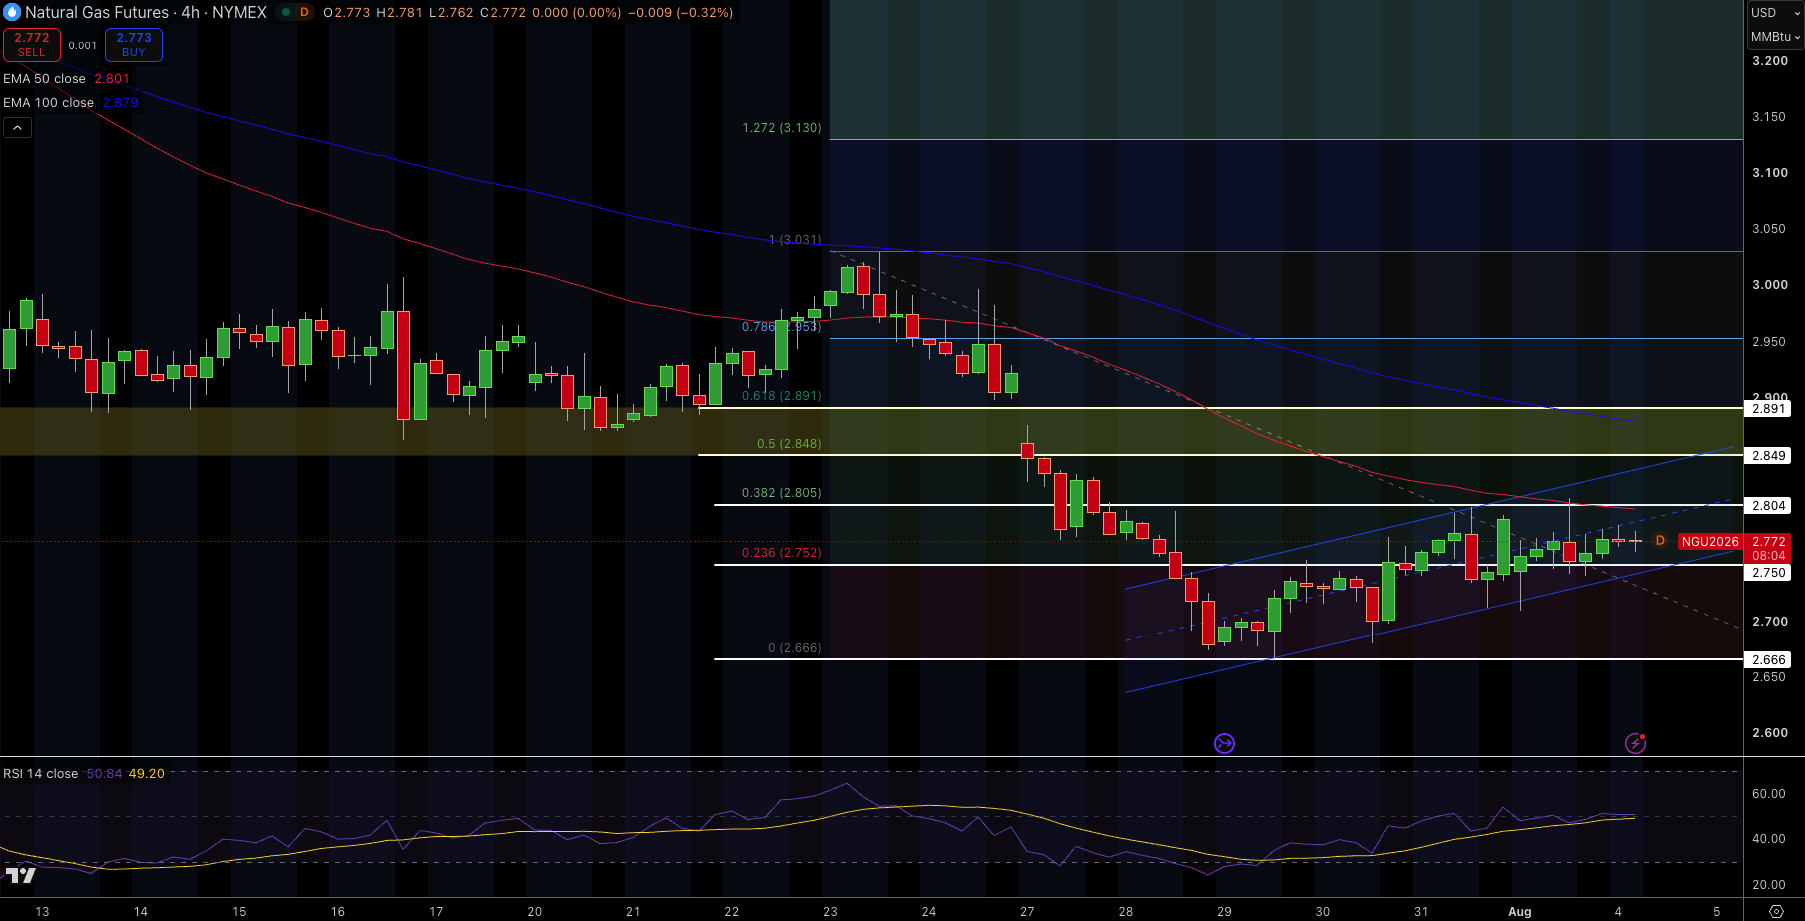
Natural gas futures are currently sideways around 2.77 in the lower boundary of an ascending channel as they rebounded from the 2.67 support level. Price is gradually advancing towards the resistance zone of 2.75-2.80, making an attempt to create a series of higher lows.
The medium-term trend remains cautious with the 50-EMA (2.80) and 100-EMA (2.88) still acting as levels of resistance, but there are more positive aspects with the short-term price action. A break above 2.80 exposes the next levels of 2.85 and 2.89. The immediate support level is at 2.75. A stronger price support level is expected around 2.67 should the sellers win the battle.
RSI has approached 49, suggesting that the bullish momentum is improving, but still has room before becoming overbought. The structure has been forming a bullish case with the average moving above the moving averages, but until it actually breaks that structure, the bullish case would be invalid.
WTI Crude Oil Technical Analysis: Bulls Defend Trendline but $82.80 Remains Key Resistance
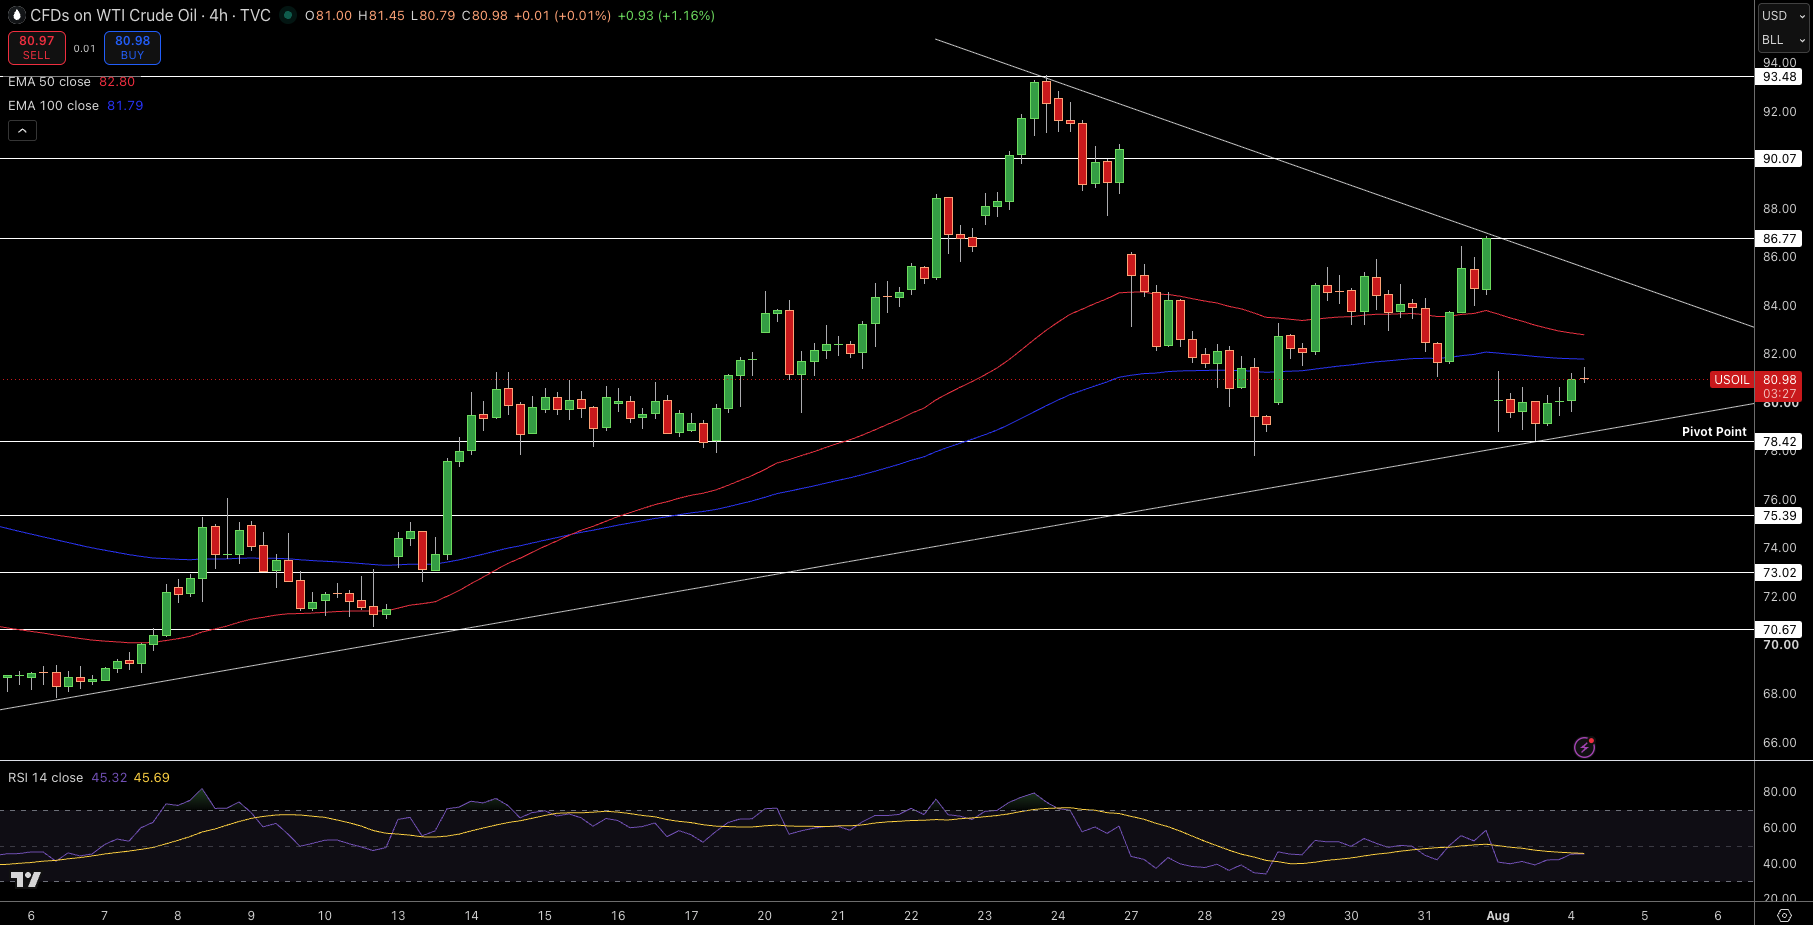
WTI Crude is holding above $81.00 as a rebound from the $78.40 rising trendline support. The recent rebound has helped price move away from oversold territory, but the recovery is still limited as WTI continues to trade beneath the 50-EMA ($82.80) and 100-EMA ($81.79).
Natural Gas Price Forecast
Every new Natural Gas analysis as it publishes, today's technical signal and key levels, live price — on one page.
See all Natural Gas forecastsThe first resistance is between $81.80 to $82.80, where the moving averages converge. A conviction close above this area opens risk toward $84.30 and $86.80, and the falling trendline resistance at $88.50. If the bullish momentum is lost, the rising trendline will be in focus as support, and a bearish break below $78.40 renews the focus to the previous support at $75.40.
The current reading on RSI is at 46, indicating that the selling pressure is minimal. As long as WTI holds the rising trendline, downside risks are limited. For a bullish confirmation, WTI should trade above the moving averages.
Brent Crude Technical Analysis: Recovery Faces EMA Resistance Below $86
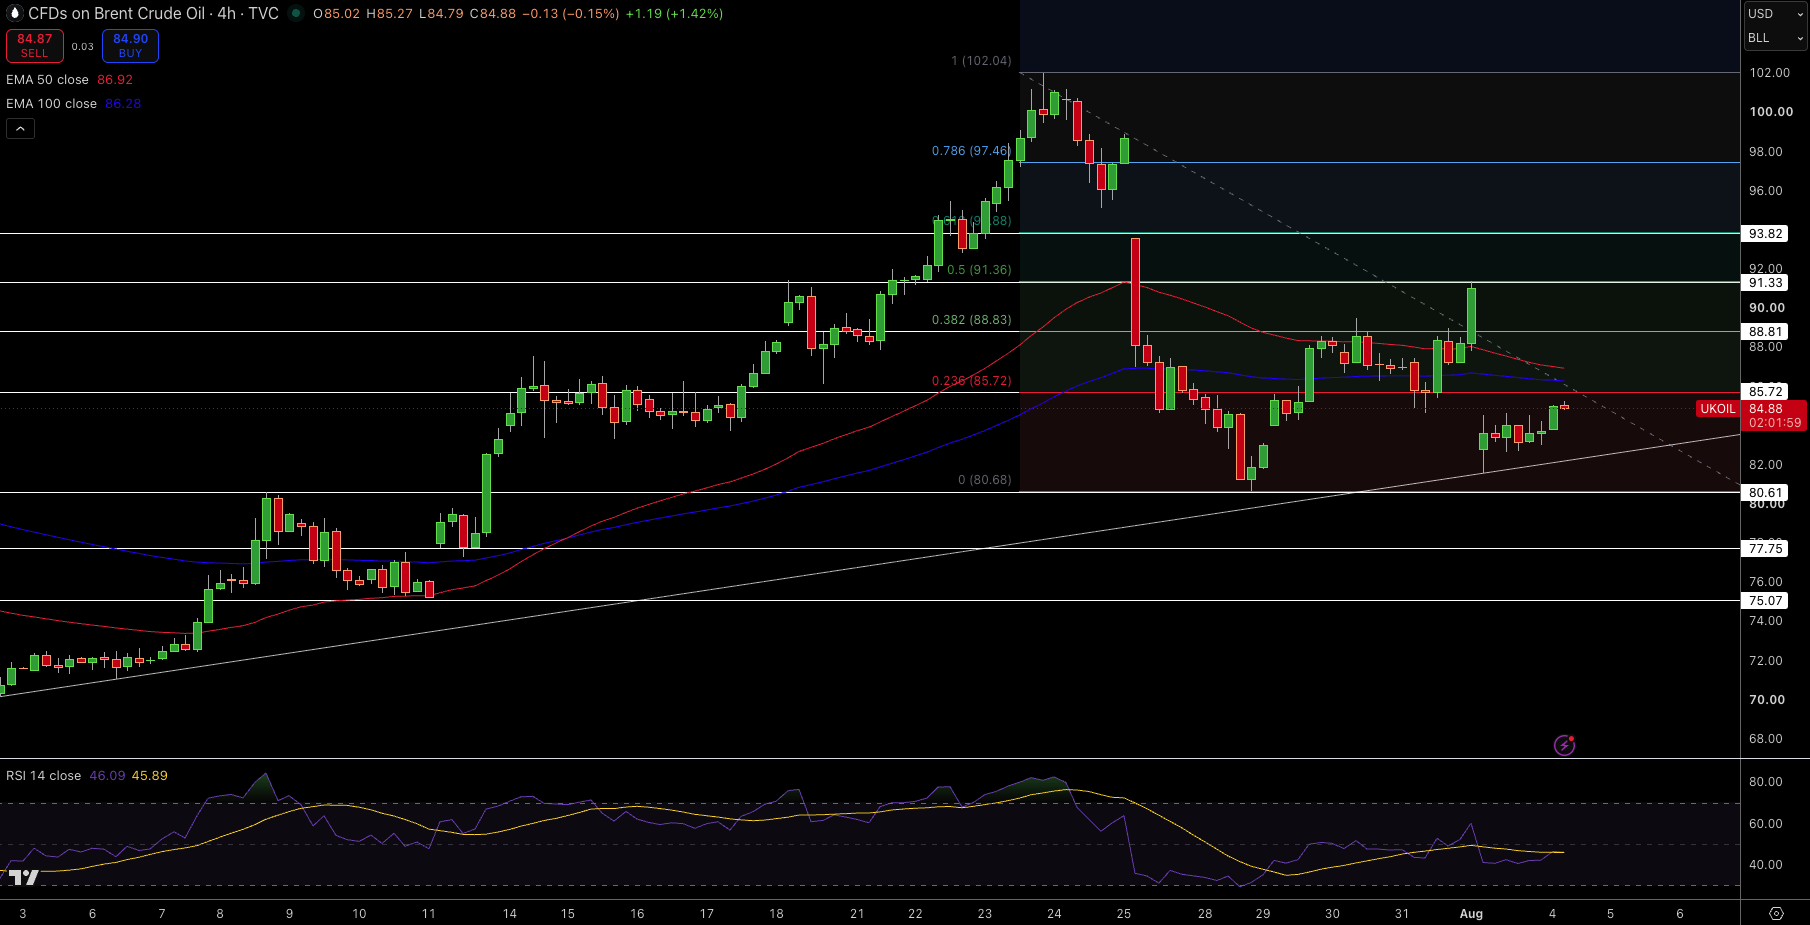
Brent crude is holding around $84.90 after finding a rebound to the support zone at $80.60. The rebound price action respected the longer-term ascending trendline. Price continues to hold beneath both the 50-EMA ($86.92) and 100-EMA ($86.28), creating a short-term range bias within the
Resistance lies at $85.70-$86.30, $88.80, and $91.30. The last three swing highs align with Fibonacci resistance. We could see a more extended move to the upside above the moving averages and to $93.80 in the case of an above-average daily close. An invalidation of this zone could lead to selling pressure targeting the $82.00 level with $80.60 remaining structural support.
As RSI settles around 46, we could be seeing a weaker bearish trend following the sharp decline despite the continued sideways Brent movement. The bulls need to break above the EMA cluster for the larger-trend bullish reversal to confirm.