
Oil News: U.S.-Iran Strikes Tighten Hormuz Risk as Crude Stocks Fall
Oil fundamentals on September 2 began to tighten significantly after the most significant attacks by the United States and Iran in weeks, effectively ending the temporary lull in the ongoing conflict. The United States attacked Iranian air defense, maritime and communication systems, and Iran launched missiles and drones against United States positions in Jordan, Iraq, and Bahrain. The renewed conflict has raised renewed concerns of prolonged disruption of trade through the Strait of Hormuz. Historically, the Strait of Hormuz accounted for approximately 20% global trade of crude oil.
Physical trade conditions have worsened. Kpler data reported only four commodity vessels crossed the Strait of Hormuz on Tuesday, compared to the 10-day average of 13. The Islamic Revolutionary Guard Corps signaled further disruptions of trade would occur and the Bab el-Mandeb also showed a decrease in shipping. Two Saudi supertankers were hit by projectiles this week.
The additional signals from United States inventories were supportive. Commerce data cited by Reuters showed a draw of about 2.6 million barrels, which tightened the domestic balance before the next official EIA report.
The outlook for natural gas remained far less constrained. The EIA reported that LNG exports averaged 17.4 Bcf/d in the first half of 2026, an increase of 23% from last year, and capacity continuing to grow at Plaquemines, Corpus Christi Stage 3, and Golden Pass. The agency expects LNG exports to average 17.3 Bcf/d in the second half of 2026, then increase again in 2027.
Global LNG markets remain tight, especially since the disruption of Hormuz has decreased Qatari supply and prompted Asian buyers to compete with the U.S. for spot LNG cargoes. For September 2, the energy balance is geopolitical and decisive: with the renewed military conflict and declining shipments through Hormuz, supplies of oil and LNG become tighter, while increasing U.S. gas production and export capacity is the main buffer.

Natural Gas Technical Analysis: NG Holds Breakout Above $2.90 as $2.99–$3.03 Becomes the Next Test
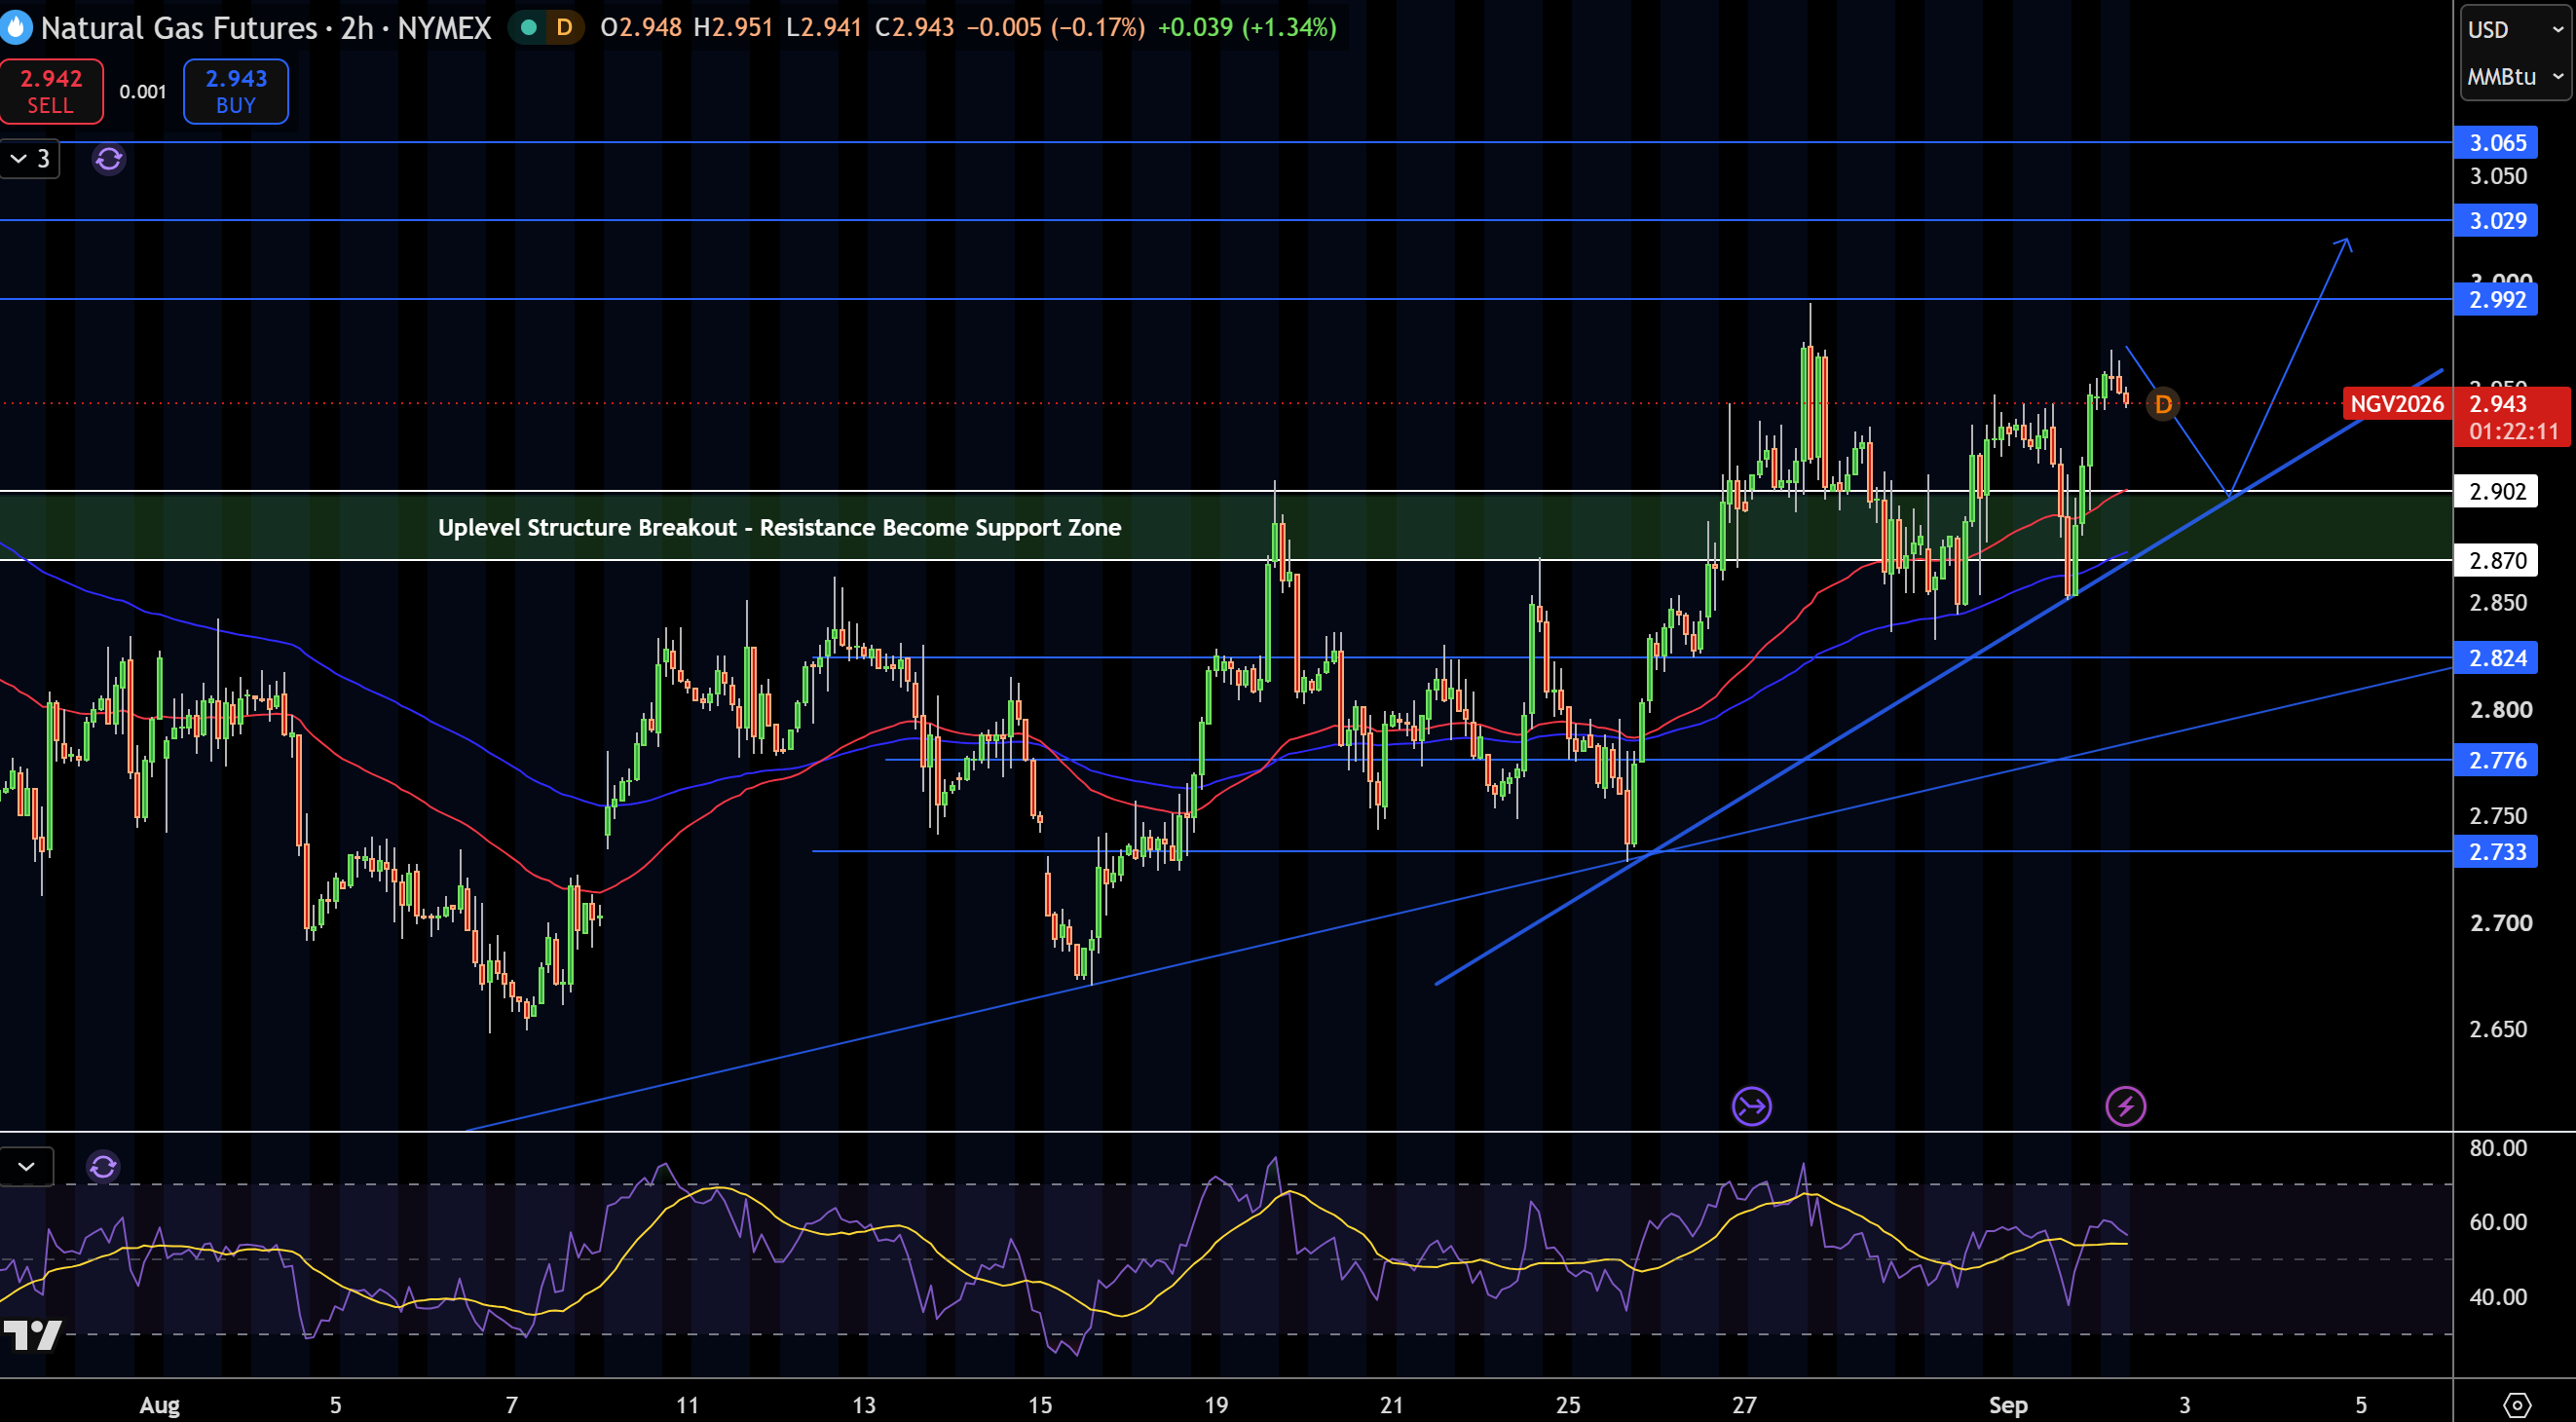
Natural gas is currently trading at around $2.94 on the 2-hour chart following a breakout above $2.87 to $2.90. This area was previously resistance and is currently support, and so the overall bullish structure remains intact. Buyers have continued to step in and the price themselved are supported by a trendline which is sloping up and by a series of higher lows.
Immediate resistance comes in at around $2.99, $3.03 and $3.07. The support zone of $2.90 to $2.87 is the area of interest on the downside along with $2.82, $2.78 and $2.73. The overall structure is still bullish.
RSI is continuing to trade in the positive space of around the upper 50s and lower 60s, indicative of positive, but not overbought, momentum. Natural gas is still trading bullish as long as it is above the support zone of $2.87 to $2.90. A break above $2.99 would set a target of $3.03 to $3.07. A break below $2.87 would set a target of $2.82.
Natural Gas Price Forecast
Every new Natural Gas analysis as it publishes, today's technical signal and key levels, live price — on one page.
See all Natural Gas forecastsWTI Crude Oil Technical Analysis: Breakout Above $87.75 Opens the Door Toward $92.67
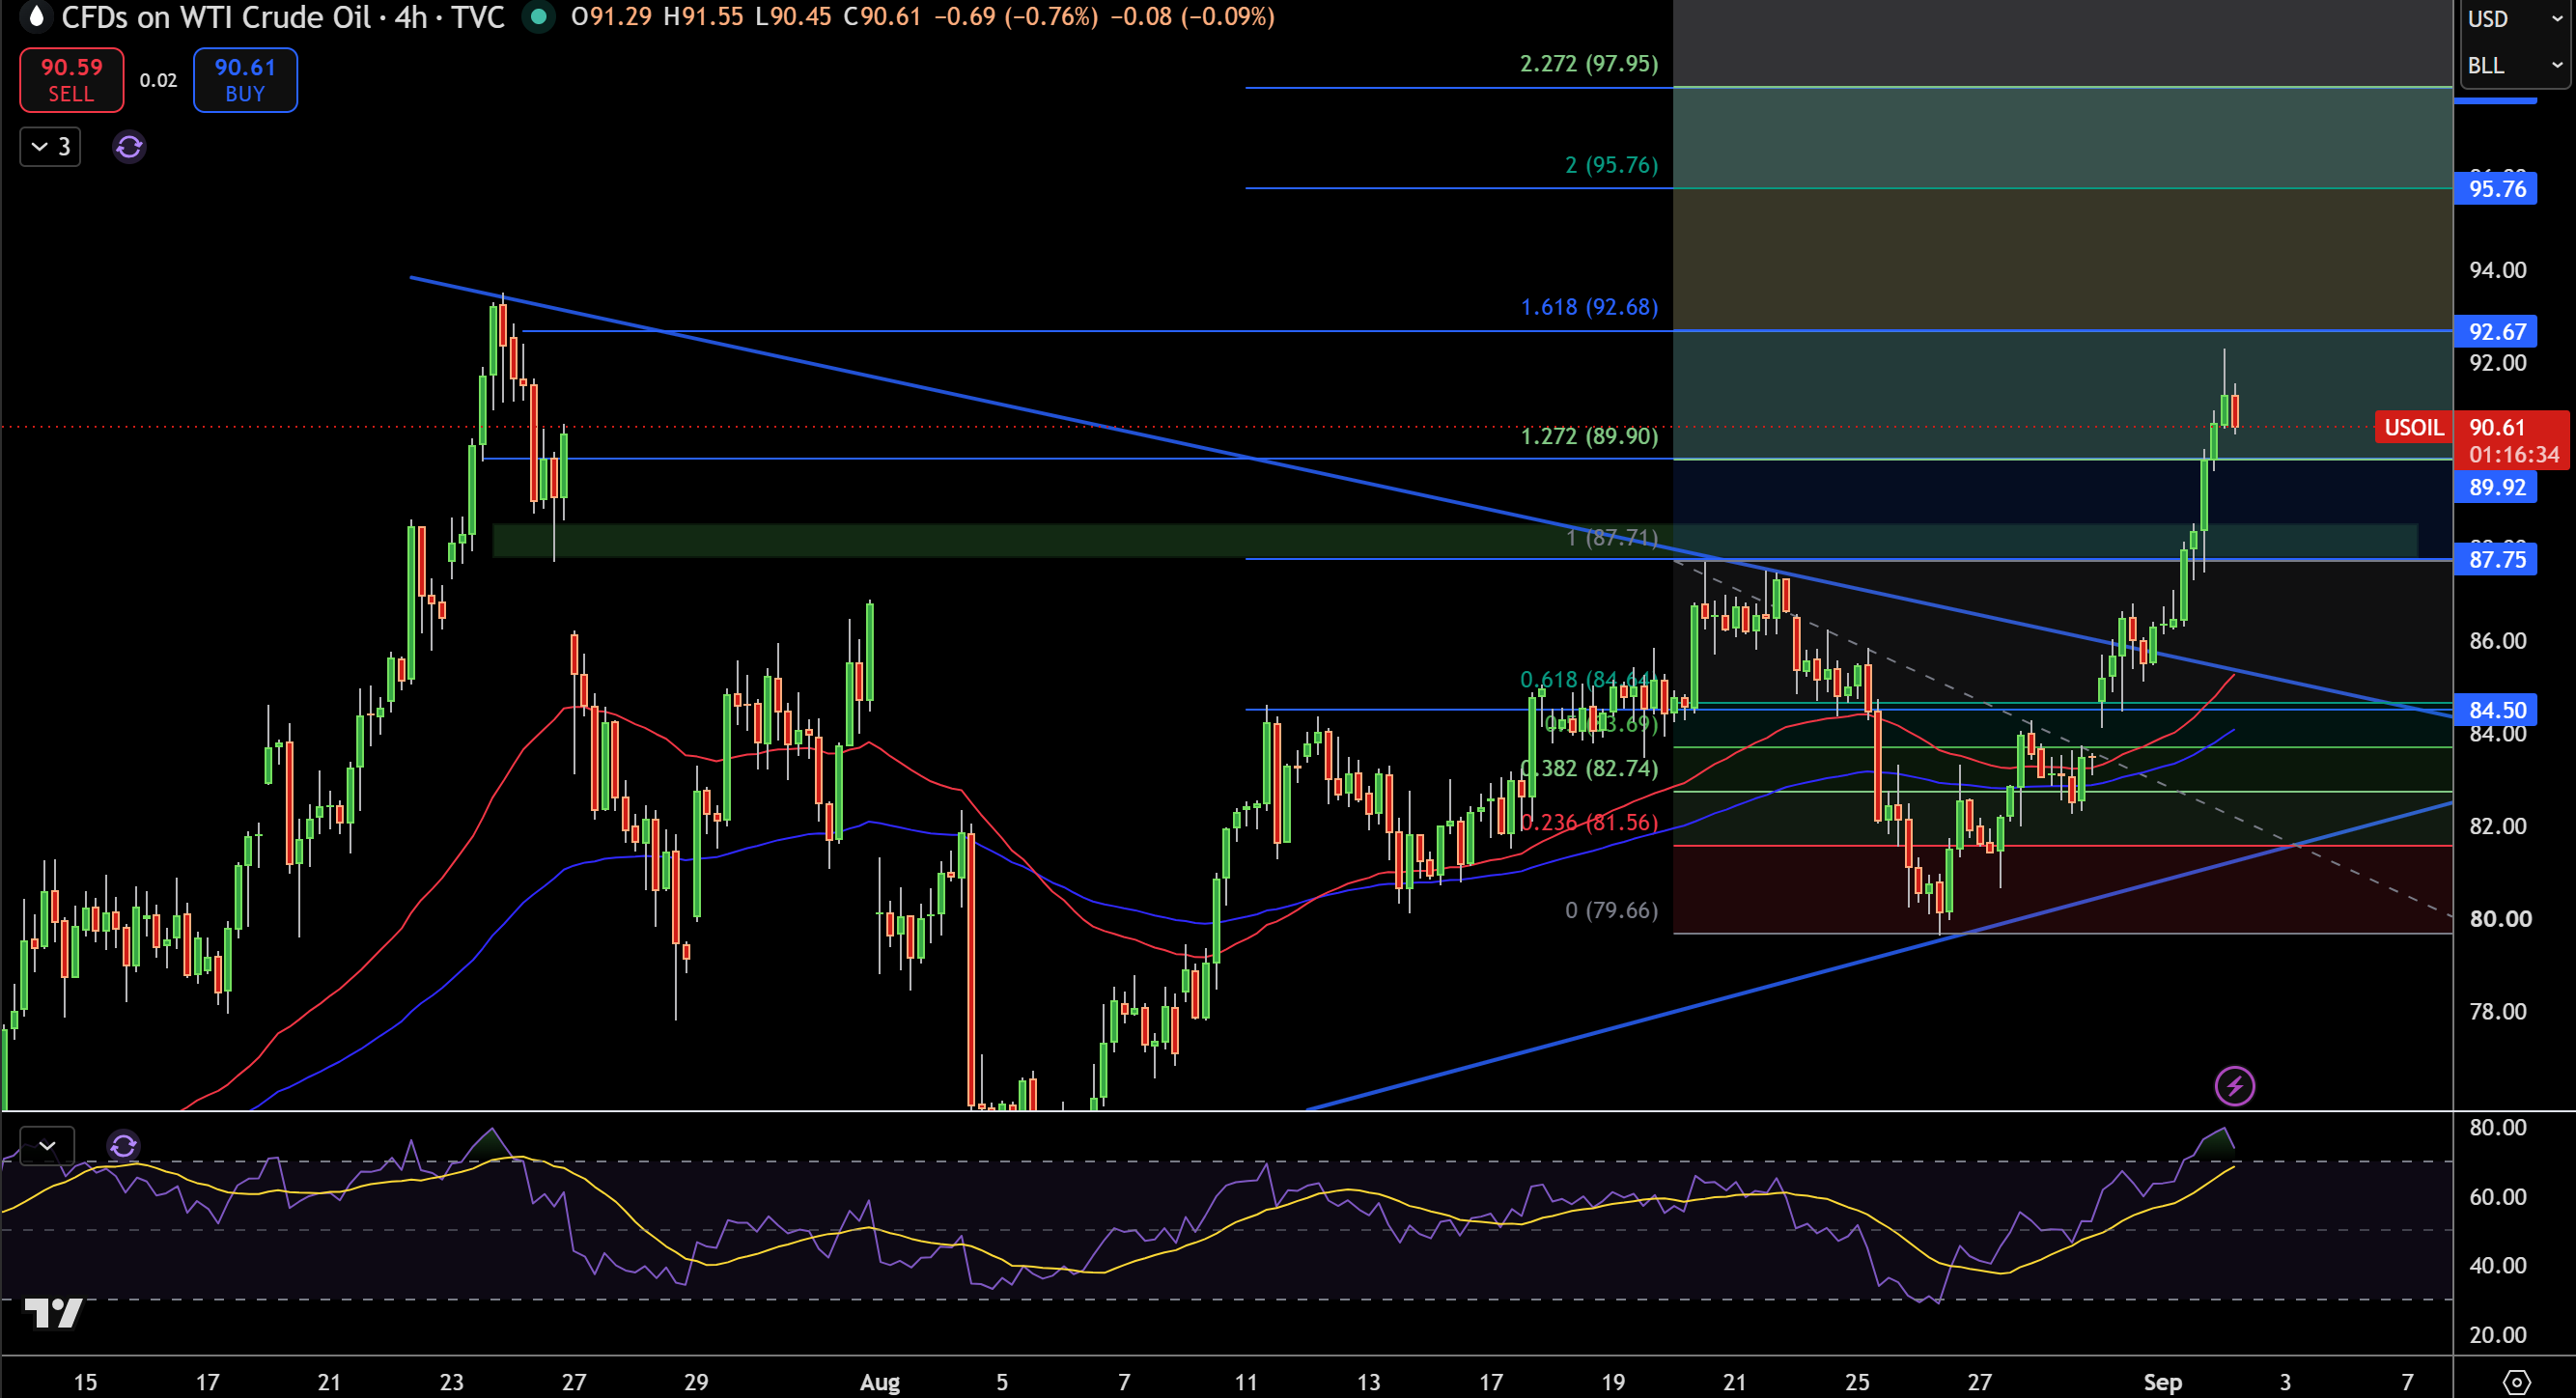
WTI crude oil currently trades around $90.61 on the 4-hour timeframe following a break above the downward trendline and the $87.75 resistance level. This break is significant as in the past price had been capped within this level many times. We can now consider the area as support, with price trading above the former resistance level.
The next resistance level can be found around $92.67 and is supported by the 1.618 Fibonacci extension level and price levels of $95.76 and $97.95. On the downside, $89.92 is the first level of support, followed by the $87.75 level. A deeper fall could have us looking at the level of $84.50, but the structure remains bullish as price trades above the breakout level.
RSI is currently in the upper 70’s, indicating strong bullish momentum for WTI crude oil, but potentially over extended and primed for a pullback. The breakout levels continue to keep the price level structures bullish, but trading at current levels exposes one to greater risk/reward. A potential pullback to $89.92/$87.75 would offer a more defined continuation trading scenario. A breakout above $92.67 would justify the level of $95.76.
Brent Crude Oil Technical Analysis: Brent Pushes Into $94.08–$96.95 Resistance as RSI Turns Overbought
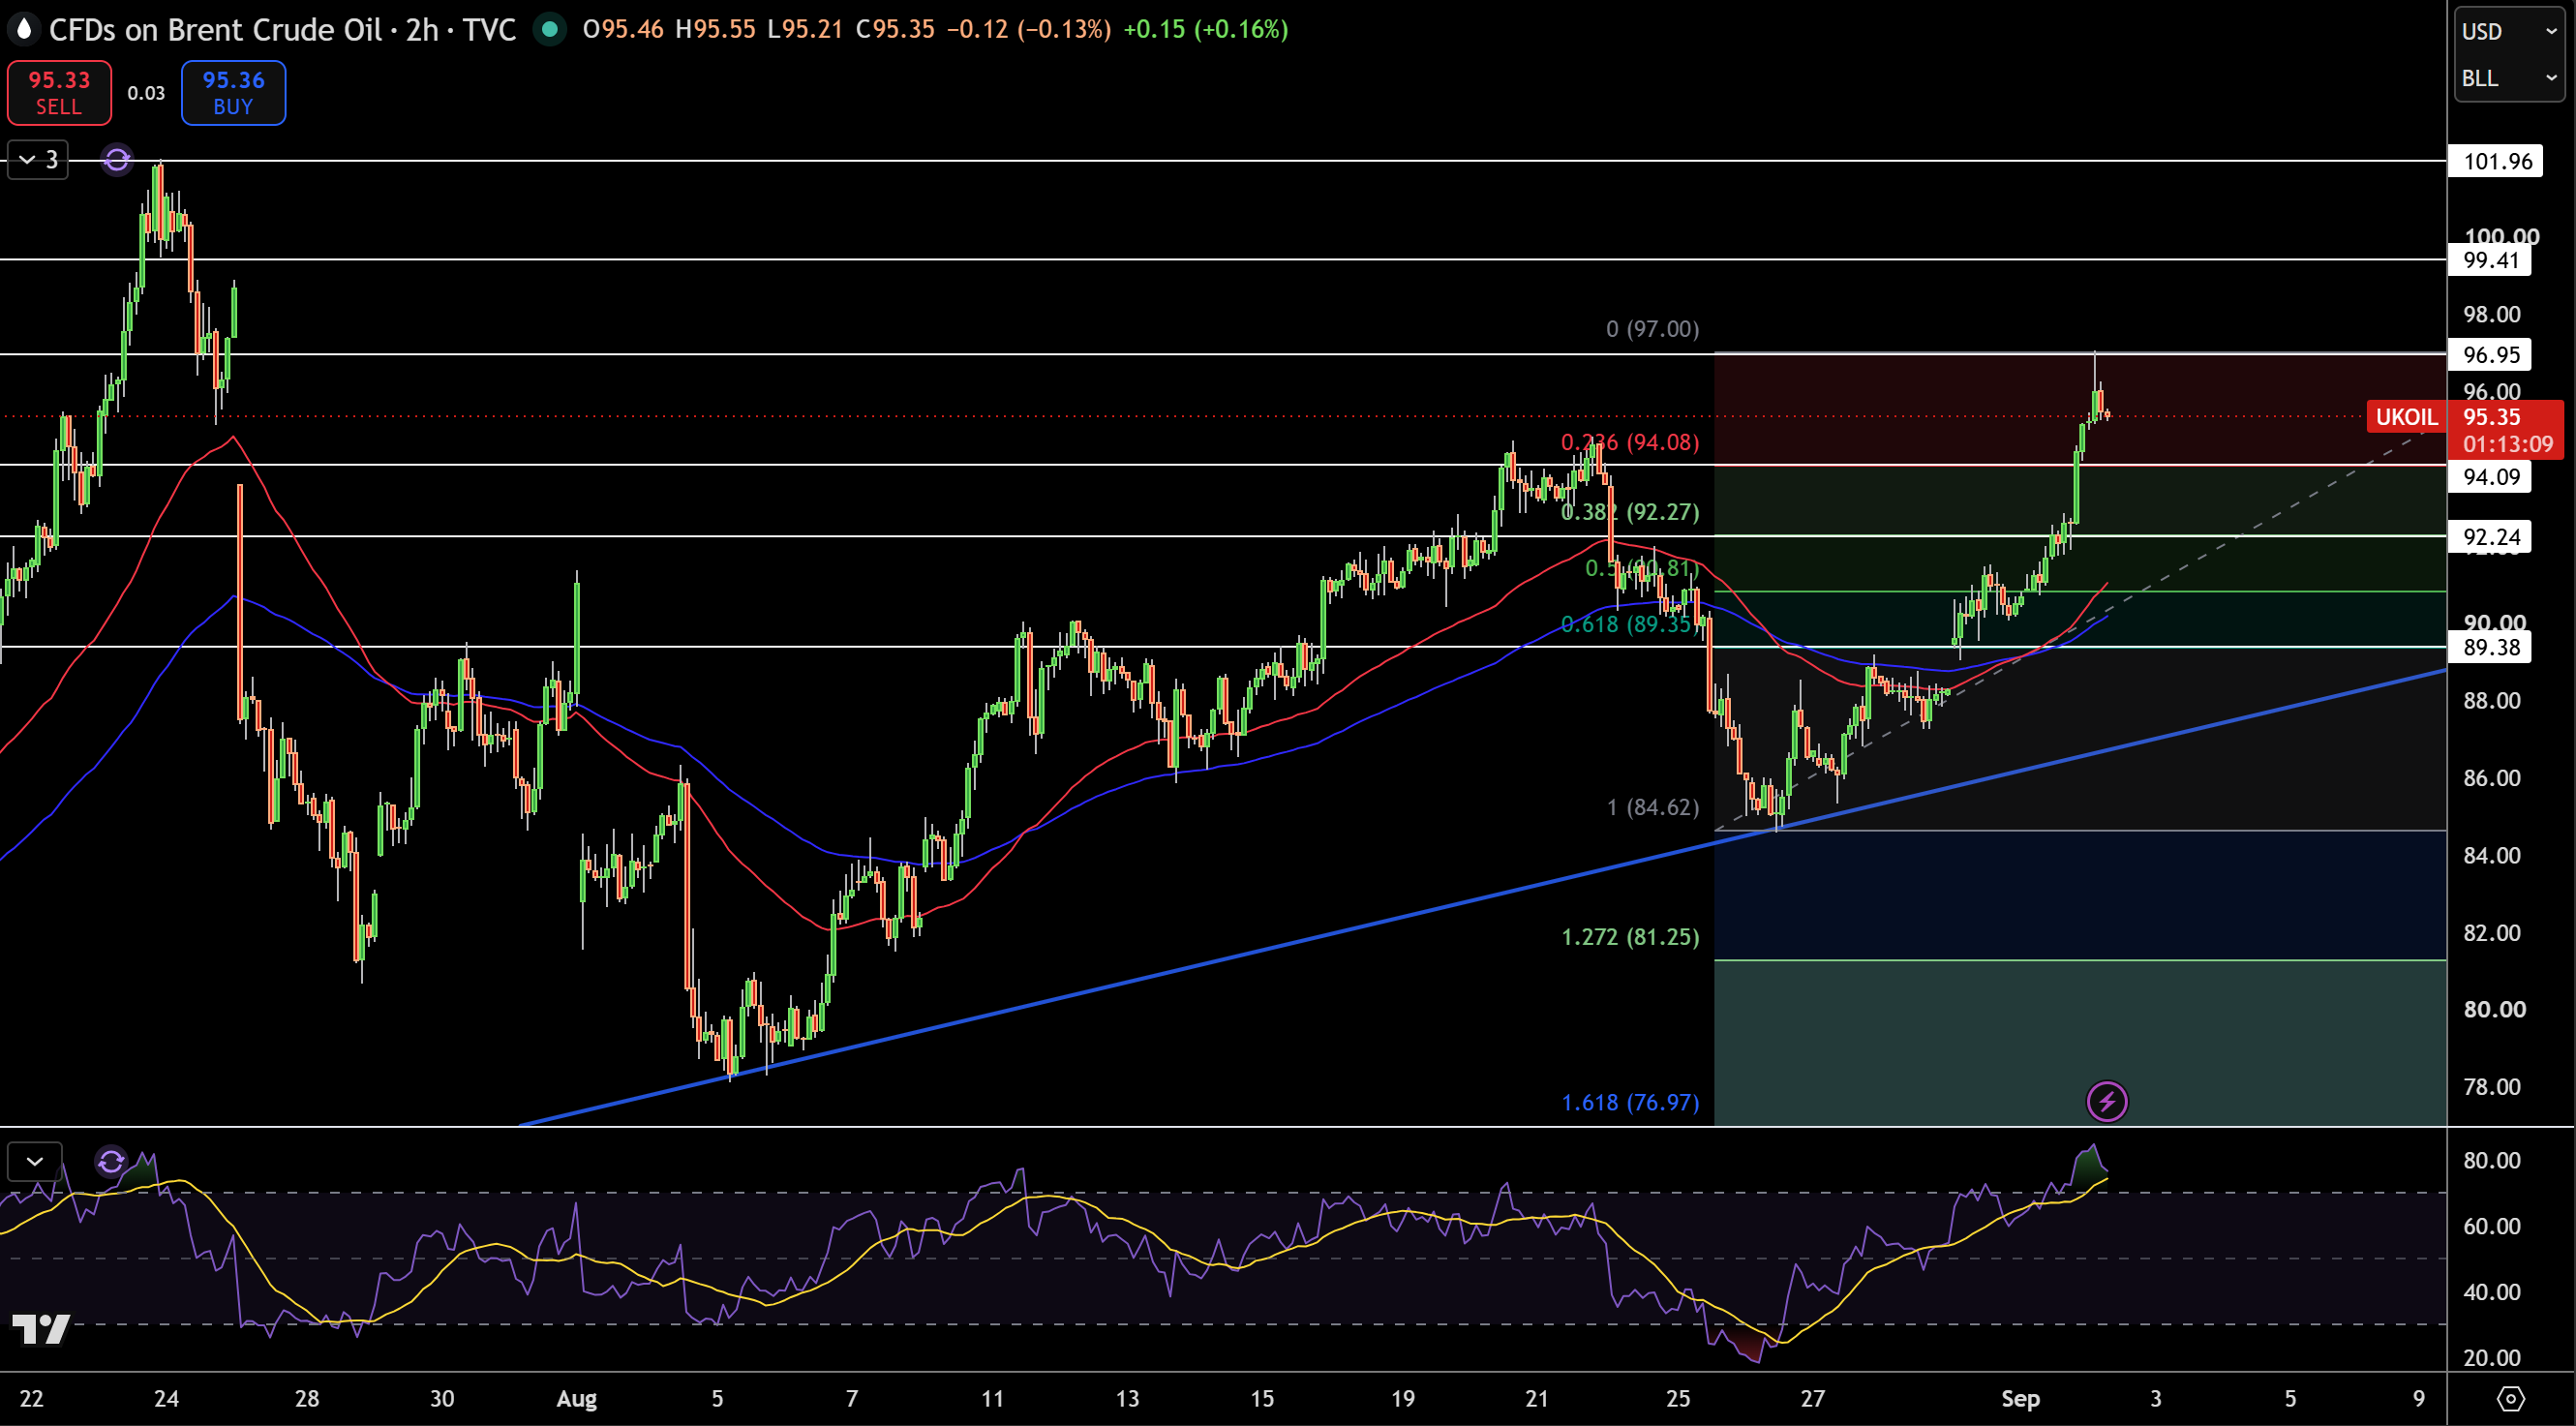
Brent crude oil trades with a $95.35 tag on the 2-hr chart with a strong recovery from the $84.62 swing bottom. Price has breached the $94.08 Fibonacci Resistance level and is now within the upper retracement zone below the swing high of $96.95. Higher lows and a rising trendline all give a bullish structure to this market.
Price likely has a lot of resistance up at $96.95 which will be followed by $99.41 and $101.96. For support we have $94.08 which will be followed by $92.27, $90.81, and $89.38. The overall bullish bias is also supported by a trendline of moving averages below the price.
RSI sitting above 70 implies that price has strong momentum. This can give price pullback opportunities. I would still maintain a bullish bias with a target of $96.95, but I would also anticipate some sell-side opportunities to reset the market structure after the recent bullish move. A break of $96.95 would open even greater bullish potential at $99.41, and for bears we would have to get back below $94.08 to light a sell signal at $92.27.