



Oil News: Hormuz Risks Clash With a Massive U.S. Crude Build
Oil markets show conflicting signals for August 12 as the likelihood of disrupted Middle East supply increases while signs point to a heavy U.S. crude build. John Bolton’s departure and the lack of U.S.-Iran dialogue modifications have been interpreted as the closing of the Strait of Hormuz. As a result, eight ships traversed the Strait on Tuesday, compared to approximately 125-140 ships on a typical day. Iran and the U.S. Houthi attacks on shipping in the region have added risk to the movement of crude and products.
The impact of the loss of supply from the Strait of Hormuz is outlined in the August 11 edition of the EIA Short-Term Energy Outlook. The EIA estimates that supply from the Strait in the second quarter averaged 4.9 million bpd, compared to an average of 21.6 million bpd in the fourth quarter of last year. Production shut-ins are estimated to average 5.5 million bpd for the month of July. Global inventories are expected to draw 3.8 million bpd this quarter.
A bearish counterweight to the global draws has already started with U.S. builds. The American Petroleum Institute (API) reported a surprise 9.1 million-barrel build of crude for the week ending August 7. Draws of 1.5 million barrels of gasoline and 596,000 barrels of distillates were reported as well. U.S. inventory data from the EIA is expected to be released later today.
As natural gas markets are moving toward being more supply dominated, the EIA expects U.S. dry gas production to reach a record high of 111.2 Bcf/d in 2026 from a previous estimate of 110.8 bcf/d. U.S. LNG exports are expected to increase from 15.1 Bcf/d in 2025 to 17.4 Bcf/d in 2026. October storage is anticipated to reach 3.98 Tcf, which would be the highest pre-winter storage levels in over a decade.

Natural Gas Technical Analysis: $2.81 Resistance Caps Recovery After Channel Breakout
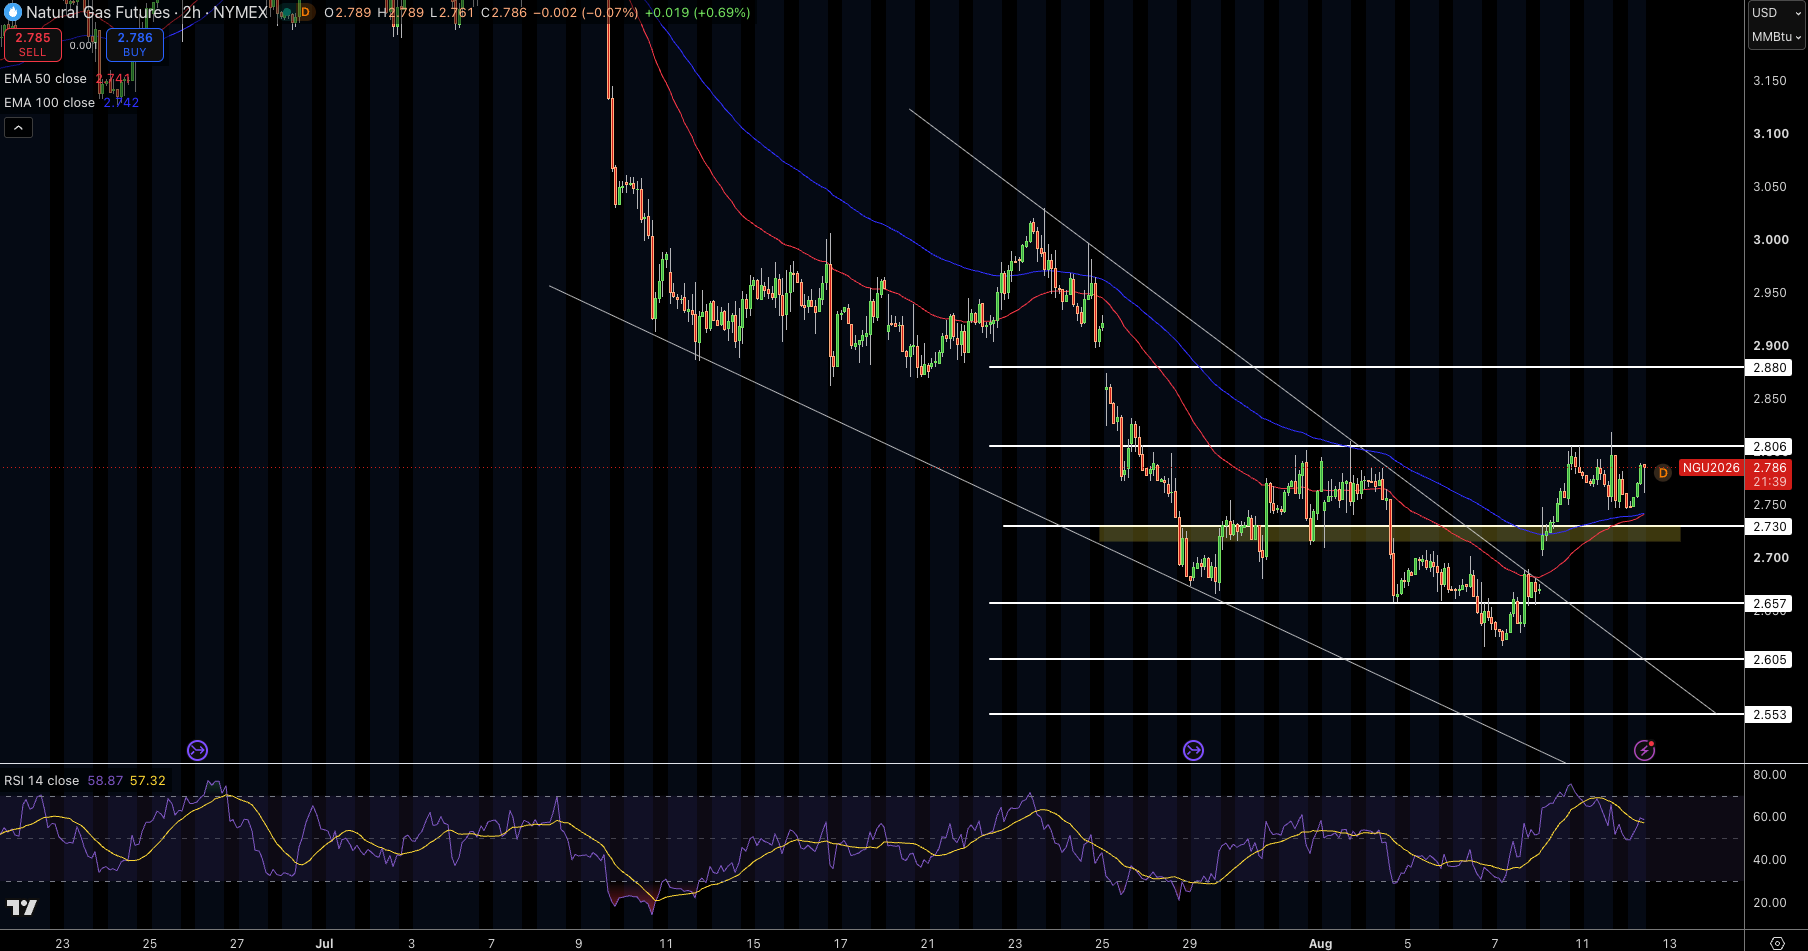
Natural gas is currently trading around $2.79, consolidating after breaking above the descending channel that had been defining price action since late July. Price has since rise above the 50-EMA at $2.74, with the 100-EMA now at $2.79 acting as resistance. Bulls are defending the breakout area and have not given back gains, which is keeping the short-term structure in place. RSI is currently at 59 and is not showing overbought conditions, particularly given the improving trend. $2.81 is the first resistance level, while $2.88 is the next resistance level.
As far as support levels are concerned, the first is at $2.73, with support at $2.66 and $2.61. Breaking above the $2.81 level would continue the recovery, and focus would shift to $2.88. Conversely, breaking back below the $2.73 level would negate the recovery. I view the $2.73 break as a continuation of the bullish bias.
Natural Gas Price Forecast
Every new Natural Gas analysis as it publishes, today's technical signal and key levels, live price — on one page.
See all Natural Gas forecastsWTI Crude Oil Technical Analysis: Breakout Above Trendline Puts $84.74 in Focus
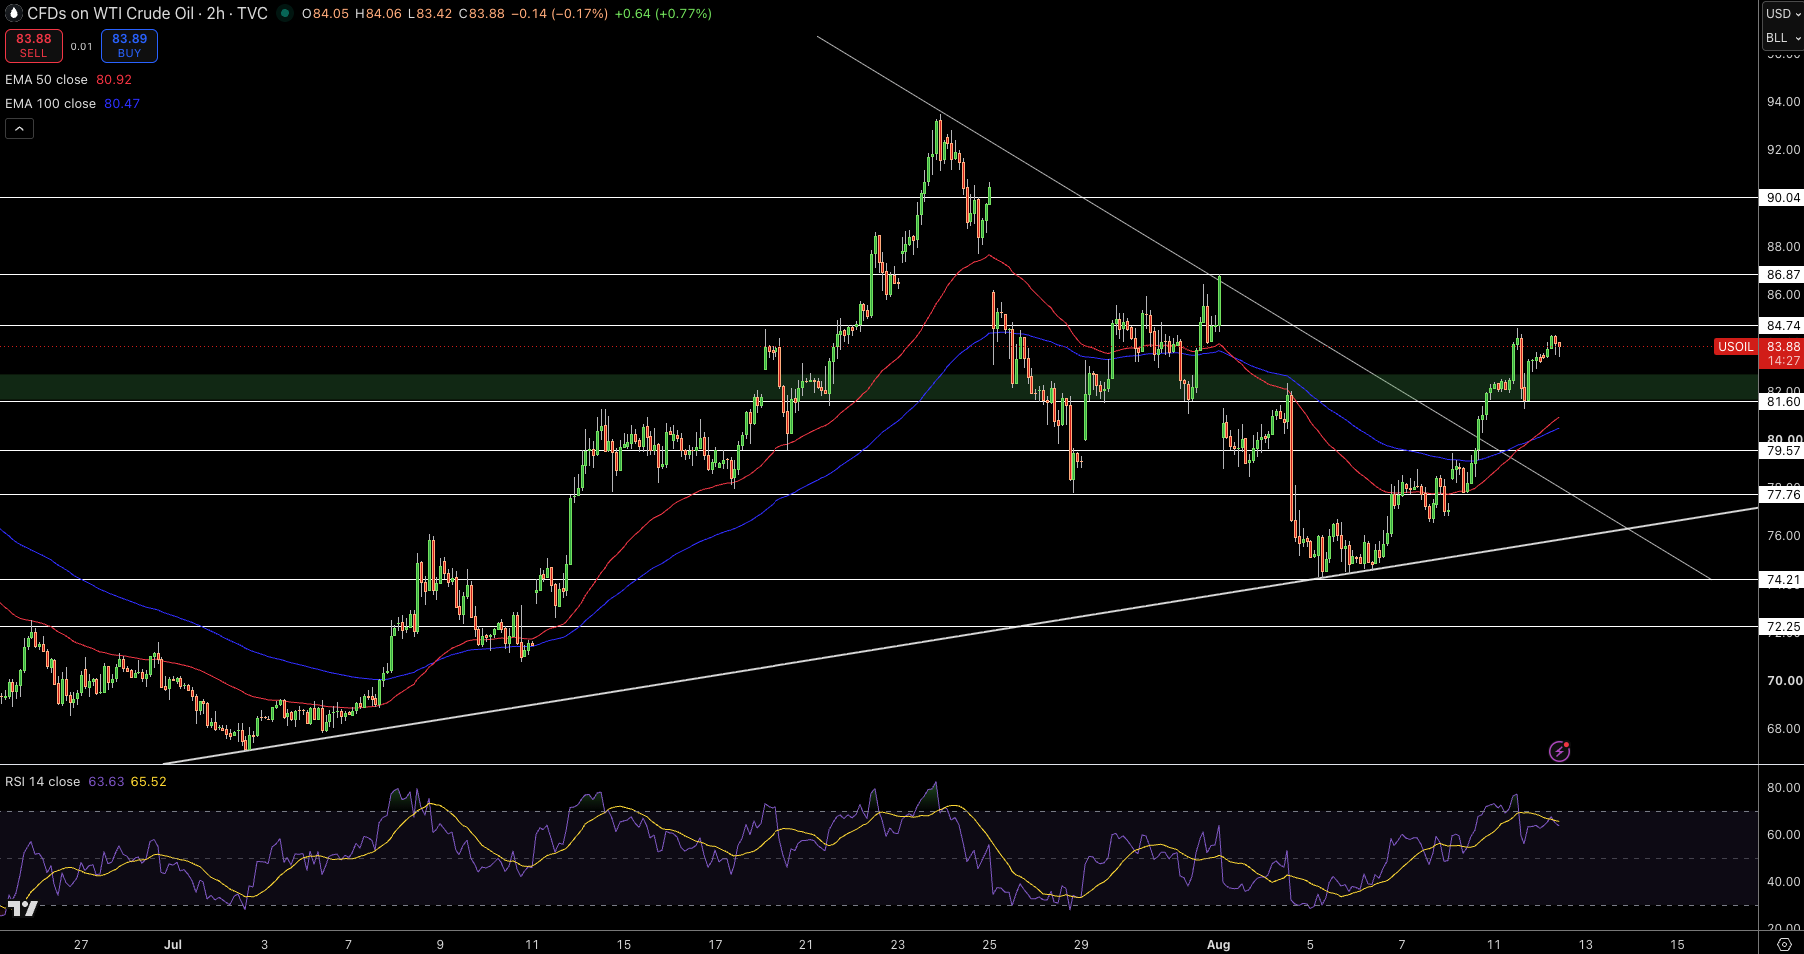
WTI Crude is trading around $83.88 and has recovered well from the $74.21 Support Area. Price is also above the 50 and 100 EMAs, signaling that short term Buyers have control of the market. The latest candles are displaying some hesitation just beneath resistance, and although WTI is above $81.60, the breakout structure is still valid.
The RSI is around 64 and indicates strong bullish momentum, but not that it is in Overbought territory. $84.74 is one of the first resistance levels that is close by, and $86.87 and $90.04 follow afterward. On the contrary, the first support is around the $81.60 level, and the EMA cluster around $80.50 seems to be a stronger support level as well as the $80.90 level. In my opinion, the $81.60 level is aIFial and active bullish structure level. Above that, a strong bullish structure level is set once price breaks $84.74.
Brent Crude Oil Technical Analysis: Bulls Hold Breakout as $91.13 Resistance Nears
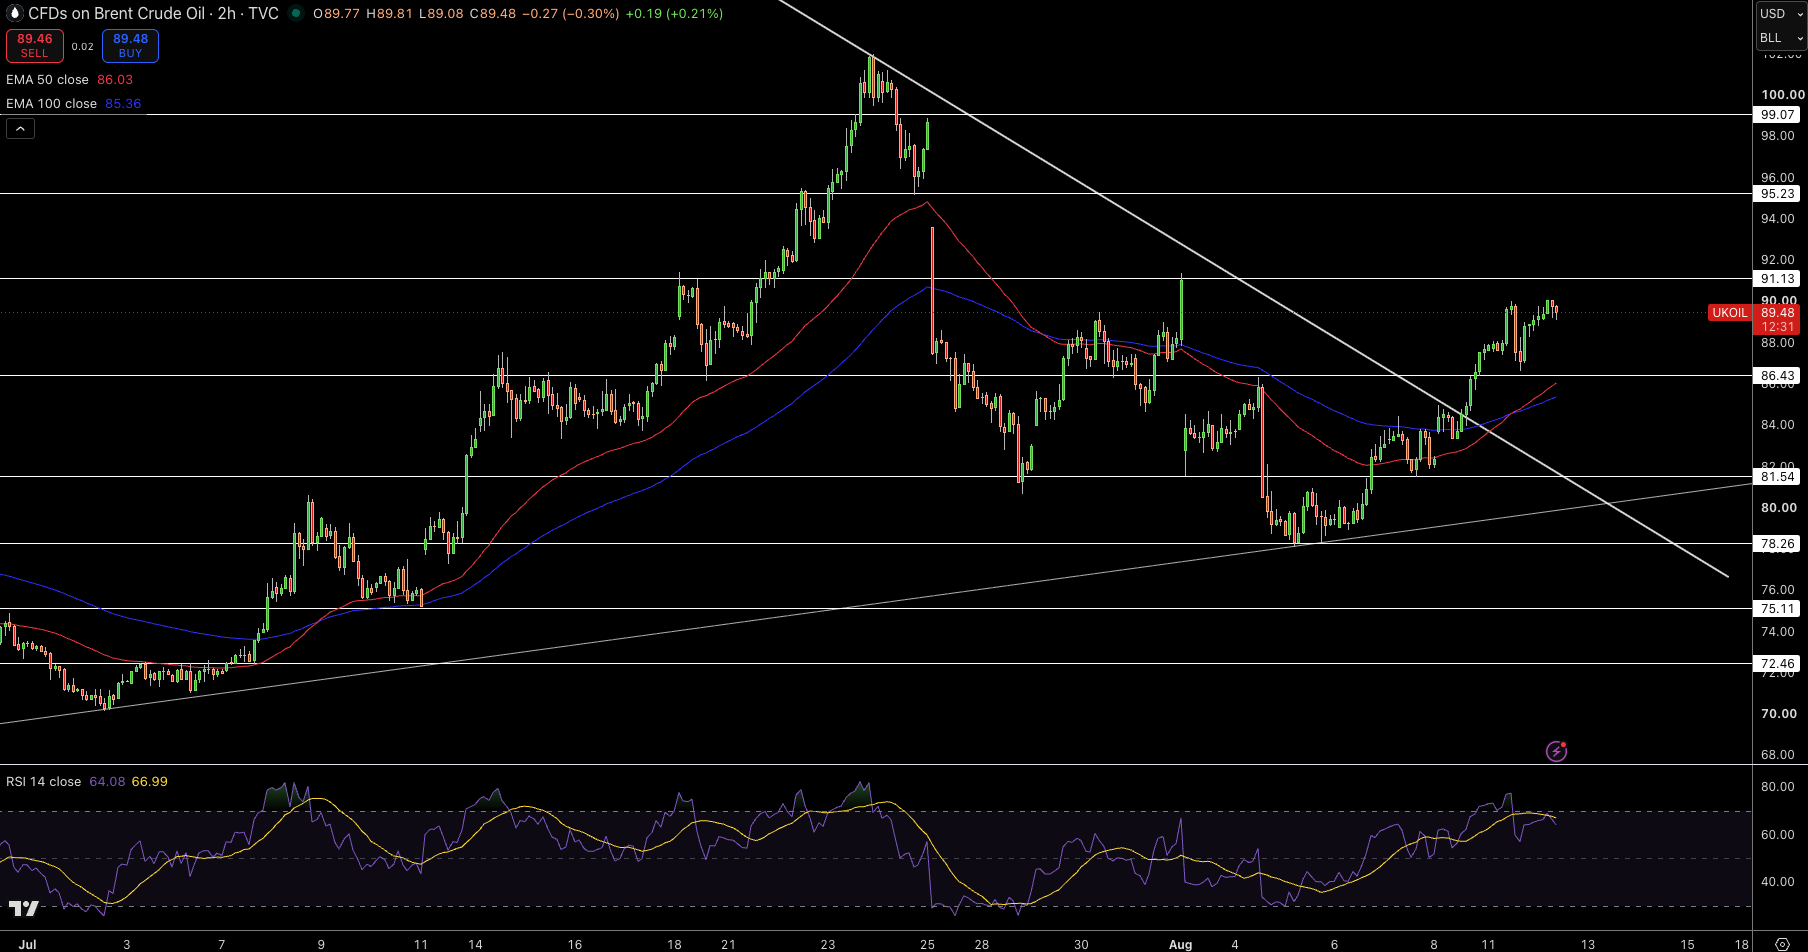
Currently, Brent Crude Oil trades at $89.48 extending its recovery after clearing the prolonged descending trendline and reclaiming both major moving averages. Currently, price is above both the 50-EMA at $86.03 and the 100-EMA at $85.36 and both act as dynamic support. The last few candles are whole within the $90 region illustrating minor profit taking after a sharp rally, however, the overall structure remains constructive.
The RSI is at 64 illustrating strong bullish momentum however, the indicator is not overbought. There is clear resistance at $91.13, $95.23 and $99.07. Support is found at $86.43. A more pronounced pull back could take price towards the $85.40-$86.00 EMA region. I am bullish on Brent Crude Oil within the range of $86.43, and a clear break of $91.13 would allow for further bullish momentum towards $95.23.


