
Natural Gas Forecast Video for 06.03.23 by Bruce Powers
Bullish monthly reversal kicks in with natural gas again rising to new trend highs. To date, it has advanced as much as 47.9% in just seven days. And it doesn’t look like it is getting ready to stop anytime soon as the week looks like it will end strong. Natural gas is on track to end the week in the top 25% of the week’s range. That is bullish by itself.

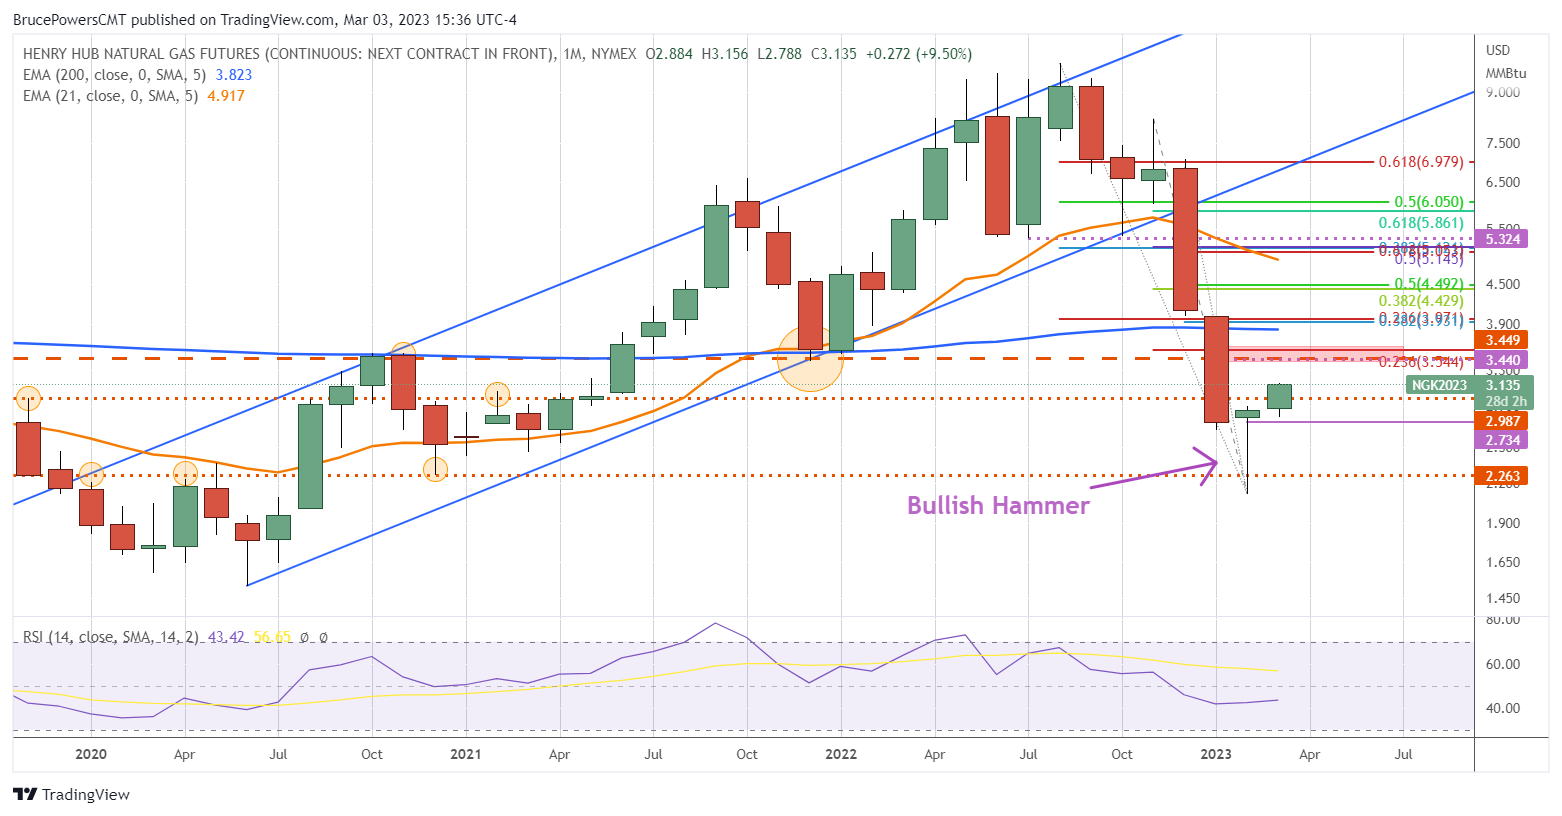
Bullish Trend Continuation Signal Confirmed on Monthly Chart
On the first day of March natural gas triggered a bullish trend continuation signal on the monthly chart. The pattern that had developed in February is a classic hammer candlestick bottom. This pattern shows sellers dominating earlier in the session (1-month) as the downtrend continues lower. Nevertheless, by the end of the month buyers were in charge driving price above the open for the month. That bullish reversal in sentiment is then expected to continue. The continuation signal is on a daily close above the high for the month. February’s high was 2.90, which was triggered on the first day of March.
In technical analysis, the larger the time frame of the analysis you are looking at, the potentially more significant. Given today’s bullish follow through, plus the daily close above 2.90 that occurred on Wednesday, natural gas is indicating a significant bullish reversal. Momentum is bullish with higher prices likely.
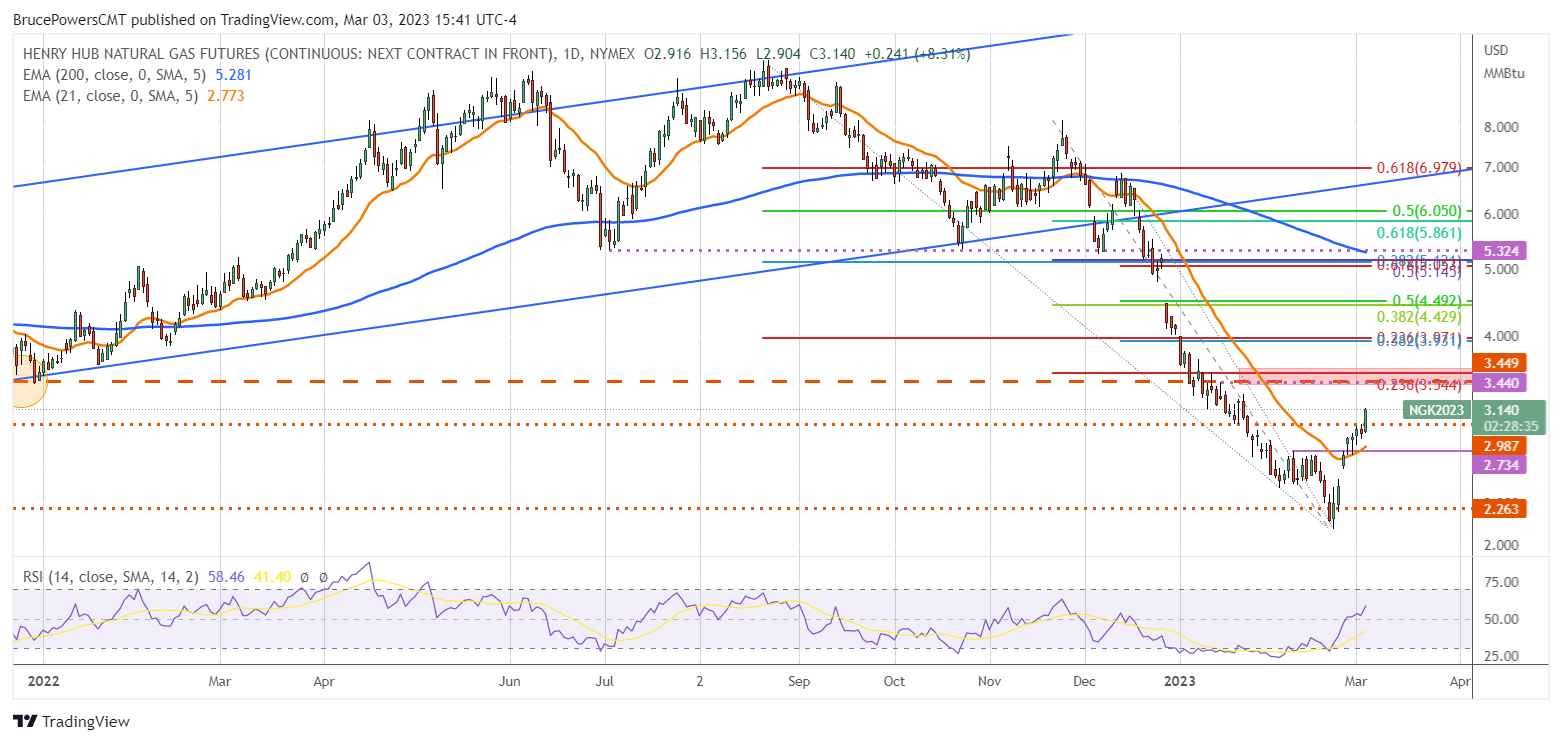
Next Target Zone is 3.42 to 3.55
The next target zone is from around 3.42 to 3.55, consisting of previous price structure (swing lows/highs), plus the 23.6% Fibonacci retracement of the internal trend. The internal trend starts from November 23, swing high of 8.18. Higher potential target areas are shown on the chart as well. There are several Fibonacci confluence zones, some of which correlate with prior price action.
Short-term Weakness Can Offer New Entry Signals
Given the above, until we get to the next target zone short-term weakness can be watched for new entry signals in anticipation of a bullish continuation. Near-term support is now around the prior trend high of 2.85. That was a first target for natural gas previously identified by price structure of swing lows and highs, plus monthly support, or resistance levels.
For a look at all of today’s economic events, check out our economic calendar.