
Nearby Gas Falls on Cooler Forecasts but February Holds Its Ground
Nearby natural gas futures dropped Friday as the weather forecast backed off the heat and the storage surplus kept sellers in control of the front end of the curve. August fell 1.54% and September lost 1.10%. February 2027 finished slightly higher at $3.904 and that split between the prompt months and the winter contract is the story heading into next week.
August Nymex natural gas settled at $2.871, down $0.045 or -1.54%. September finished at $2.888, down $0.032 or -1.10%. February 2027 settled at $3.904, up $0.006 or +0.15%.
The front end is trading a storage surplus that has shut down every rally this summer. The back end is trading the winter question and the Super El Niño risk that could make or break heating demand. Friday showed the market is not selling both of those stories with the same conviction.

February Futures are Not Following August Lower
February settled slightly higher Friday while August and September dropped. The Super El Niño outlook is bearish for winter heating demand but that outcome is still months away and the contract is holding a premium because the market cannot fully discount cold risk this far out. Friday’s intraday surge to $3.983 showed buyers are still willing to test the upside even after sellers stepped in at the 50-day average.
EIA Storage Surplus Caps Every Rally
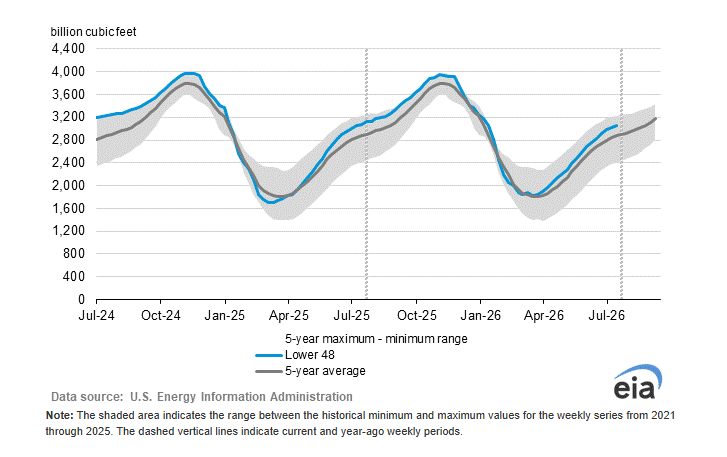
The EIA reported a 32 Bcf injection for the week ending July 17, slightly below the 34 Bcf estimate but still above the five-year average build of 30 Bcf. Working gas inventories are running 6.4% above the five-year seasonal average. The build was much smaller than the 61 Bcf injection earlier this month, which shows summer burn is doing some work, but the surplus has shut down every weather rally this summer and Friday was no different.
LNG flows to U.S. export terminals rose to 18.2 Bcf per day Friday, up 3.7% from the prior week. Electricity output rose 2.0% from a year ago in the week ending July 18. European storage was only 54% full as of July 20 against a five-year average near 70%. Those factors are keeping the deferred contracts from breaking down with the front end but they are not enough to change the nearby math.
Natural Gas Price Forecast
Every new Natural Gas analysis as it publishes, today's technical signal and key levels, live price — on one page.
See all Natural Gas forecastsCooler Forecasts Took Away the Summer Bid
The Commodity Weather Group still expects above-average temperatures in the interior West through August 7 but the outlook turned cooler than previously expected. That was enough to pressure August and September when the market is already sitting on a surplus. Texas and the West can support power demand on their own but this market needs broad persistent heat across the Midwest and Northeast to change the national balance and the forecast is not delivering that.
Lower-48 gas demand was estimated at 77.6 Bcf per day Friday, down 6.5% from a year ago. Production hit 111.6 Bcf per day, up 2.9% from a year earlier. That gap is why the front end cannot hold a rally.
Daily Nearby Natural Gas Futures
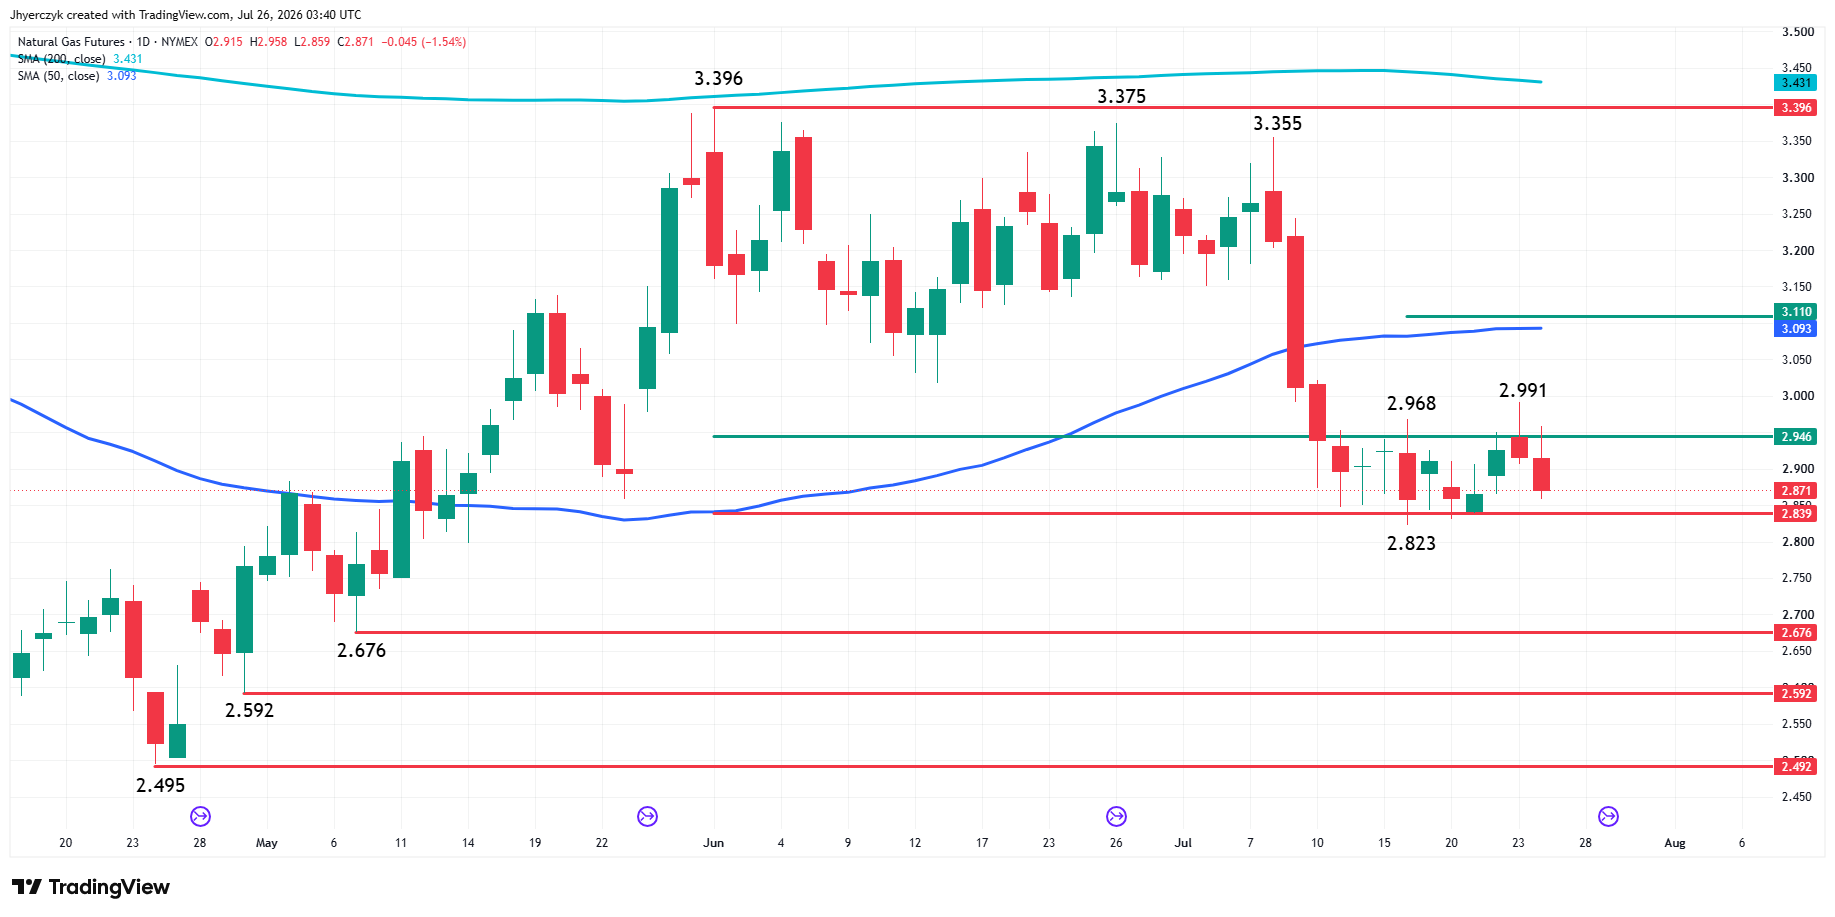
Nearby natural gas settled lower on Friday and inside a retracement zone at $2.946 to $2.839. The zone was formed by the April 24 main bottom at $2.492 and the June 1 main top at $3.396. Trader reaction to this zone is likely to determine the near-term direction of nearby natural gas.
On the bullish side, a sustained move over $2.946 will indicate the presence of buyers. Taking out the minor top at $2.991 would reinforce that signal. If this creates enough upside momentum then look for a potential surge into the 50-day moving average at $3.093 and the long-term 50% level at $3.110.
On the bearish side, a sustained move under $2.839 will signal the presence of sellers. A trade through the July 16 main bottom at $2.823 will indicate the selling is getting stronger. This could extend the selling further with the May 7 main bottom at $2.676 a potential downside target.
Daily August Natural Gas Futures
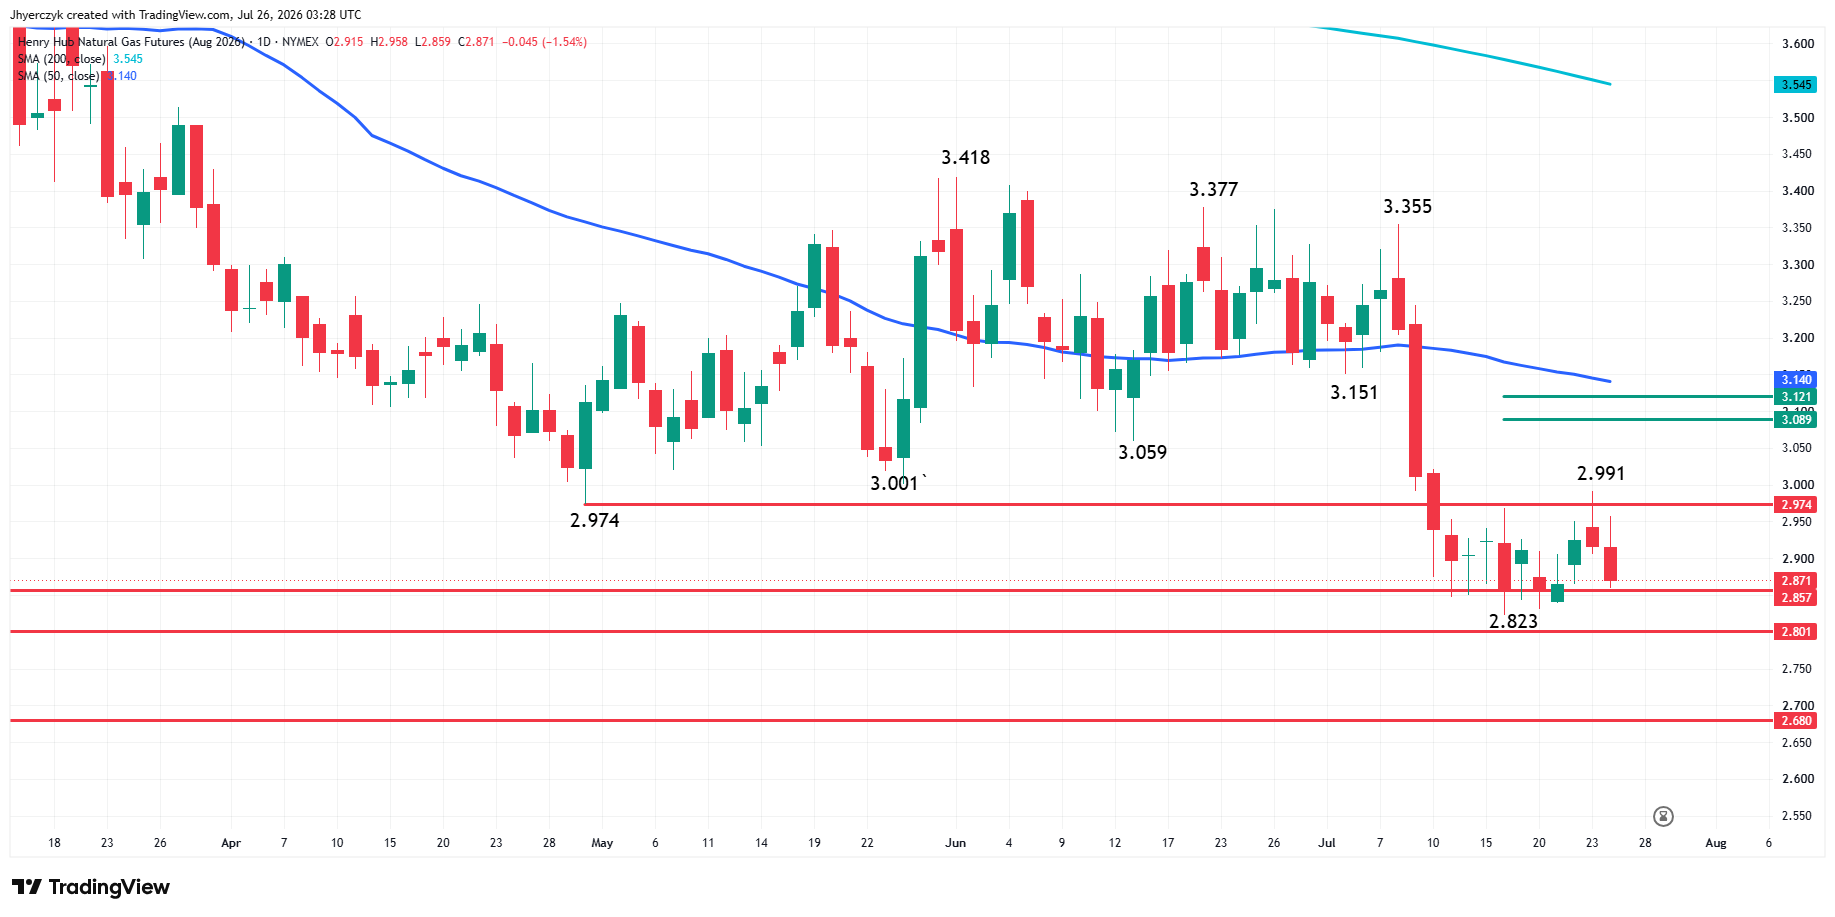
August natural gas is currently trading at the lower end of the $2.823 to $2.991 short-term range. A former long-term bottom at $2.857 may be providing some support. Another long-term bottom at $2.801 may have encouraged buyers to step in at $2.823 on July 16. If $2.801 fails as support, prices could weaken considerably given the next long-term target at $2.680.
On the upside, a sustained move over $2.991 will indicate the return of buyers. If this move can create enough upside momentum then a pair of 50% levels at $3.089 and $3.121 are likely to become the next upside targets. Slightly above this area is the 50-day moving average at $3.140.
Daily September Natural Gas Futures
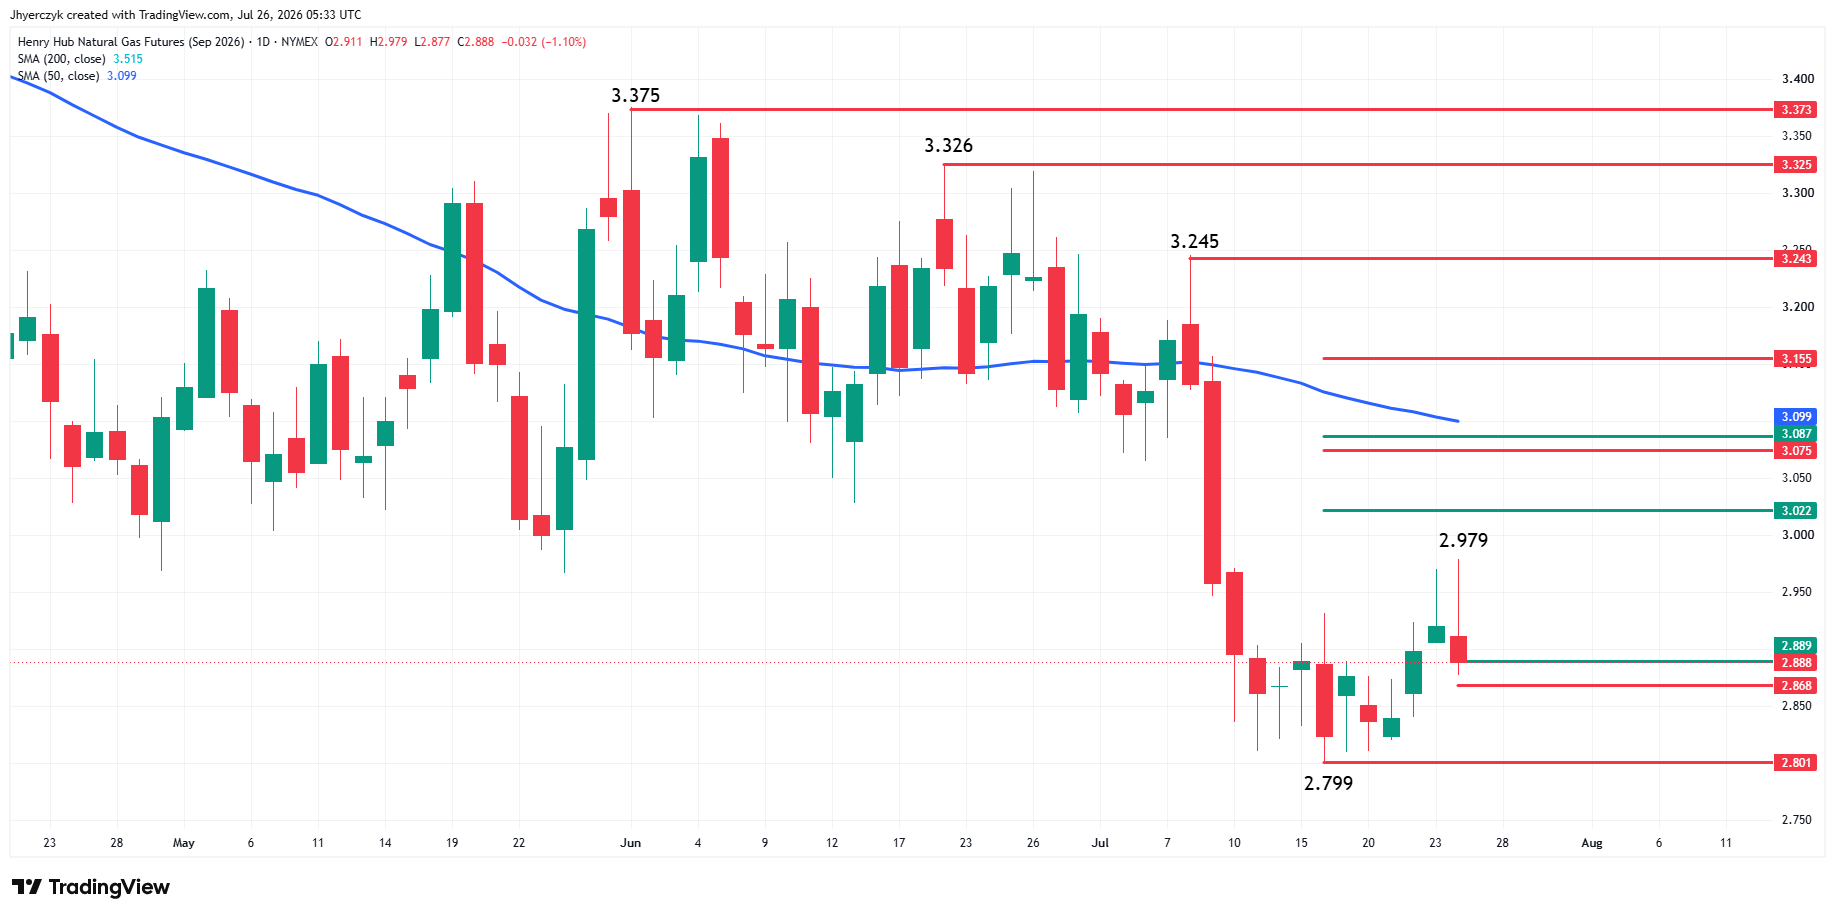
September natural gas futures are in a long-term downtrend, but the short-term outlook is taking on a slightly more bullish aspect. I suspect anticipated LNG demand has been helping underpin the market since late April, while seasonal traders remain reluctant to press shorts against the risk of a heat dome. Storage levels, however, remain the key factor capping gains.
The short-term range is $2.799 to $2.979. Its retracement zone at $2.889 to $2.868 is currently being tested. Trader reaction to this zone is likely to determine the near-term direction. Generally speaking, bullish traders are likely going to try to establish a secondary higher bottom inside this zone. Bearish traders are likely going to try to resume the downtrend with an assault on the main bottom at $2.799.
If support is found and buyers return, the most obvious upside target is the minor top at $2.979. Taking out this level will be constructive, but buyers are still likely to face a number of headwinds including a 50% level at $3.022, a 61.8% level at $3.075, another 50% level at $3.087 and the 50-day moving average at $3.099. That’s a lot of layers to go through before we can even consider a change in the long-term trend.
Daily February Natural Gas Futures
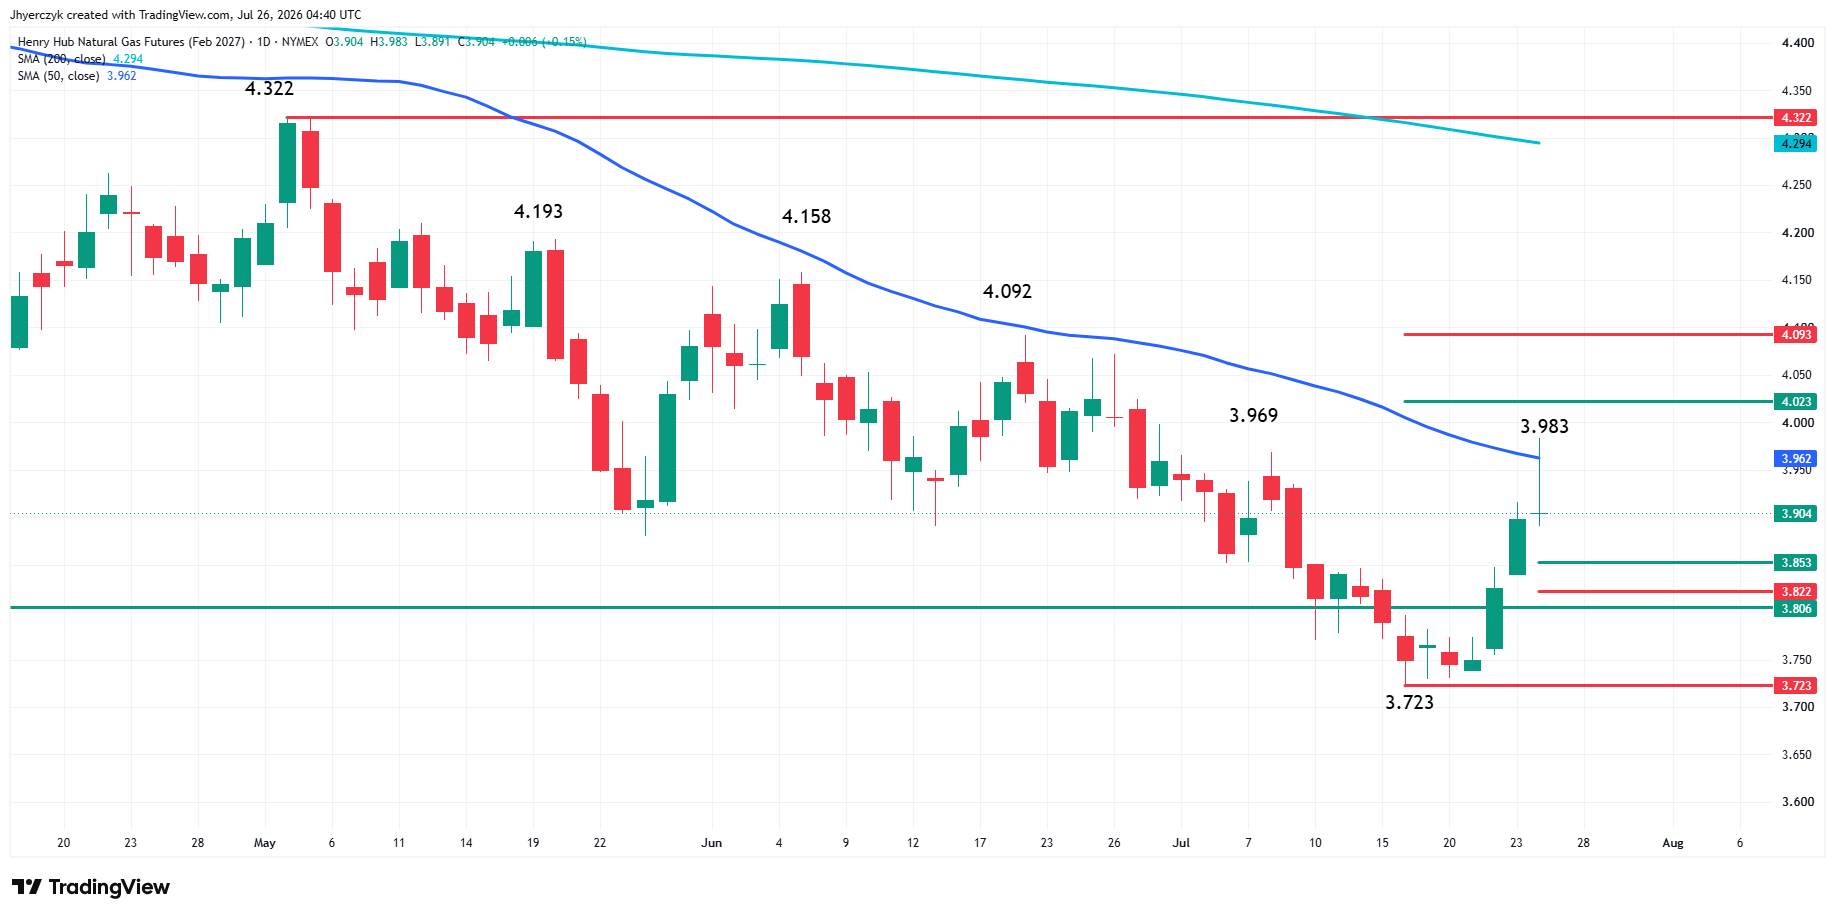
Friday’s trading range was wide, but February natural gas opened and settled near $3.904 after an intraday surge to $3.983 failed to hold. The long upper shadow shows sellers stepped in after the market crossed the 50-day moving average at $3.962.
The new short-term retracement zone is $3.723 to $3.983. Its retracement zone at $3.853 to $3.822 is the nearest downside target. On a test of this zone, new buyers are going to try to create a secondary higher bottom. Sellers are going to try to produce a new lower main top at $3.983 by driving prices through this retracement zone and towards the $3.723 main bottom.
What to Watch
The next weather updates decide whether nearby gas stabilizes or breaks the bottom of the range. Bulls need the heat to strengthen and spread east. Sellers need the cooler breaks to keep returning across the highest-population demand regions. The storage surplus gives sellers the edge on every rally attempt and production above 111 Bcf per day is not helping the bulls.
February is the contract to watch for a different signal. The prompt months are trading loose supply. The winter contract is trading uncertainty and as long as it holds up better than August and September, the curve is telling you the market has not given up on the possibility that the winter story changes before the heating season arrives.
More Information in our Economic Calendar.