
Storage Build Keeps Natural Gas Pinned Near the Lows
Natural gas hit a new multi-month low Thursday and the small bounce Friday morning does not change who is in control.
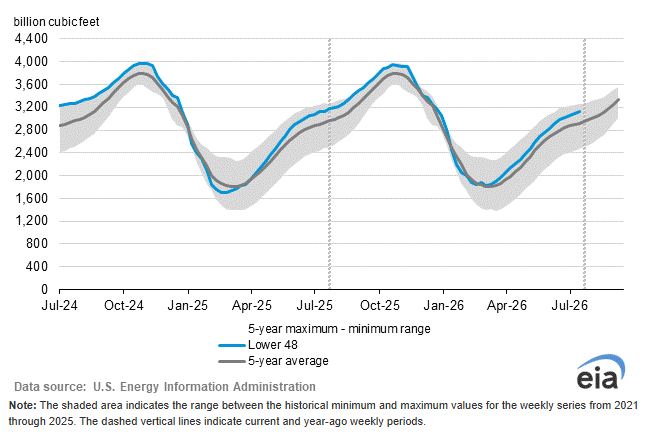
The EIA reported a 33 Bcf build for the week ended July 31, above the 30 Bcf estimate and well above the five-year average of 23 Bcf. Inventories are now 6.7% above the five-year seasonal average.
The heat forecast is turning hotter across the Northeast and West. The storage data says it has not mattered yet. The contract is in a downtrend on the swing chart and the 50-day moving average is a long way overhead.
September natural gas futures are trading $2.643, up $0.003 or 0.11% at 12:00 GMT.

Daily September Natural Gas Futures Technical Analysis
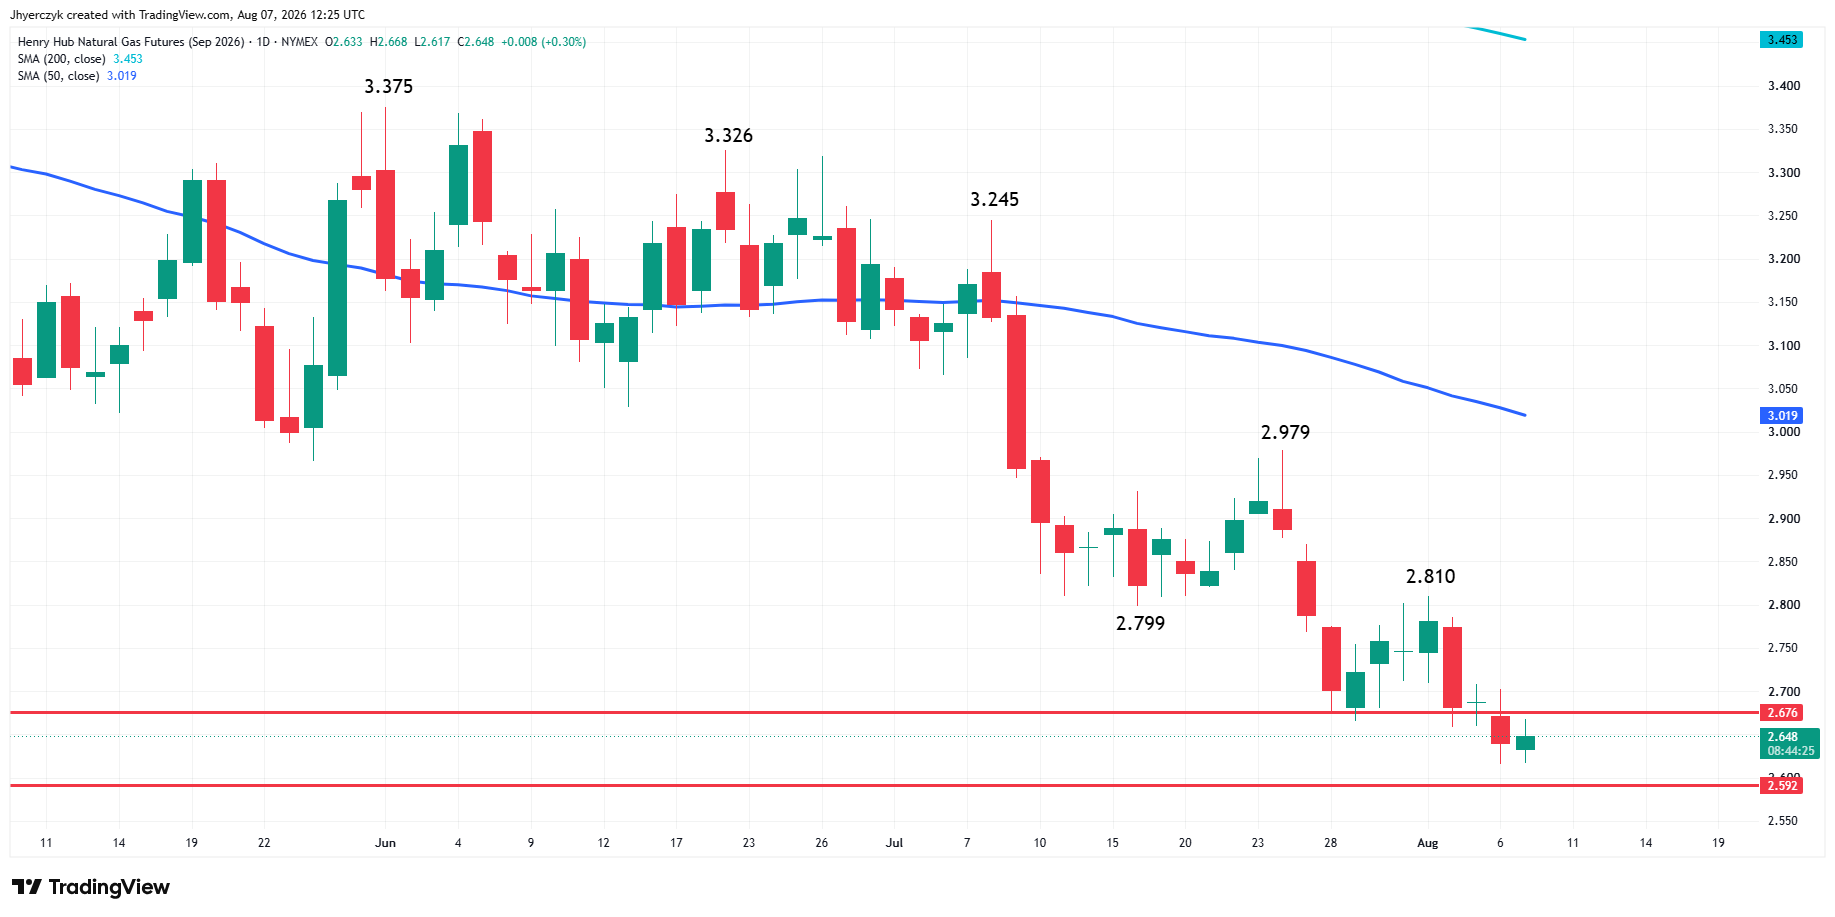
September natural gas futures are treading water on Friday after hitting a multi-month low the previous session. The main trend is down according to the daily swing chart and the 50-day moving average at $3.019. A trade through the main top at $2.810 will change the trend to up, while a move through $2.616 reaffirms the downtrend. The next potential downside target is another multi-month bottom at $2.592.
Given the prolonged move down in terms of price and time, one could say the market is due for a potentially bullish closing price reversal bottom. If formed and confirmed, it won’t change the trend, but it could alleviate some of the downside pressure with a shift in momentum.
Even if there is a demand-driven rally from current price levels, the bears will still be in control with potential headwinds at a series of retracement zones, swing tops and moving averages.
Natural Gas Price Forecast
Every new Natural Gas analysis as it publishes, today's technical signal and key levels, live price — on one page.
See all Natural Gas forecastsHot Forecast Could Not Overcome the Storage Number
NatGasWeather sees most of the country running hot to very hot over the next seven days with highs in the upper 80s to 110s. That should lift cooling demand and gas-fired power burn. The storage report stopped the bid before it could build. A 33 Bcf injection landed while the contract is already in a downtrend with inventories above normal and more Permian supply headed to Henry Hub next month.
Cash prices gave the same signal. Physical gas weakened for Friday delivery with heavy losses in New England erasing the prior session’s weather premium. Heat showed up on the forecast. It did not produce the kind of demand stress that forces buyers to chase futures higher. The market is treating this heat as temporary until it holds across the Midwest and Northeast long enough to change storage math.
Supply Keeps Adding Weight
Production was 111.2 Bcf per day Thursday, up 1.8% from a year ago. The rig count at 127 is below February’s high but still enough to keep output elevated. Production does not have to surge for prices to struggle. It just has to stay near current levels while storage keeps building above average.
The Hugh Brinson pipeline reaching full capacity at 1.5 Bcf per day on September 1 makes the calendar worse for buyers. More Permian gas arrives at Henry Hub just as the summer cooling season starts to fade. The supply side is getting heavier at exactly the point when demand normally starts losing its grip.
LNG Feedgas Is Climbing but Not Fast Enough
Feedgas hit 18.5 Bcf per day Thursday, up 3.3% from the prior week. European storage at 58% full as of August 4 is well below the five-year average of 74% heading into winter. The export bid is real.
Lower-48 gas demand was 83.2 Bcf per day, up 7.5% from a year ago. Power output rose 0.9% in the week ended August 1. Demand is not collapsing. The problem is supply remains heavy enough to absorb it without tightening the balance.
The contract needs feedgas to keep climbing after maintenance ends and needs the heat to hold over the population centers in the East. One without the other is not enough to change the direction.
What to Watch
The storage surplus is getting wider, not narrower. A 33 Bcf build against a five-year average of 23 Bcf tells you that the heat has not tightened the balance yet. Production near 111 Bcf per day with another 1.5 Bcf of Permian pipeline capacity arriving next month keeps the supply side heavy. Buyers need the hot forecast to verify across the Northeast and Midwest, feedgas to keep rising and cash prices to stop giving back weather premiums the day after they appear.
The downtrend is intact and the 50-day moving average is nearly 40 cents overhead with multiple swing tops and retracement zones standing in the way. Even a demand-driven rally runs into sellers at every level on the way up. The market may be due for a closing price reversal bottom after this long a move down, but that shifts momentum without changing the trend. Rallies are selling opportunities until the storage data and the weather start telling the same story.
More Information in our Economic Calendar.