Resistance Rejection Sets the Tone
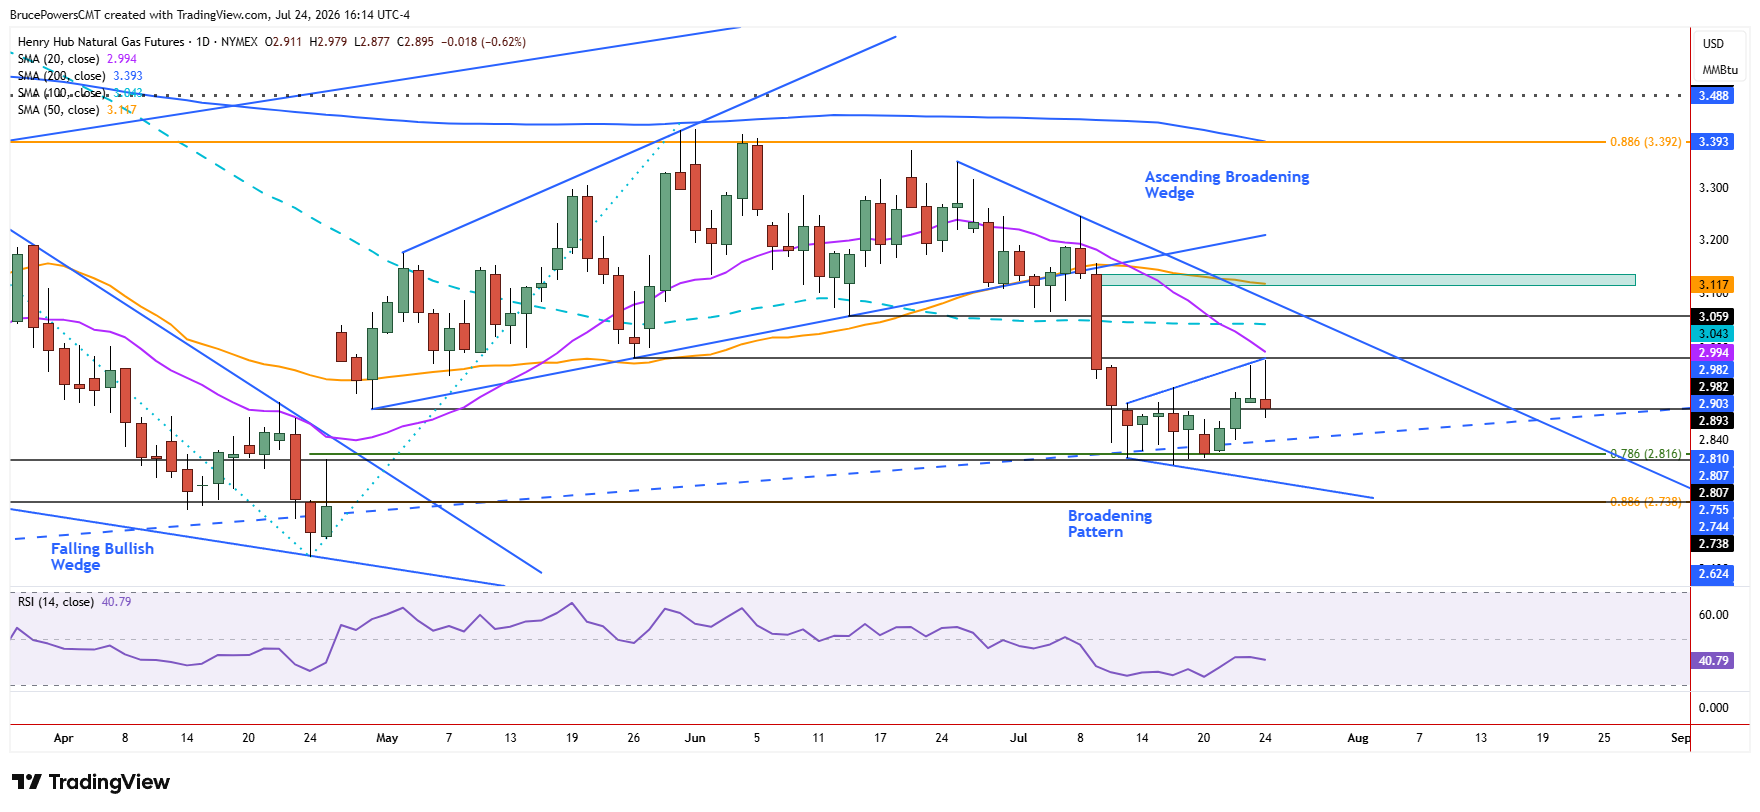
Natural gas strengthened and expanded its recent range to an 11-day high of $2.98 during Friday’s session, before once again encountering resistance near the upper boundary of a small broadening pattern. The session’s high was also a more precise test of resistance at the prior support level seen at the $2.98 low in May. That prior support zone has now been confirmed as a resistance area, with a subsequent decline triggering a one-day bearish reversal to a low of $2.88, at time of writing. The repeated failure to sustain gains near $2.98 reinforces the importance of this resistance zone and sets the stage for the next directional move.

20-Day Moving Average Remains a Barrier
Also of significance is the falling 20-day moving average at $2.99. It will soon converge with Friday’s high of $2.98, providing further indication that strong resistance may be seen in that price area or lower. Recent price action has been a good example of how the broadening consolidation pattern produces unreliable signals, since it can give the impression that a sustained trend is developing, only for the move to not sustain or follow through.
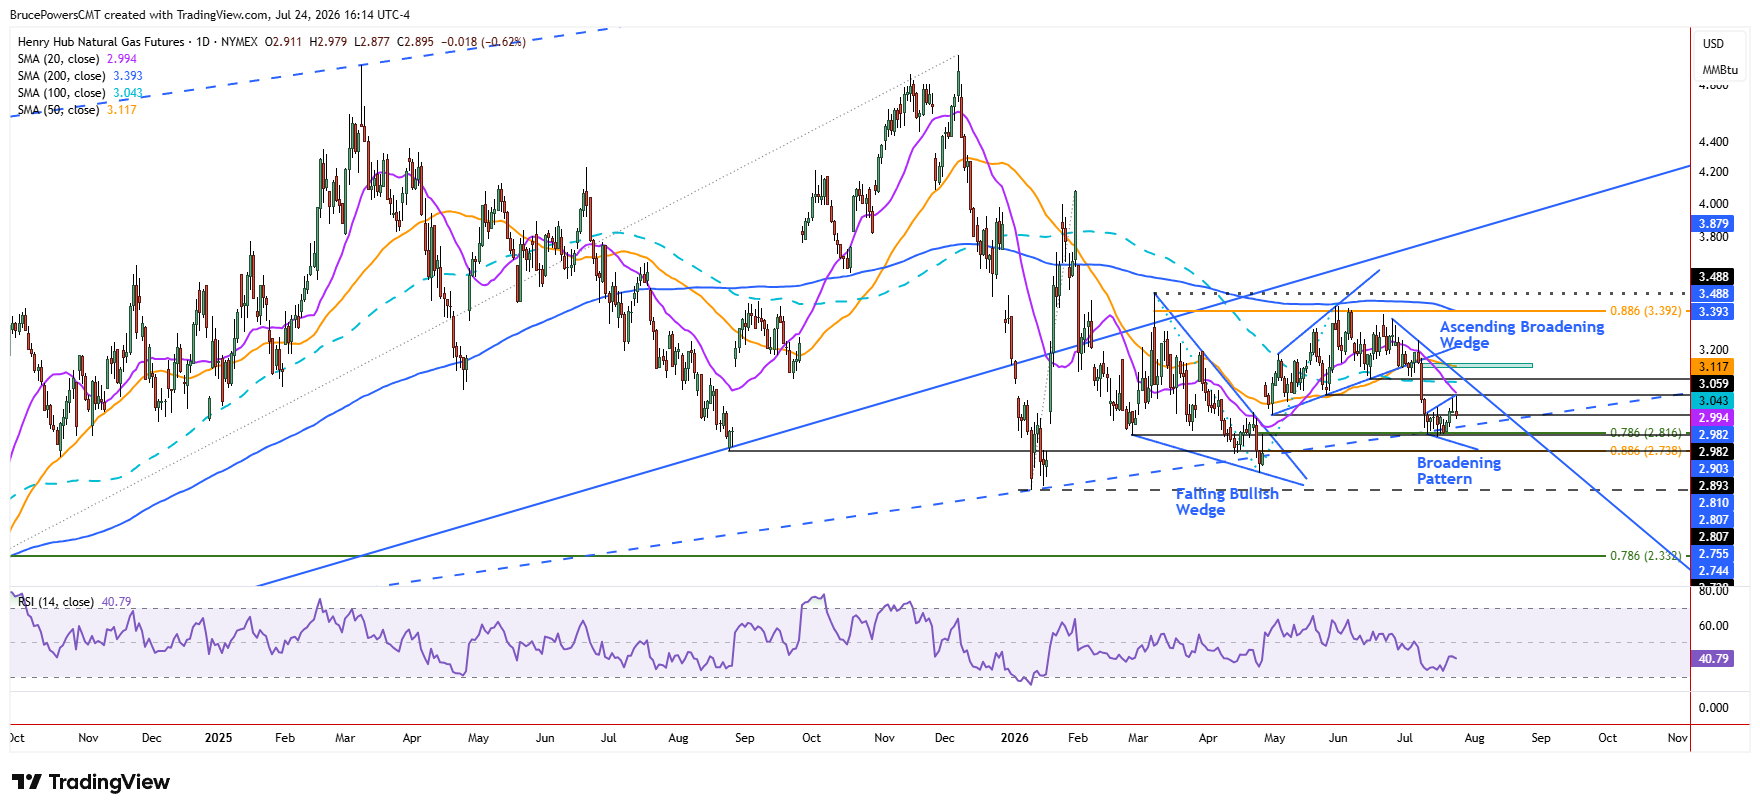
Now that potentially significant dynamic resistance from the 20-day moving average is close to $2.98, the chance for a higher retracement of the recent sharp decline may have passed. There are no current apparent signs of strength that would suggest the 20-day moving average may be reclaimed in the near term. On the contrary, although support has held, there has not been enough improvement in demand to counter selling pressure. That suggests that a bearish continuation may be more likely before a counter-trend rally that rises above this week’s high.
A Bullish Reversal Lacks Confirmation
Having said that, the weekly chart shows a one-week bullish reversal signal with a slightly higher weekly low and higher high. That was a bullish signal, but it failed to confirm with a daily closing price above last week’s high of $2.93. The lack of confirmation is a sign of weakness and suggests the possibility of an eventual failure of the bullish weekly signal with a decline below this week’s low of $2.81. If that occurs, then last week’s low of $2.80 likely to fail as support. Such a move would also strengthen the bearish case suggested by the repeated rejection of resistance near $2.98.
$2.80 Becomes the Key Downside Trigger
In summary, key short-term resistance is at $2.98 and the 20-day moving average, now at $2.99 and falling. A sustained reclaim of that indicator would need to occur before there is a chance for higher prices. On the downside, key support is at last week’s low of $2.80. Although a decline below that level would signal a bearish continuation of the trend, it also may lead to a test of support near the lower boundary of the small broadening pattern noted earlier.
Natural Gas Price Forecast
Every new Natural Gas analysis as it publishes, today's technical signal and key levels, live price — on one page.
See all Natural Gas forecastsIf you’d like to know more about how to trade natural gas, please visit our educational area.