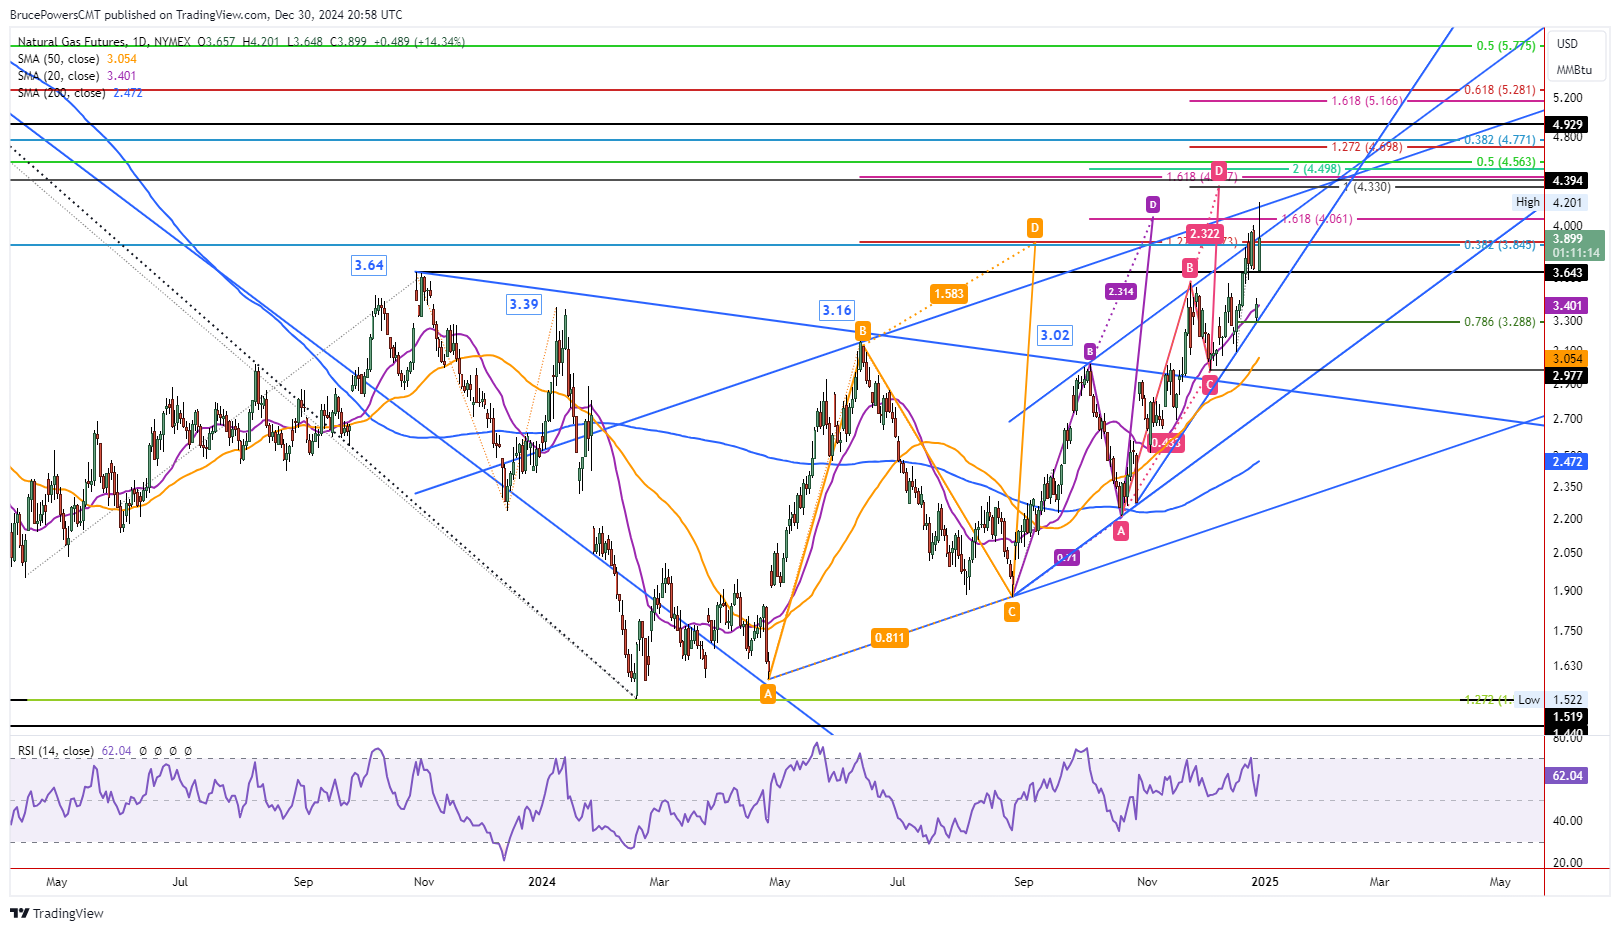
Natural gas jumped to a new trend high of 4.20 on Monday before encountering resistance and retracing the advance intraday. Despite the bullish move natural gas is on track to close relatively weak for the day, in the lower half of the day’s trading range and below the prior trend high of 4.01.
The high for the day and resistance was seen around the top trendline for a long-term rising parallel trend channel, with the lower trendline of the channel rising from the April 2024 swing low.
Resistance Seen at Top of Channel
Given today’s bearish reaction around the top channel line, it seems like the market has recognized the price zone around the line. There was also the completion of a rising ABCD pattern extended by the 161.8% Fibonacci ratio at 4.06, and of course natural gas plowed right through that price area. Subsequently, the next higher price zone looks like it starts around 4.33. That’s where another ABCD pattern (red) reaches its initial target.
Another Test of Support Around 20-Day MA?
If natural gas continues to get rejected from resistance around the top channel line, this could lead to a correction. However, notice that it could keep rising and stay below the top channel line until almost reaching the 4.33 target. Nonetheless, targets only provide a guide and price action needs to be watched for new clues and changes in the outlook.
Today’s price action has begun to generate a potentially higher weekly high and higher low for this week. The weekly trend structure will remain in place unless there is a drop below last week’s low of 3.29.
Rally Risks Getting Tired
This means that a pullback from today’s high would not be unusual and that the near-term bull trend structure remains unless there is a drop below 3.29. Profit taking as seen in a pullback may also occur during a period of consolidation. Keep in mind that long-term bullish signals recently triggered and were confirmed by additional signal of strength. A bullish breakout of a large symmetrical triangle pattern triggered on November 20, and a long-term trend continuation signal occurred on a rally above the 3.16 swing high from June on the initial breakout day.
Natural Gas Price Forecast
Every new Natural Gas analysis as it publishes, today's technical signal and key levels, live price — on one page.
See all Natural Gas forecastsFor a look at all of today’s economic events, check out our economic calendar.