
Market Overview
Silver (XAG/USD) extended its losses, hitting an intra-day low of $30.05 as the US Dollar gained momentum. The greenback’s renewed strength was bolstered by rising US Treasury yields and market bets on slower Federal Reserve rate cuts.
The uncertainty surrounding global trade, driven by President-elect Donald Trump’s tariff threats, further pressured silver prices.
Trump’s plans to impose tariffs on nations moving away from the USD for international transactions have amplified demand for the dollar, dampening interest in silver as a riskier alternative.

China’s Economic Data Fails to Lift Silver
Economic data from China offered mixed signals for silver. The official Manufacturing Purchasing Managers’ Index (PMI) rose slightly to 50.3 in November from 50.2, while the Caixin Manufacturing PMI climbed to 51.5 from 50.3, suggesting resilience in private-sector manufacturing.
However, the NBS Non-Manufacturing PMI dropped to 50.0, indicating slower growth in the services sector.
Although there is optimism about potential stimulus measures from China, it has not translated into stronger silver prices amid the USD’s dominance.
Key Data to Watch This Week
Investors are closely monitoring the US economic calendar, with the ISM Manufacturing PMI and the Nonfarm Payrolls (NFP) report in focus. These releases are likely to shape expectations for Federal Reserve policies and drive short-term market movements.
Silver Price Forecast
Every new Silver analysis as it publishes, today's technical signal and key levels, live price — on one page.
See all Silver forecastsShort-Term Forecast
Silver (XAG/USD) remains under pressure, trading near $30.17 amid USD strength. Key support at $30.02 risks further declines, while a break above $30.25 could signal recovery potential.
Silver (XAG/USD) Price Forecast: Technical Outlook
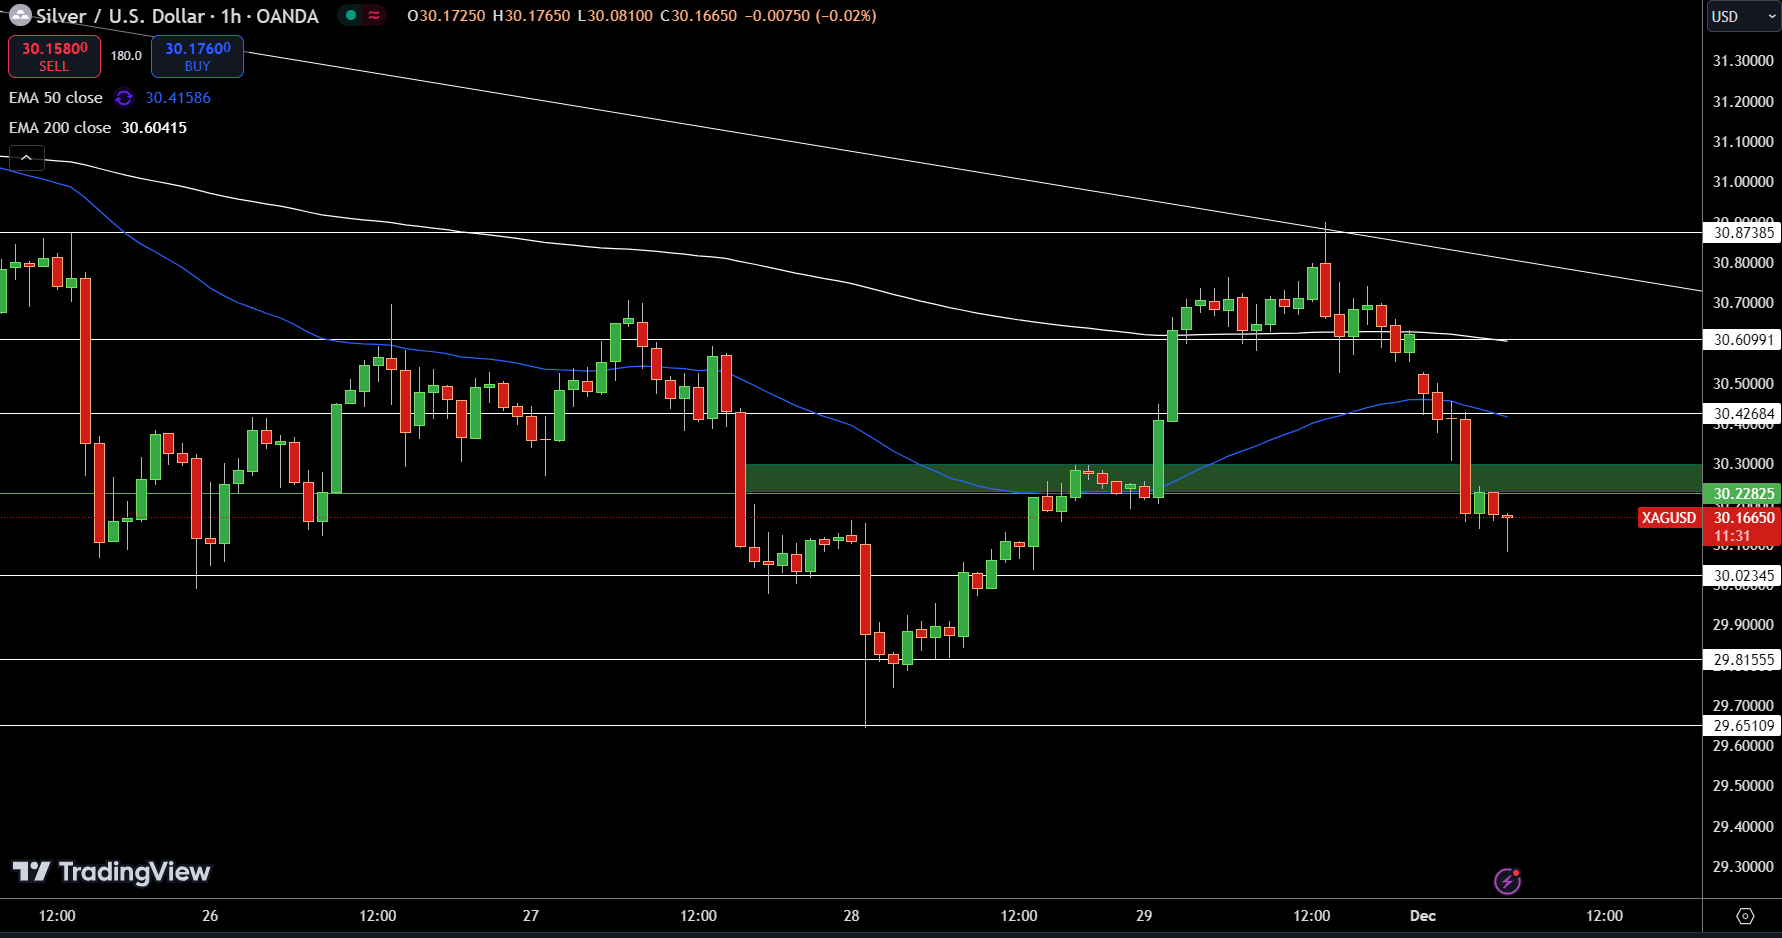
Silver prices are trending downward, trading at $30.17, a 1.47% drop in the last session. The metal is struggling below its pivot point at $30.25, with immediate resistance at $30.43, followed by $30.61 and $30.87. On the downside, support is at $30.02, with deeper levels at $29.82 and $29.65.
Technical indicators suggest continued pressure, with the 50-day EMA at $30.42 and the 200-day EMA at $30.60 reinforcing overhead resistance. The RSI leans bearish, hinting at further declines unless the price reclaims $30.25.
A double-bottom breakout pattern near $30.02 could deepen selling pressure unless reversed by bullish momentum. Traders should monitor for a break above $30.25 to signal potential recovery.