Silver Rallies as Oil, Yields and the Dollar All Break Lower
Silver is up 3.3% to about $61.49 early Wednesday and the move is too fast to call it dip-buying. Traders appear to be actually taking out offers, something we haven’t seen for a while. Oil dropped on Iran deal talk, Treasury yields followed it down with the 10-year falling toward 4.60% after recently trading near 4.75%, and the dollar is still losing ground from last week’s yen intervention. All three headwinds came off at the same time and silver ran.
This is not an industrial demand story or a supply shock. The same rate-hike trade that had been capping silver for weeks just reversed. Sellers who had been leaning on the metal from the short side had to get out of the way once the macro picture shifted, and the move looks like short covering first and fresh buying second.
The risk is that every piece of this rally depends on a deal that Iran says is not happening yet. If the Hormuz talks collapse and crude recovers, the inflation argument comes back with it and silver gives this move right back.
Oil Broke and the Rate Trade Followed
Crude had been the inflation problem keeping the Fed hawks armed. Higher energy prices fed the case for September and pushed yields to levels that made it impossible for silver to hold a rally. Then the Hormuz deal talk pulled oil lower and took a piece of that argument away.
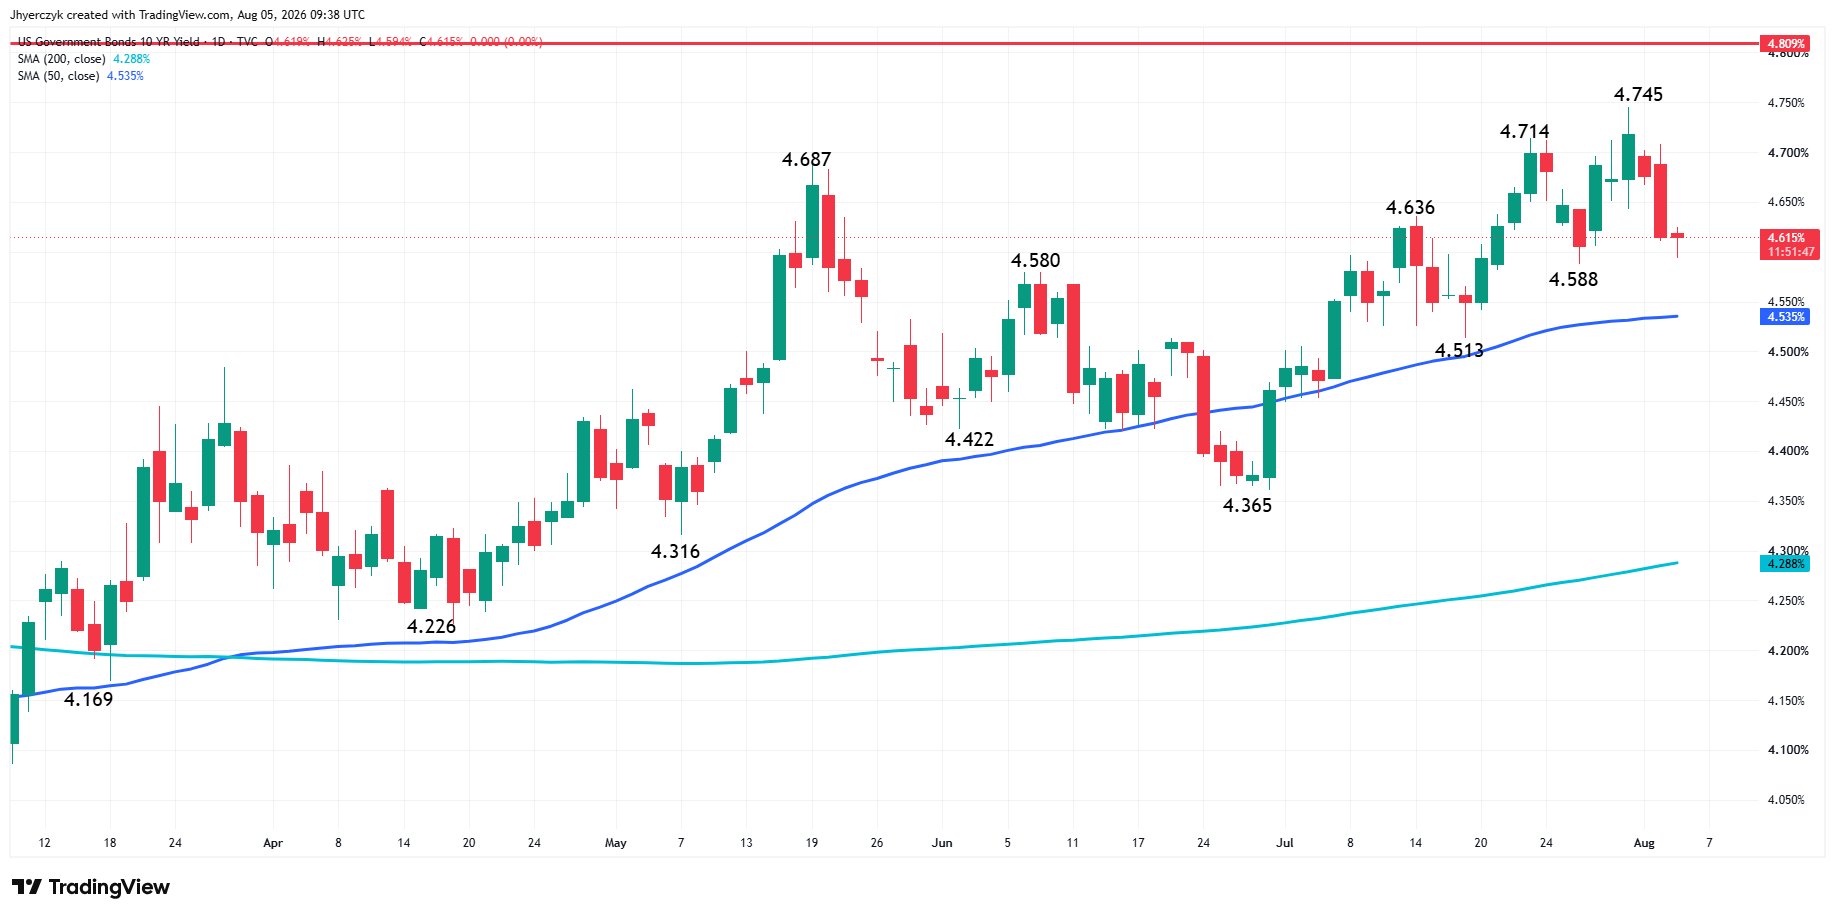
The 10-year yield dropping from near 4.75% to 4.60% is not a small move for a metal that had been trading against rising rates for three straight weeks. That shift opened the door. But the market is not declaring peace. It is trading the possibility that fewer shipping disruptions mean less inflation pressure ahead. That is enough to move silver. It is not enough to keep it moving if the headline reverses.
Iran has pushed back on claims about direct talks with Washington. A possible deal is not a signed deal and crude can snap back on one comment from Tehran. Silver will not like that reversal.
Dollar Longs Are Still Coming Off
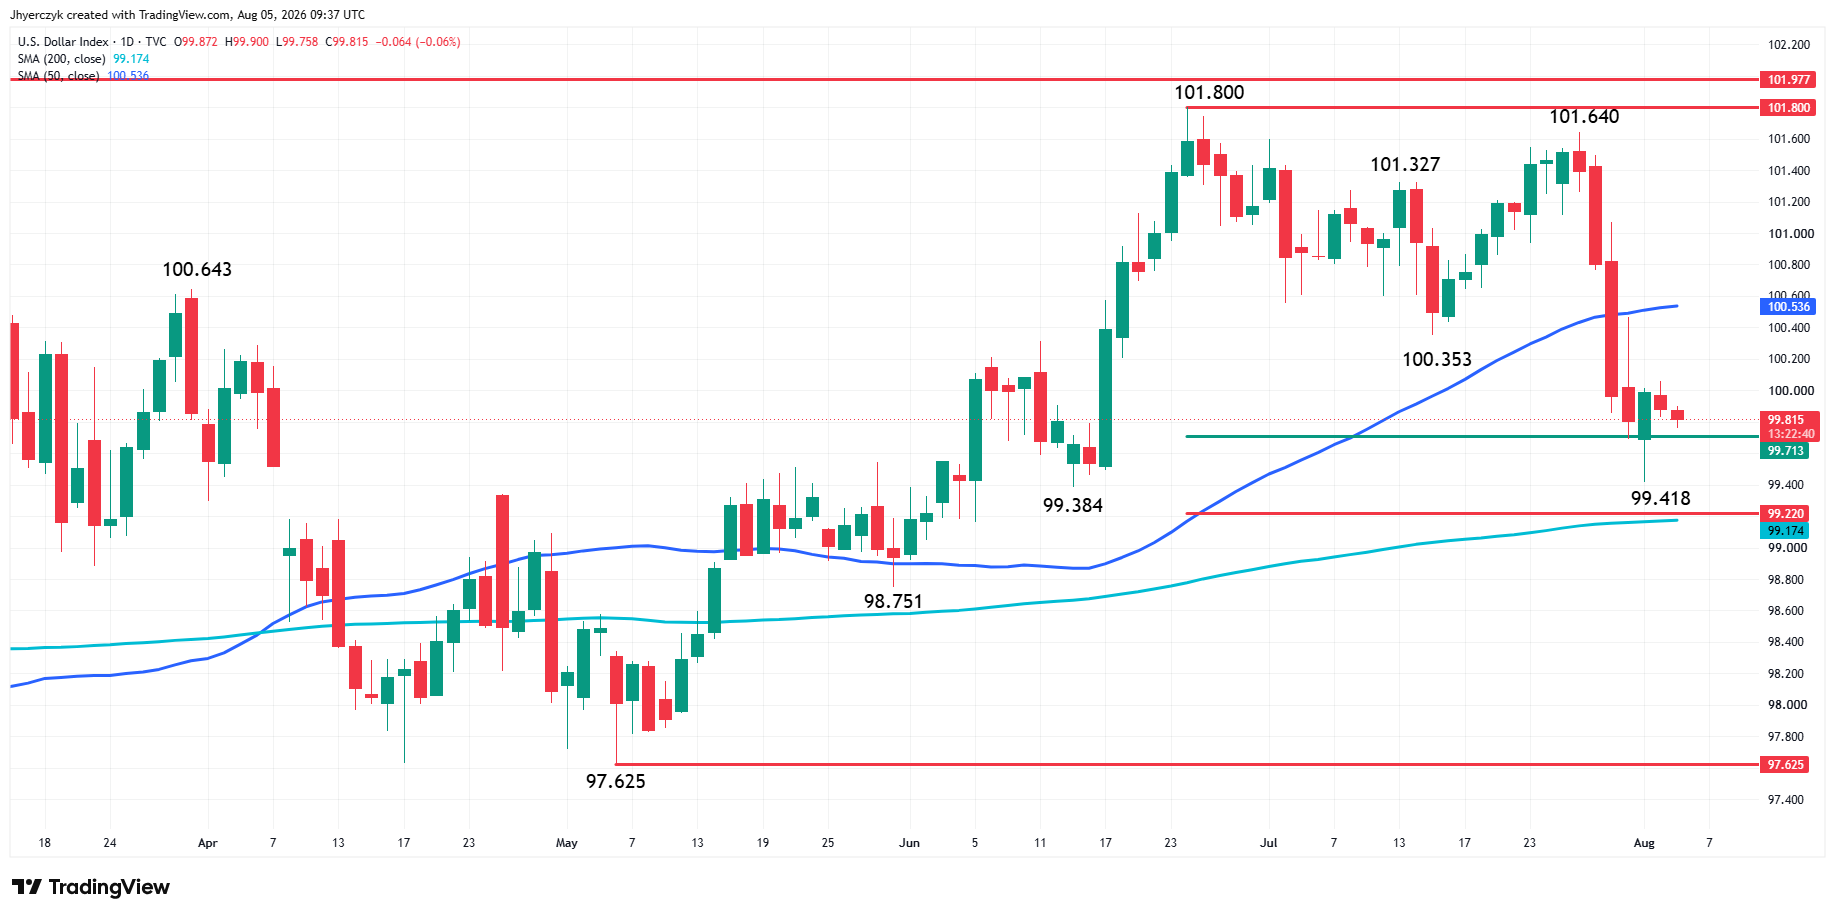
The dollar had been bid going into last week’s Fed meeting and the positioning was heavy. The hold was not dovish but it was less aggressive than the rate market had feared. Then the yen intervention forced long-dollar positions to unwind, and the dollar index fell toward a six-week low near 99.85.
Silver Price Forecast
Every new Silver analysis as it publishes, today's technical signal and key levels, live price — on one page.
See all Silver forecastsSilver is getting both flows at once: falling yields and a falling dollar. That is why the move is running harder than the usual one-session bounce. The positioning unwind has further to go if the data cooperates this week.
September hike odds have dropped to roughly 59% from 67%. The Fed is still the risk. Kansas City Fed President Jeff Schmid repeated Tuesday that tighter policy is needed to bring inflation back to target. But silver does not need the Fed to turn dovish right now. It just needs the tightening trade to keep losing momentum, and that is what is happening.
Daily Spot Silver (XAGUSD) Technical Analysis
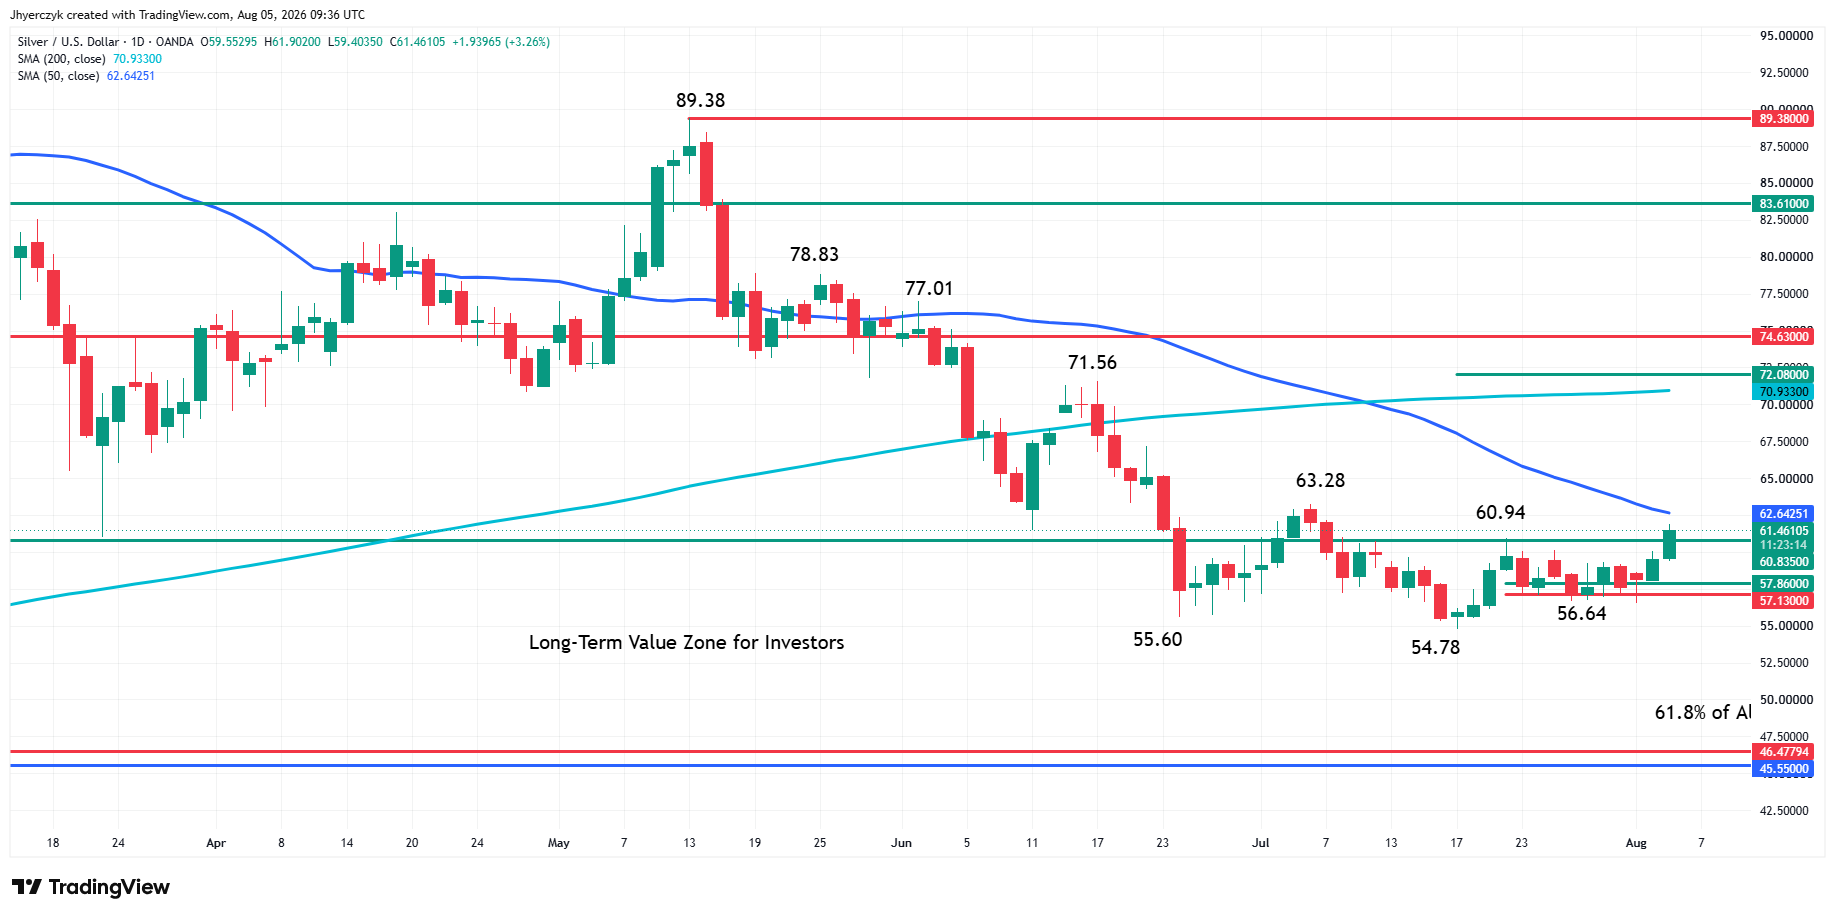
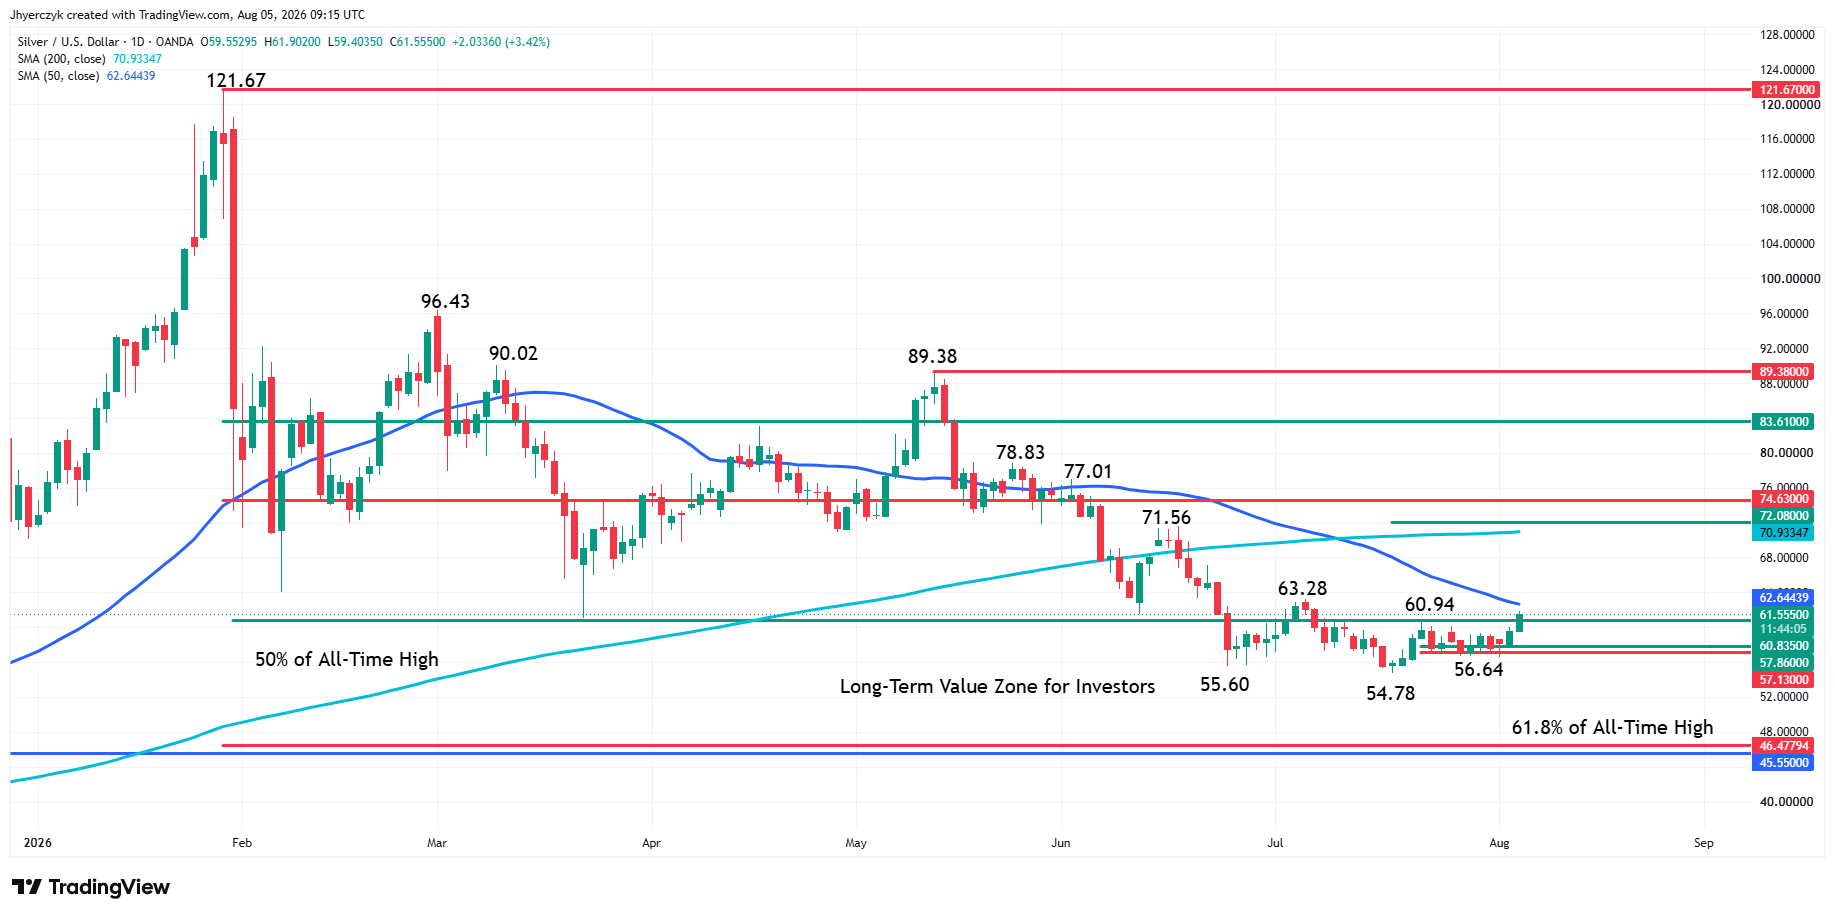
Spot silver is sharply higher for a second session on Wednesday. Upside momentum is strengthening today after buyers crossed to the strong side of the long-term 50% level at $60.835, leading to a breakout over the last swing top at $60.94.
Taking out $60.94 ended the pattern of lower tops and changed the main trend to up according to the swing chart. The move put silver in a position to challenge the 50-day moving average at $62.64. The 50-day moving average is a potential resistance level and could trigger an acceleration to the upside if buyers take it out.
A sustained move over the 50-day moving average will indicate the buying is getting stronger. This could lead to a test of the next swing top at $63.28. Taking out this top would put the 200-day moving average at $70.92 on the radar.
On the downside, a sustained move back under the major 50% level at $60.835 will signal the return of sellers. If this creates enough downside momentum, look for a near-term pullback to $58.00.
What to Watch
Silver needs crude staying lower, yields staying contained and the dollar staying under pressure. All three lined up this week and that is why the move has been fast. If any one of them reverses, the rally gets tested.
Friday’s jobs report can either extend this trade or kill it. A weak number with softer wages keeps the dollar unwind going and gives buyers room to push toward the 50-day moving average. A strong print with firm hiring, hands Schmid and the rest of the hawks exactly what they need, and the rate trade reassembles.
The swing chart trend has changed to up but buyers are chasing a macro relief trade, not a structural shift. They have momentum as long as the data cooperates. The moment it stops cooperating, sellers have a clean level to come back in at.
More Information in our Economic Calendar.