


Buyers Push Silver to $70 as Dollar and Yields Roll Over
Silver tested $70 for the first time since mid-June on Friday as the dollar weakened and Treasury yields backed off their recent highs. Gold was running alongside and the physical market stayed tight underneath. Sellers showed up at the round number and could not hold it. The 200-day moving average is the next level overhead.
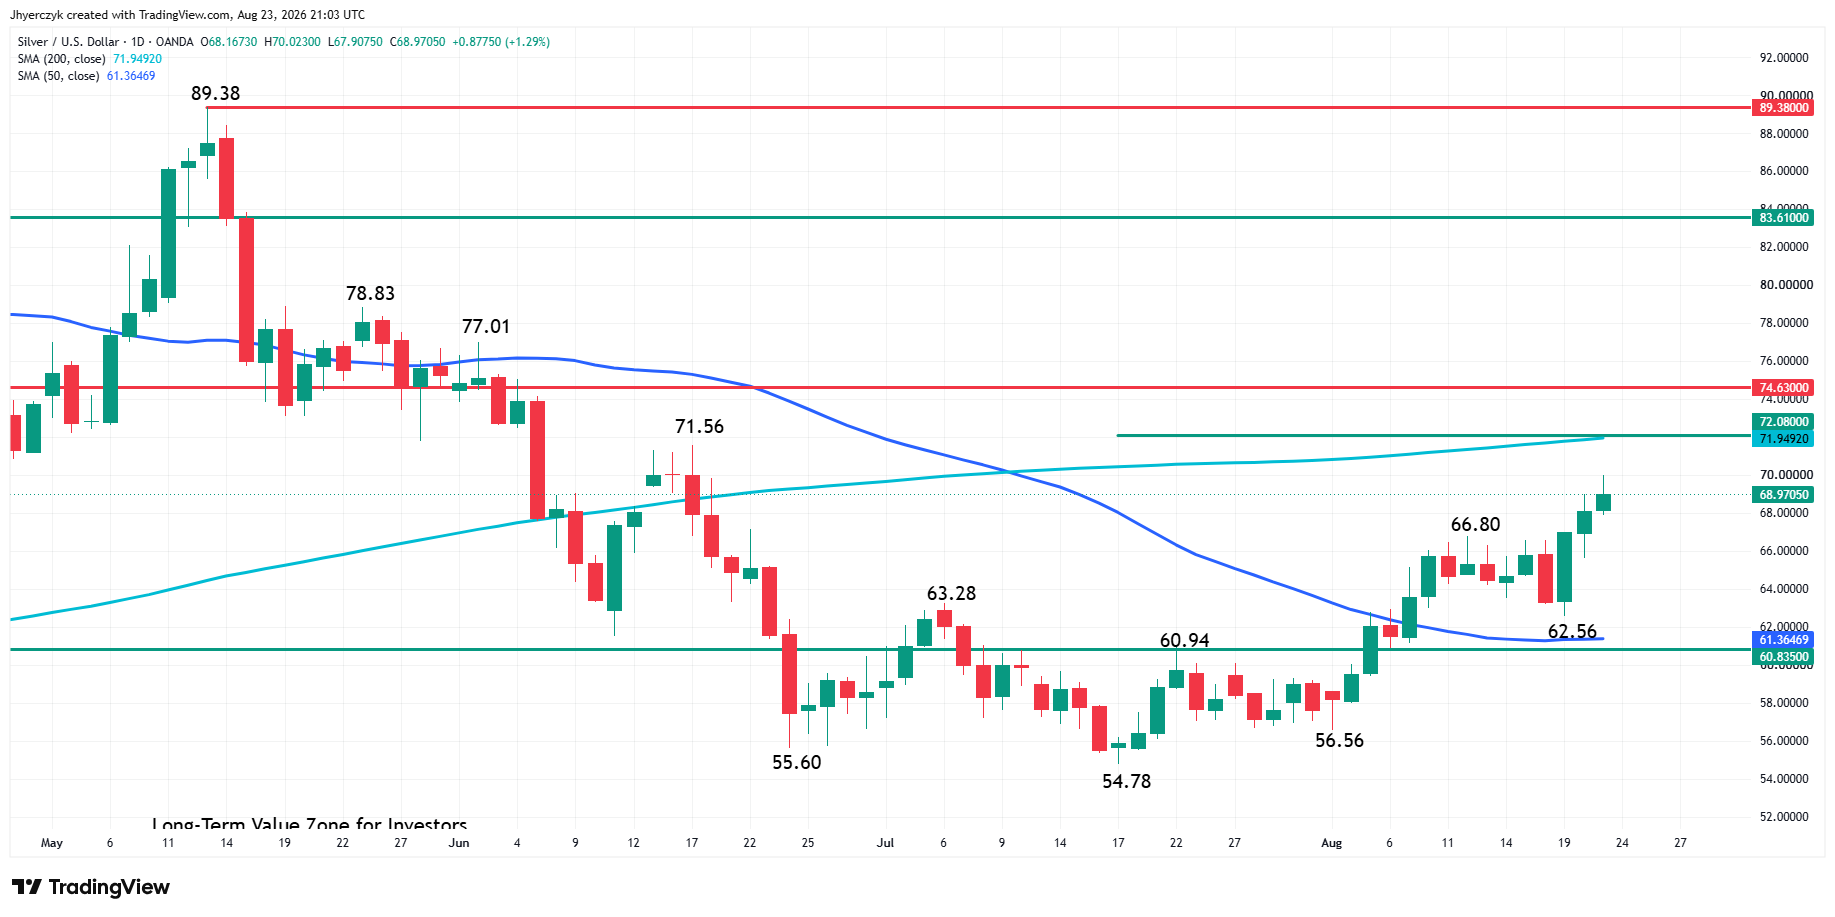
Spot Silver (XAGUSD) settled Friday at $68.97, up $0.88, or 1.29%. The metal reached $70.02 during the session and traded as low as $67.91. The close still mattered. Silver finished well above the day’s low after buyers spent most of the session in control.
Treasury Buybacks Broke Yields Lower and Silver Followed
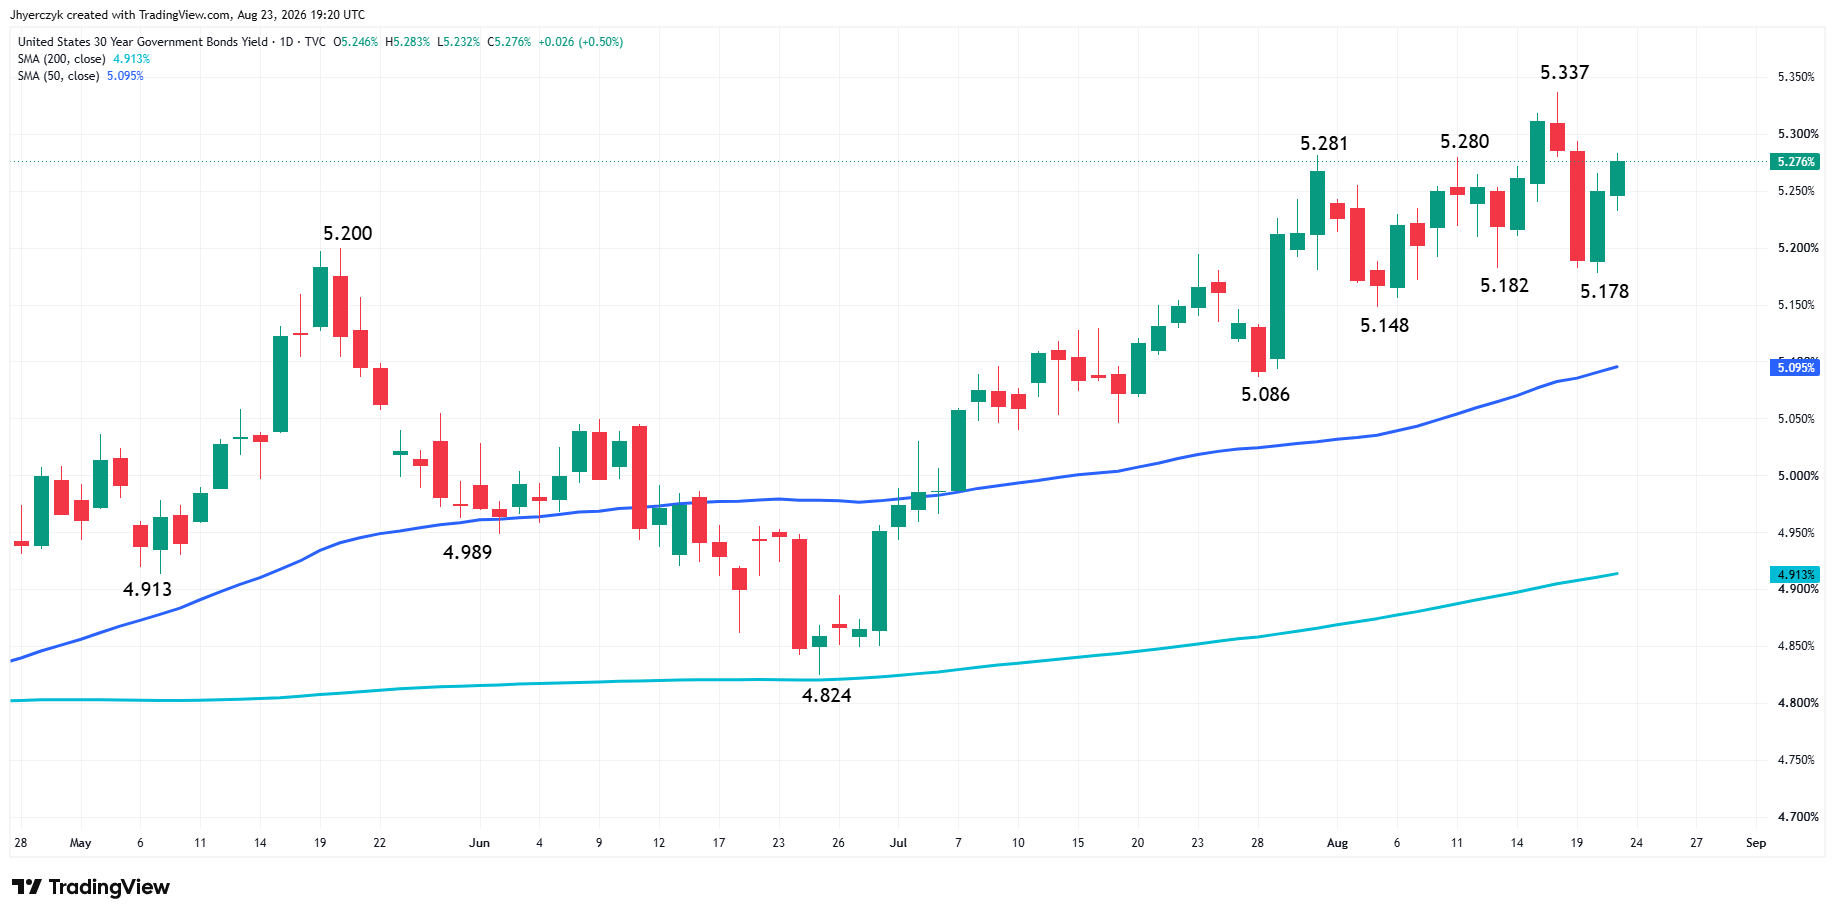
The U.S. Treasury Department said it would at least double buybacks of government bonds with maturities of 10 to 30 years, with operations set to begin in early September at a minimum of $4 billion each. Treasury officials left the door open to larger purchases. The announcement came after long-dated yields reached multi-year highs and the cost of borrowing was becoming a problem Washington could not ignore.
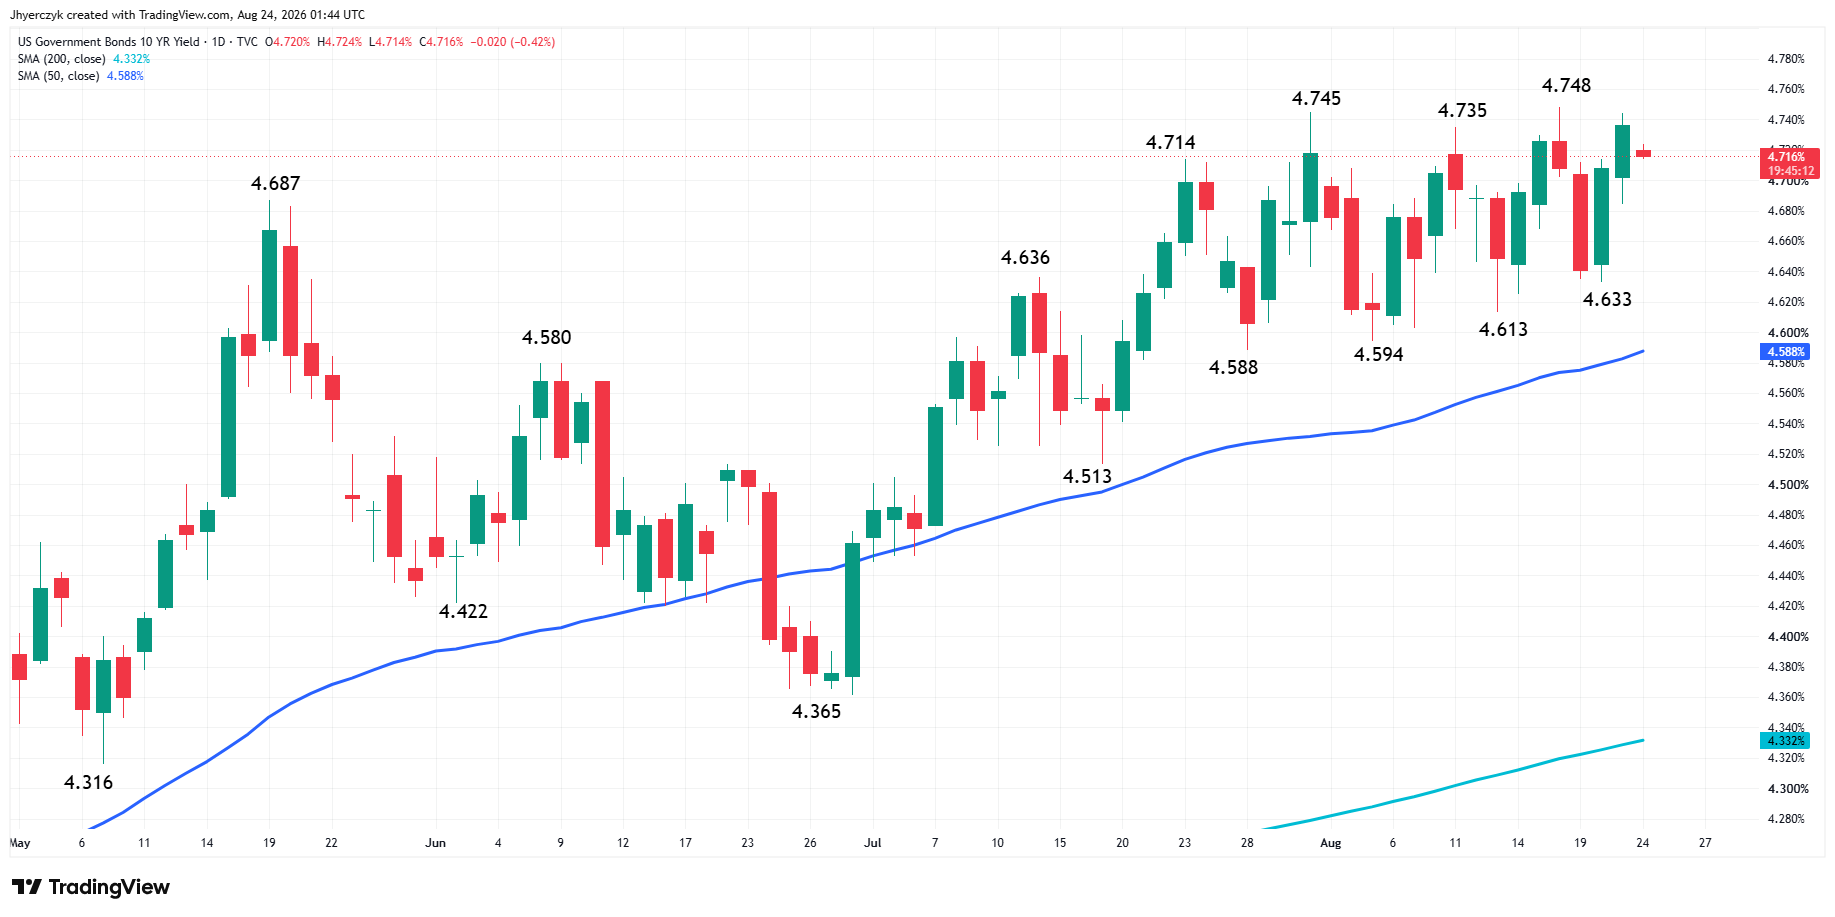
The bond market caught a bid, yields fell, and the dollar lost ground. Silver buyers had what they needed. The greenback could not find buyers Friday and sat near a three-month low the entire session. Silver caught the bid as it weakened.
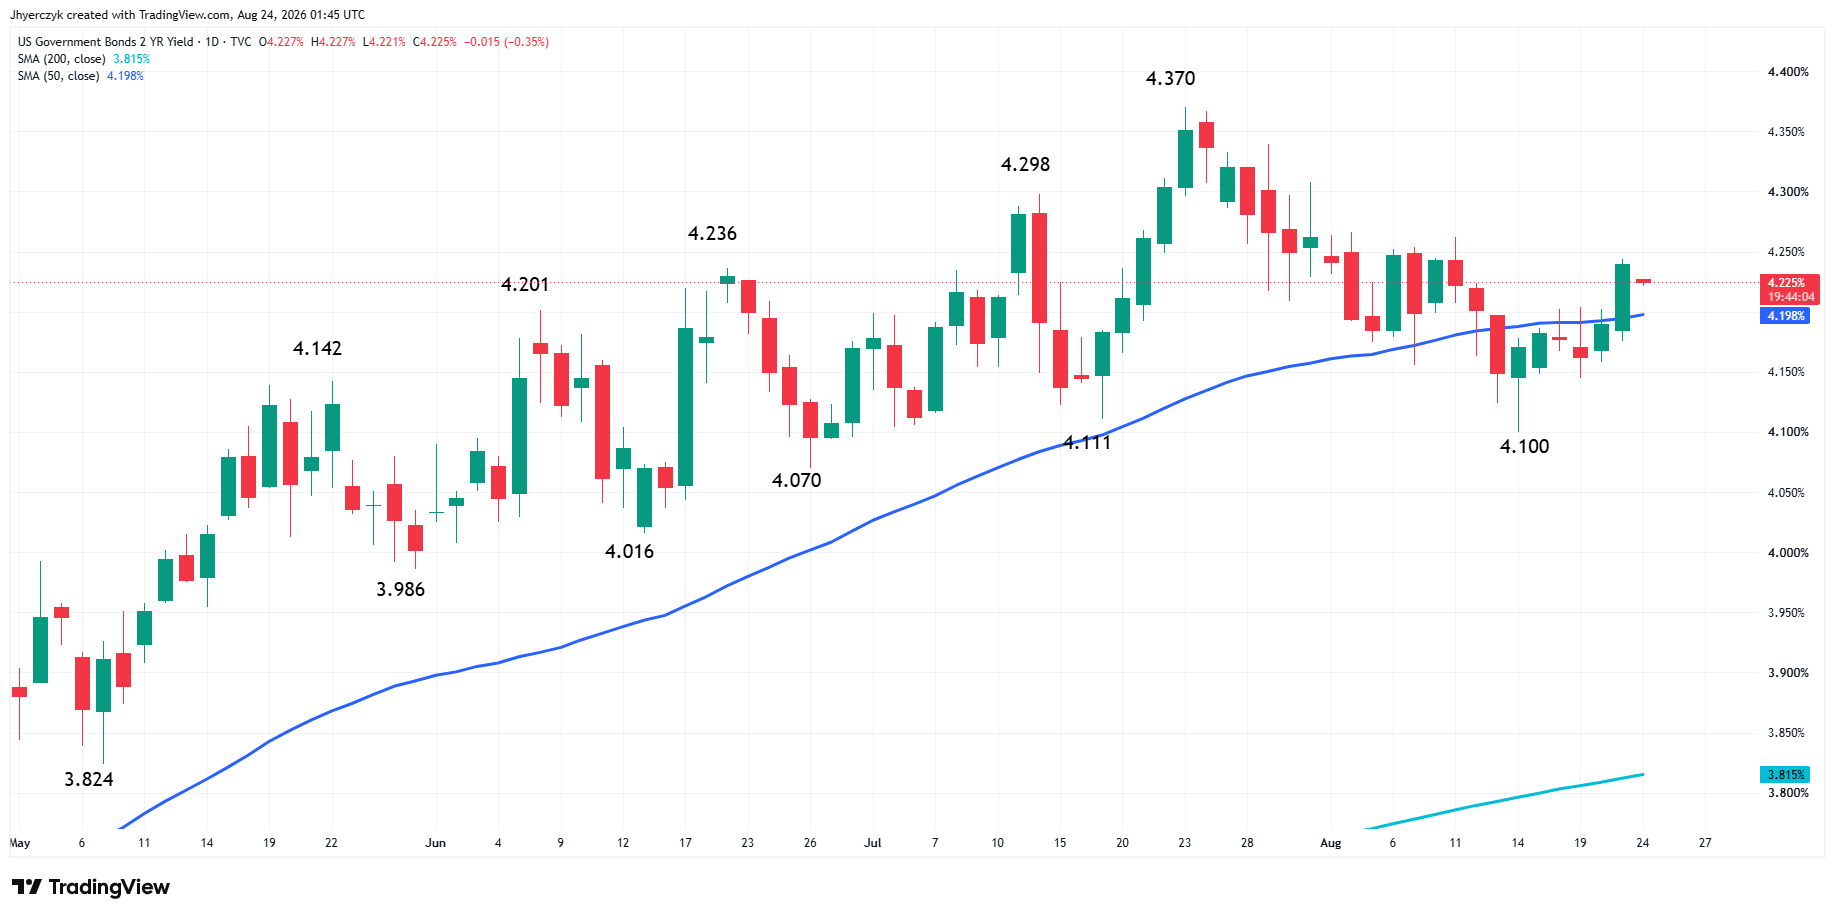
The buyback gave the market relief but it did not change the reason yields climbed in the first place. Government borrowing has continued to rise and the Treasury still has to bring new supply to market to finance deficits and future spending. Washington is trying to calm the long end of the bond market. The larger debt problem remains.
Gold and the Physical Market Gave Silver Two More Reasons to Run
Gold pushed to its strongest level in about three months on Friday. Silver followed, and moved faster during the session. Gold held the defensive-money bid. Silver added its own demand angle on top of it.
Silver Price Forecast
Every new Silver analysis as it publishes, today's technical signal and key levels, live price — on one page.
See all Silver forecastsThe market opened near $68.20, then climbed steadily toward the round number. Sellers showed up near the high but could not force a deeper break. Buyers came back and kept silver well above the early low. That is the price action traders wanted to see after the summer. The market ran into selling near $70 and it did not collapse when the first offers appeared. Friday brought solid volume. The move had participation behind it.
The physical silver market remains tight and mine supply has struggled to keep pace with demand in recent years. That has not changed and it is not going to change on the next data release.
Oil prices remain elevated as the U.S.-Iran conflict continues to restrict shipping through the Strait of Hormuz. Friday belonged to the dollar and the bond market, and crude stayed in the background. Oil is the piece of this trade that can turn the setup around, and it has not turned yet.
Daily Spot Silver (XAGUSD) Technical Analysis
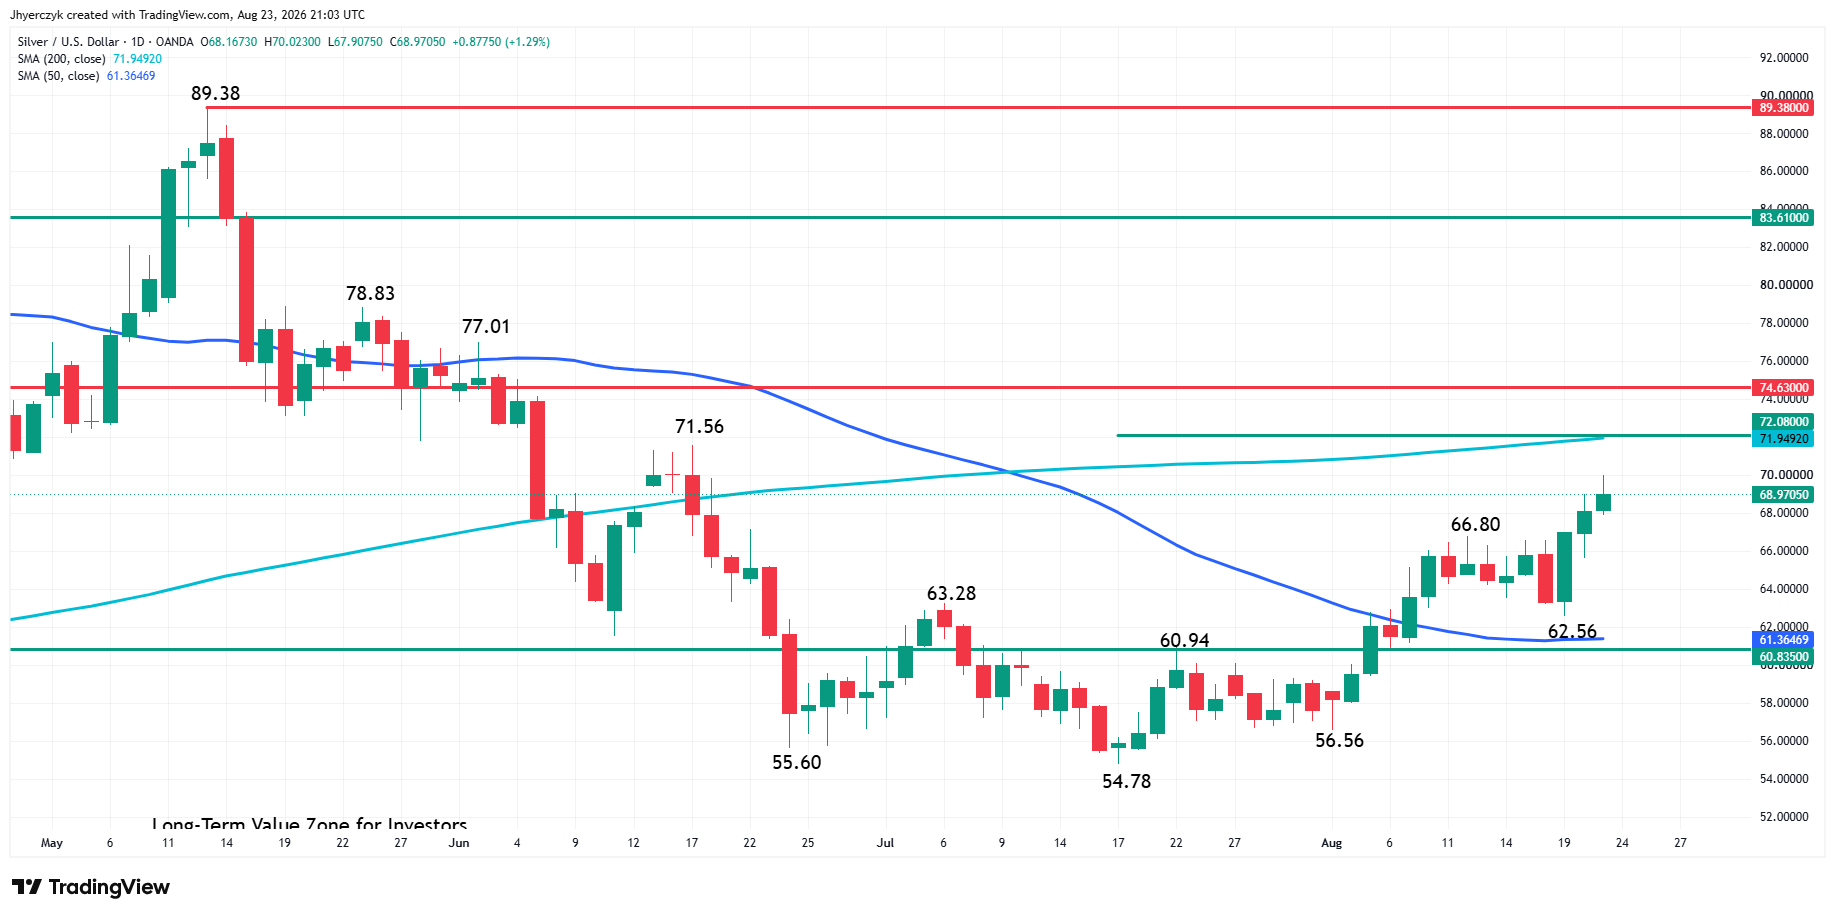
Spot silver finished higher on Friday with enough momentum to put it within striking distance of the June 17 main top at $71.56, but more importantly, the 200-day moving average at $72.03, which controls the long-term term trend. Crossing to the bullish side of this indicator could bring in new institutional investment that could eventually drive the market into the long-term retracement zone at $74.63 to $83.61.
If buyers fail to sustain a move over Friday’s high at $70.02, then we could see a fresh round of profit-taking. Given the $62.56 to $70.02 range, the first downside objective would be its retracement zone at $66.29 to $65.41.
What to Watch
The dollar and Treasury yields are the trade. Buyback operations are scheduled to begin in September, and the debt and deficit concerns that pushed Washington into the bond market have not been resolved. Inflation data and Fed commentary are next. If the dollar stays under pressure and yields remain below their recent highs, buyers have room to keep working on the upside.
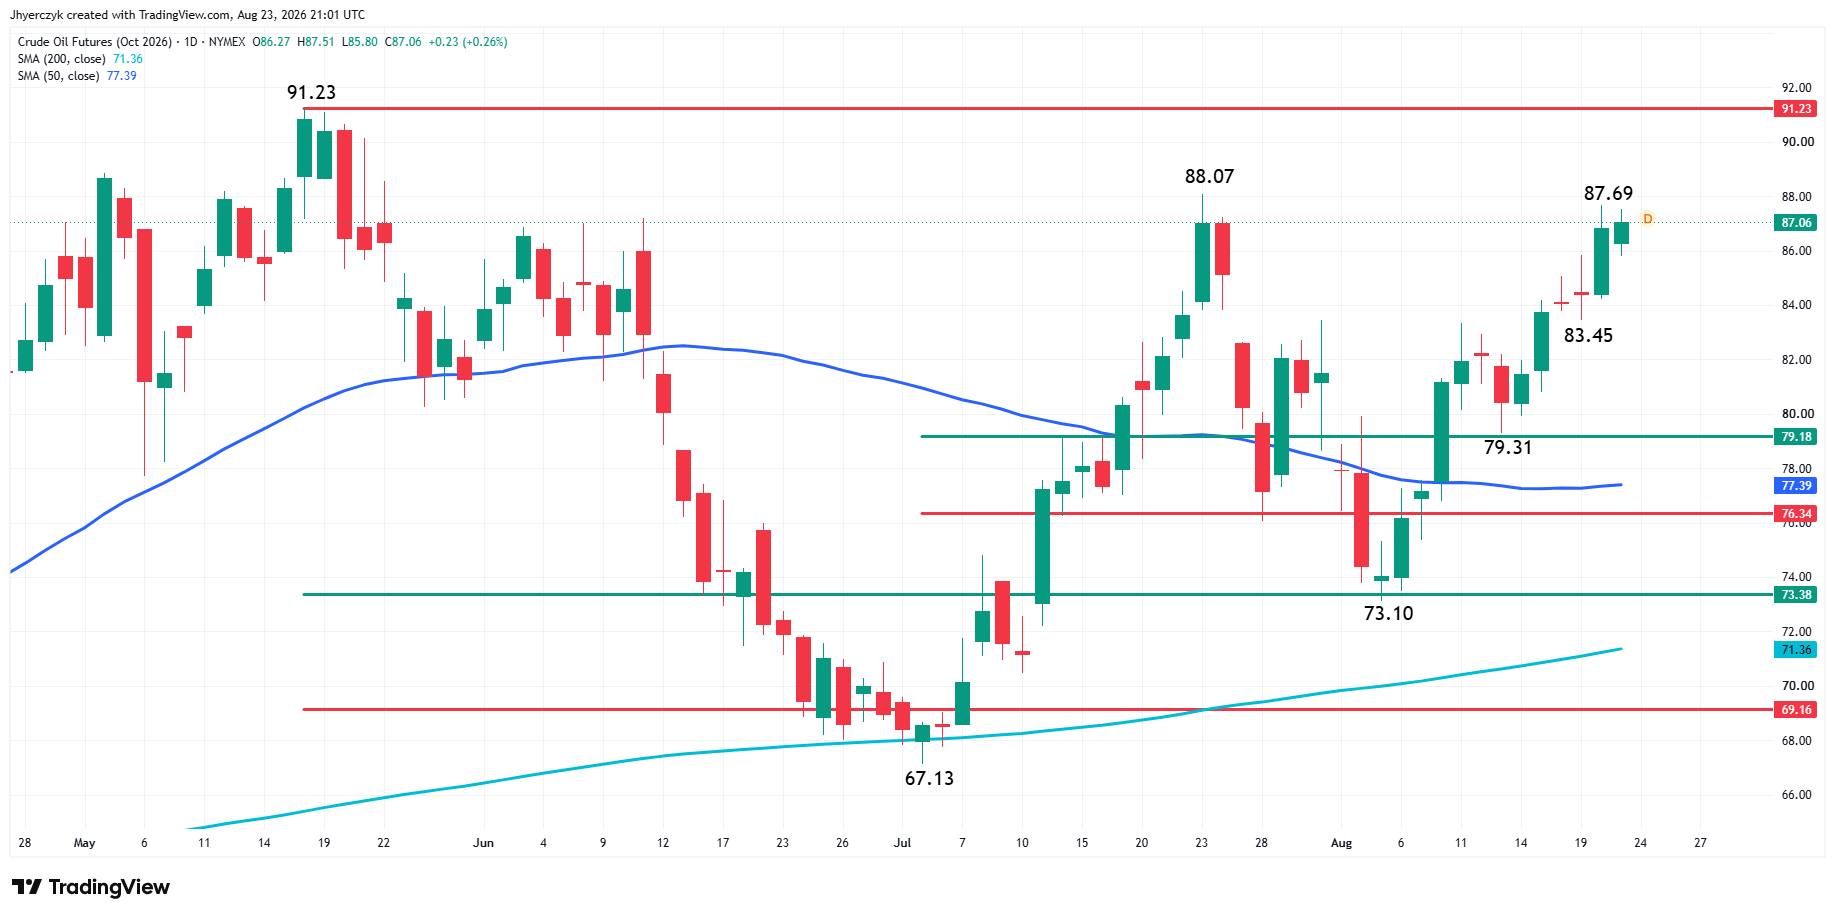
Crude oil remains the reversal risk. If it runs far enough to rebuild rate-hike bets, silver loses the tailwind that powered Friday’s move. The late-session rejection at $70 also showed that sellers are not gone. They are waiting for a reason and the macro trade has not given them one yet.
The 200-day moving average at $72.03 is the chart target and the level that changes the long-term picture. The market closed within striking distance on Friday. Whether buyers can build above $70 and reach the 200-day determines if this move keeps going.
More Information in our Economic Calendar.



