


Chip Bounce Lifts Futures as Oil Pulls Back
The Nasdaq is leading on a chip stock rebound after last week’s heavy selling. Crude oil is giving back overnight gains after Iran’s Foreign Ministry raised the possibility of renewed negotiations, and that pullback in crude is giving growth stocks room to run this morning.
The risks have not changed. Oil can reverse on the next headline, Treasury yields are still pressing near recent highs, and gasoline above $4 per gallon keeps the inflation trade alive. Last week, the S&P 500 fell 1.6%, the Nasdaq Composite dropped 2.9% and the Dow slipped 0.9%.
At 12:43 GMT, S&P 500 Index futures are trading 7535.00, up 37.25 or +0.50% at 11:59 GMT. Nasdaq-100 futures are at 29066.50, up 293.25 or +1.02%. Dow futures are at 52559.00, up 184.00 or +0.35%.
Daily September E-mini S&P 500 Index Futures
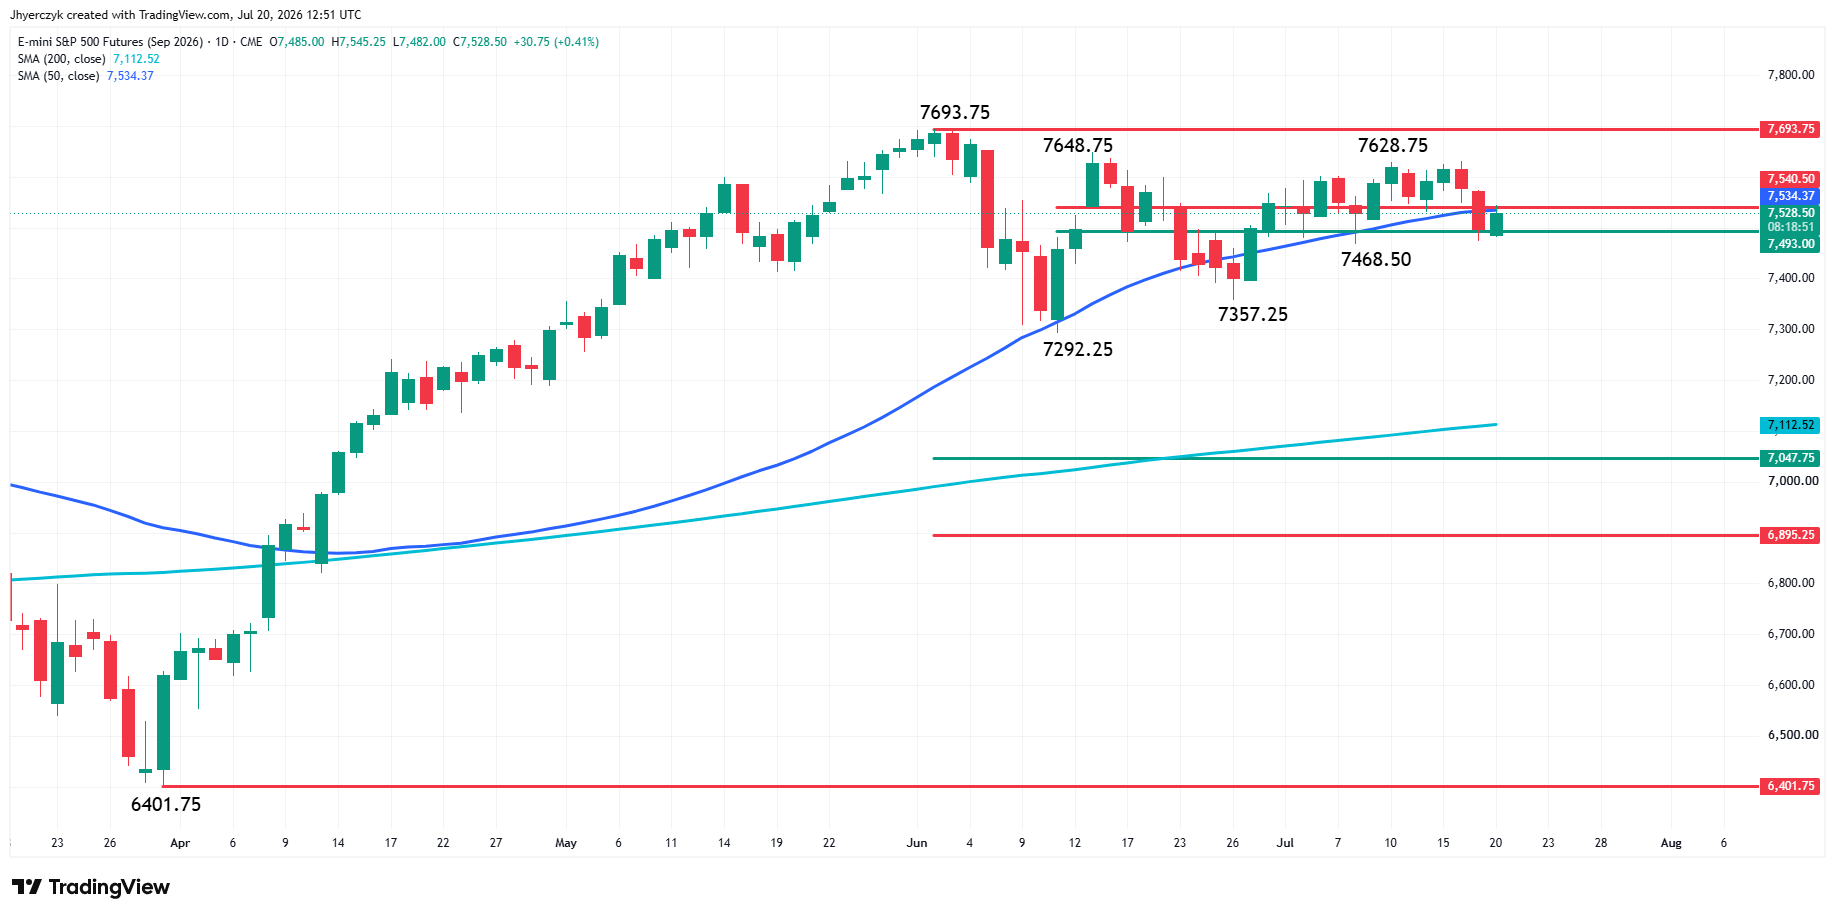
September E-mini S&P 500 Index futures are edging higher shortly before the cash market opening, following a volatile overnight session that saw the benchmark index dip to 7482.00 before recovering. The early price action saw investors come in to defend Friday’s low at 7473.00.
Once again, the index is hovering inside the short-term retracement zone at 7493.00 to 7540.50 that has been controlling its direction for most of the month along with the 50-day moving average at 7534.43.
That being said, I think that trying to follow the retracement zone is likely to produce a lot of choppy trading, while tracking the 50-day MA is more likely to generate a smoother assessment of the price action.
A sustained move over the 50-day MA will be a sign of strength, but the move could develop into something meaningless unless bullish traders build a strong enough base to support a drive into the main tops at 7628.75 and 7648.75, and ultimately into the record high at 7693.75.
On the flipside, the inability to overtake the 50-day MA will signal that bearish traders are likely defending against a resumption of the bull market. They could represent the value side of the market or the investors who believe that the market is too expensive.
Their preferred play would be to the downside. Their particular playbook would have the index taking out swing bottoms at 7468.50, 7357.25 and 7292.25 with the hope of a huge break into the perceived value area at 7047.75 to 6895.25 or the 200-day moving average at 7112.51.
All of this churning is could be disruptive over the short-run, but as long as the index remains anchored to the 50-day moving average, it seems like it’s just a matter of time before long-term traders regain control and pick a direction.
Dow Jones Price Forecast
Every new Dow Jones analysis as it publishes, today's technical signal and key levels, live price — on one page.
See all Dow Jones forecastsIran Talk Pulled the War Premium Out
The United States completed its ninth consecutive day of strikes on Iran overnight, but crude oil gave back an early rally after Iranian Foreign Ministry spokesman Esmail Baghaei raised the possibility of renewed negotiations. He said intermediaries are still exchanging messages with Iran and that talks could move forward if they serve the country’s national interests.
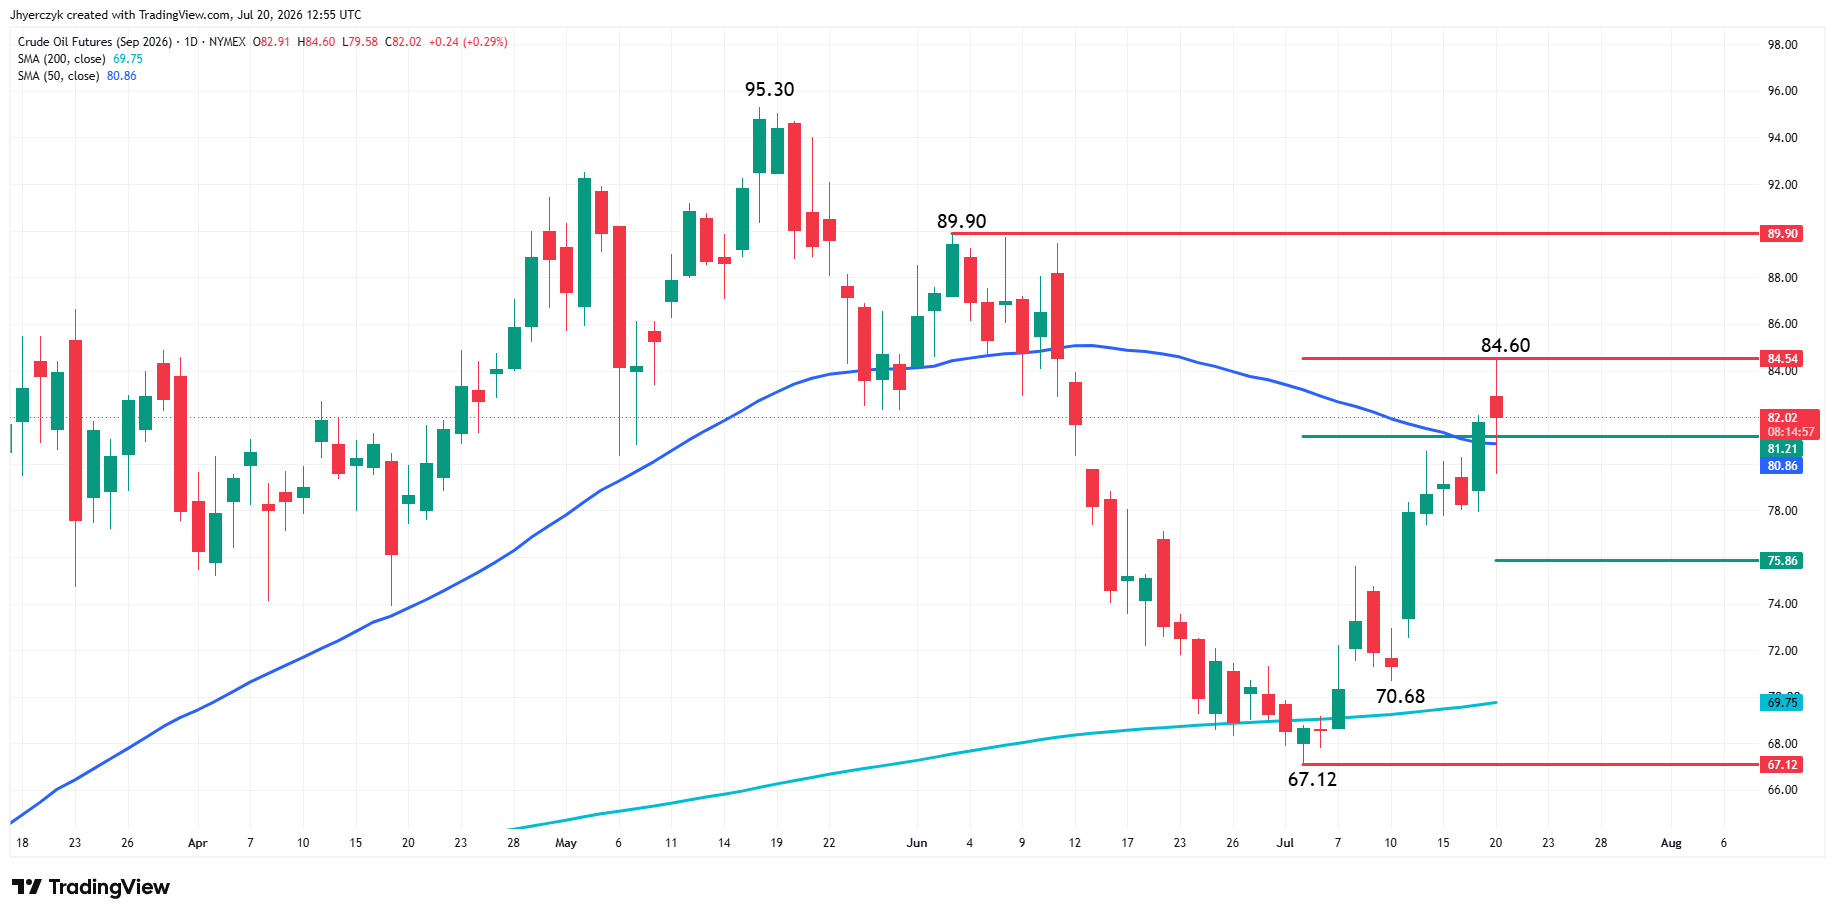
U.S. crude futures are at $80.96 per barrel, down 1.9%. Brent crude is near $87.03, down 1.2%.
The market trimmed war premium on the headline but the risk is not gone. Every diplomatic comment from Tehran has been followed by another night of strikes. The market is trading every report out of Tehran and Washington right now. A diplomatic headline can knock crude lower in minutes. Another attack, a shipping disruption, or a threat to energy infrastructure puts the bid right back. Gasoline back above $4 per gallon is the number that keeps the Fed rate debate alive.
Chips Are Bouncing, Not Reversing
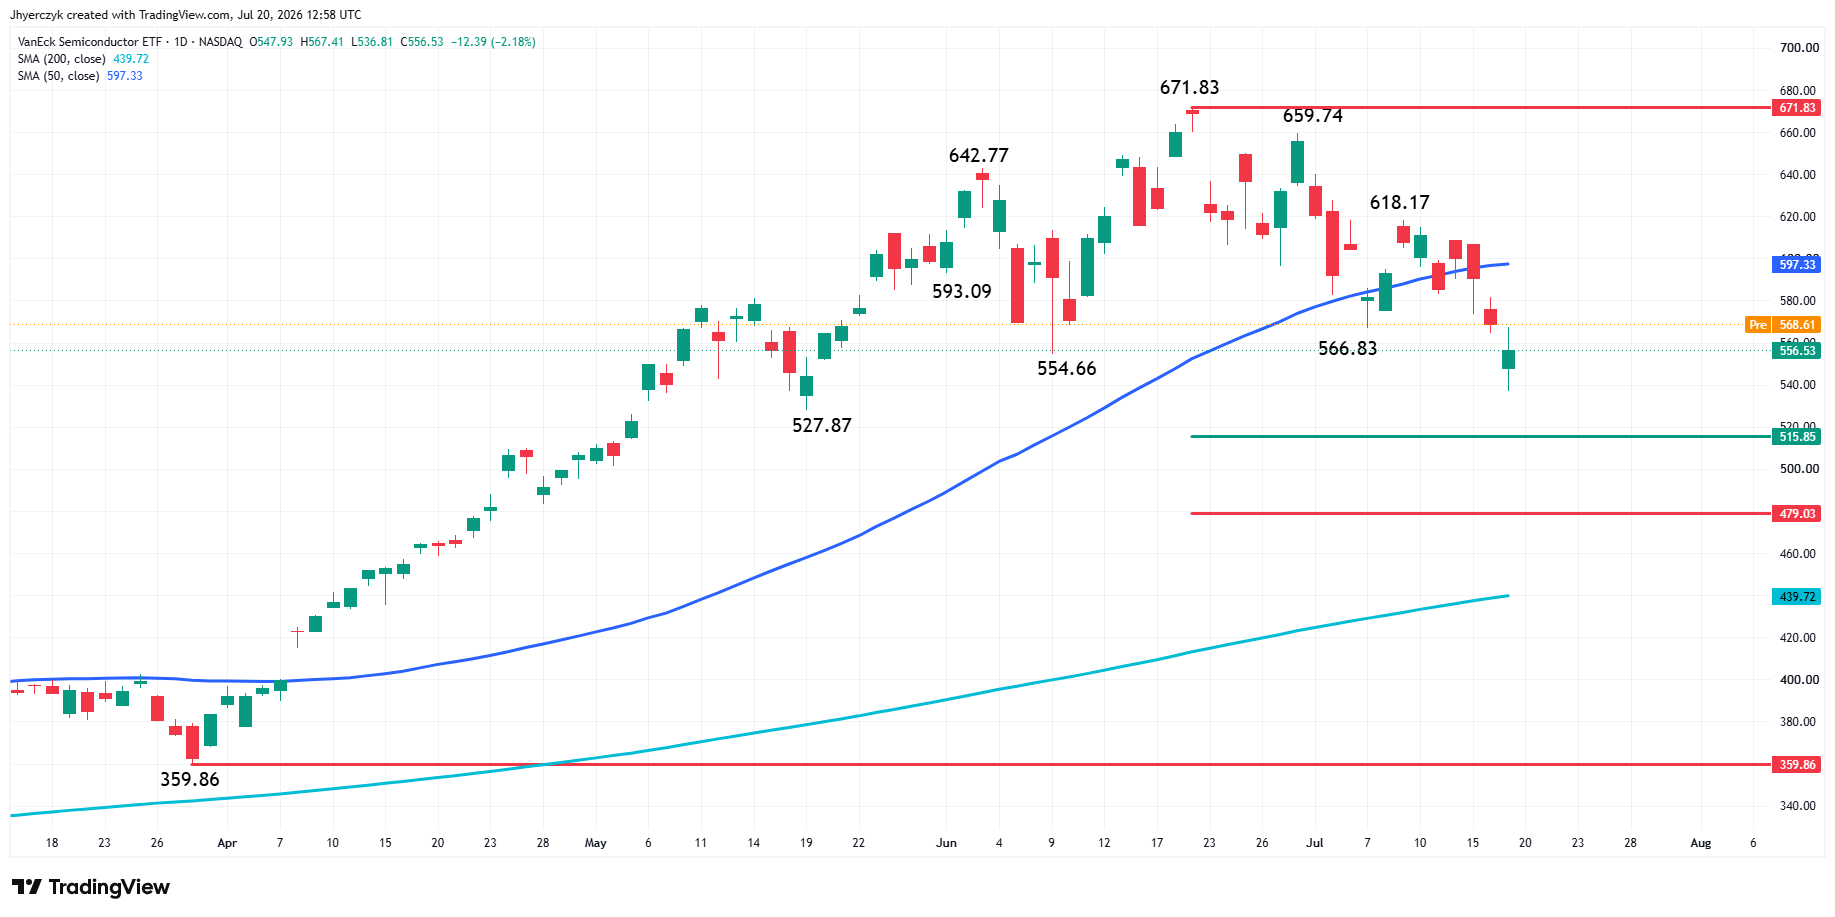
Semiconductors are leading the early advance after last week’s damage. The VanEck Semiconductor ETF is up more than 1% and the iShares Semiconductor ETF is up more than 2% in premarket trading. Micron is up more than 4%. AMD is higher by about 3.5%. NXP Semiconductors, Teradyne, Marvell Technology and Intel are all trading higher.
The group is getting short-covering and bargain hunting after the SOXX dropped 10% last week. The SMH posted its third weekly loss in four weeks, falling nearly 9%. The selling was concentrated in technology and the bounce is concentrated there this morning. This is a relief rally from oversold conditions, not a reversal. Buyers still have to show they are willing to hold positions after the open.
Yields Limit the Upside for Growth
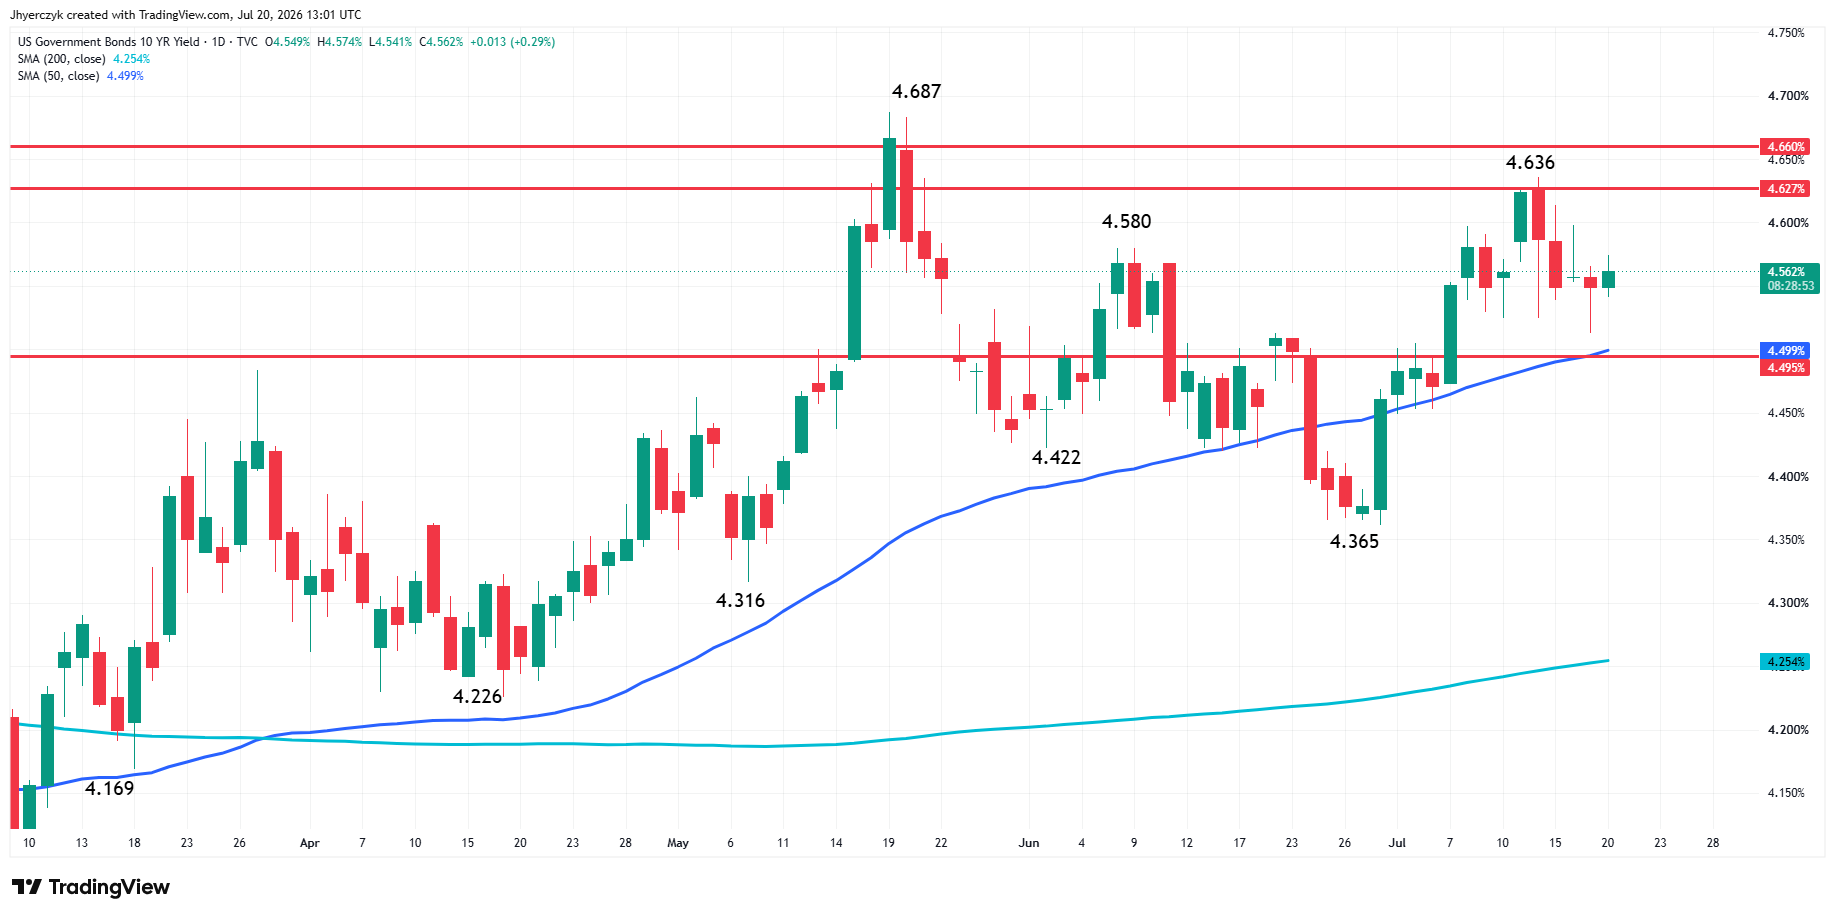
Treasury yields are slightly higher and limiting how far the chip bounce can carry. The 10-year yield is up more than one basis point at 4.558%. The 30-year yield is at 5.078%. The 2-year is nearly unchanged at 4.181%.
The 10-year is the level to watch today. Chip stocks are trying to recover but expensive growth names will not build follow-through with yields still pressing higher. The crude oil pullback helped growth stocks this morning, but if oil reverses and the 10-year moves back up, the chip rebound loses its fuel fast.
Premarket Movers
Alibaba is up more than 3% after previewing its Qwen3.8 Max artificial intelligence model. The company says the model ranks behind only Anthropic’s Fable 5 among the leading AI systems. Domino’s Pizza is up more than 7.5% after second-quarter revenue topped expectations and order growth accelerated in both delivery and carryout. Traders bought the growth signal over the earnings miss.
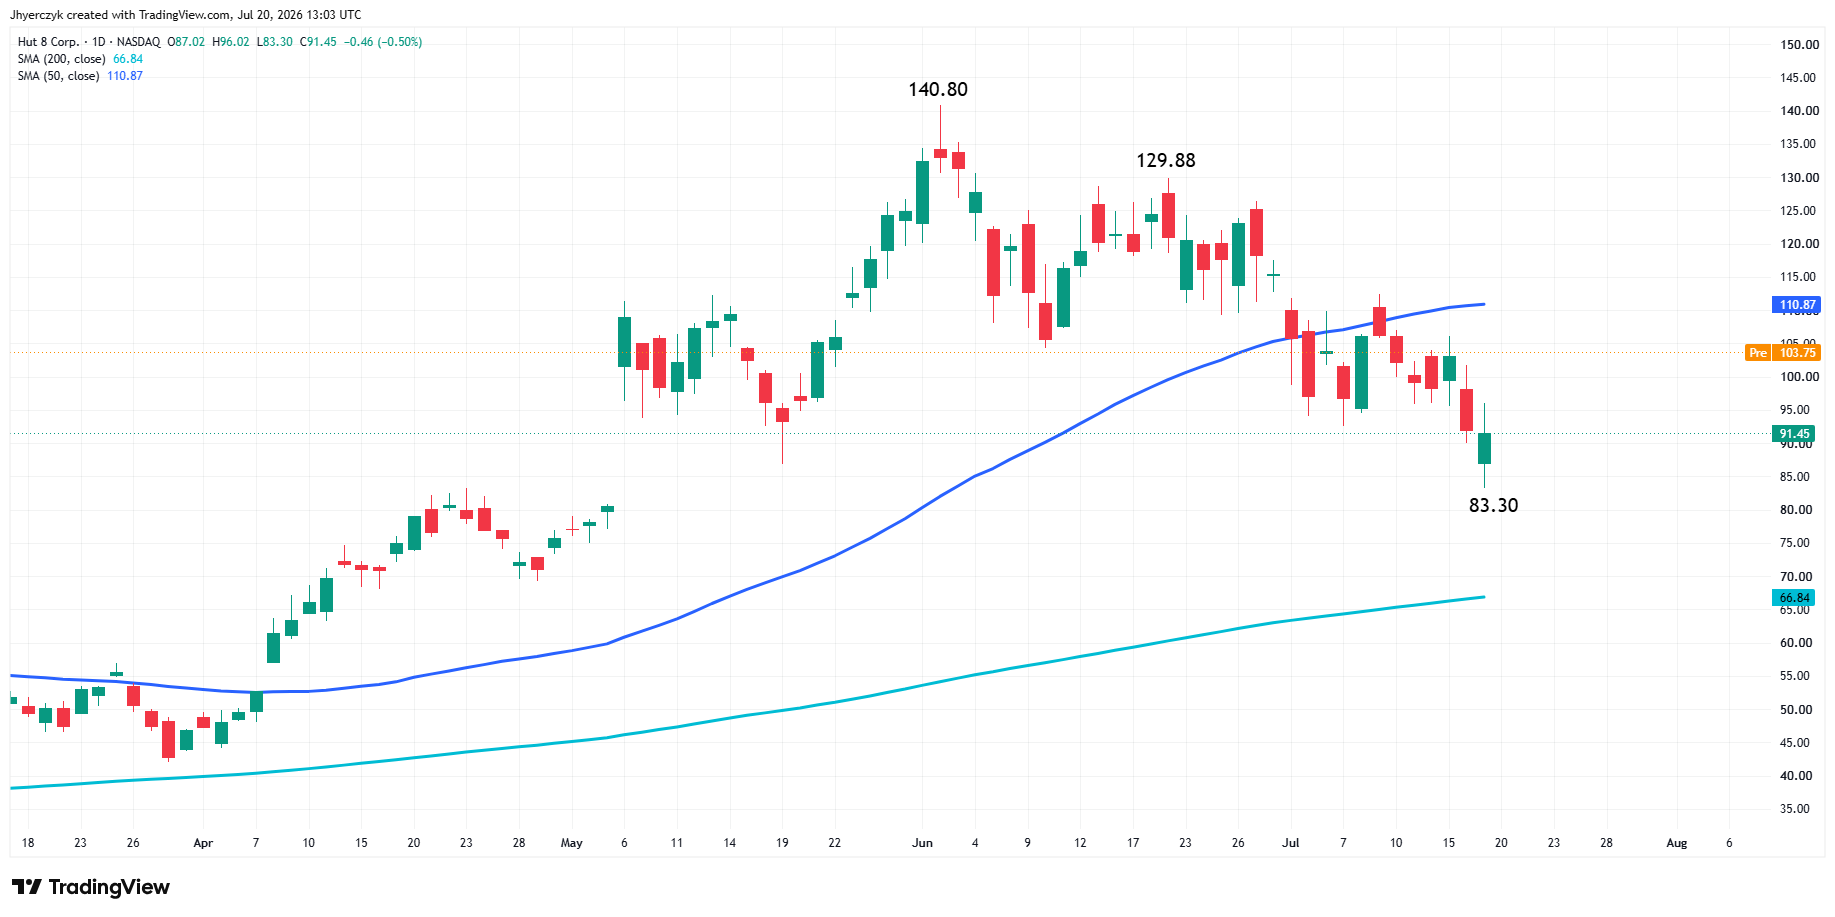
Hut 8 is higher by about 12% after signing a 15-year lease that fully commercializes its 1-gigawatt Beacon Point data center in Texas. The deal is valued at $9.8 billion. Yeti Holdings and Urban Outfitters are each up more than 4.5% after Goldman Sachs upgraded both to Buy. SpaceX is up more than 1% after moving its next Starship launch attempt to Thursday.
What to Watch
The chip rebound is giving futures a lift but crude oil still has the bigger say in direction. The Iran diplomacy headline pulled some war premium out this morning, but nine straight days of U.S. strikes say the risk has not left. If another attack pushes oil back higher, the same growth stocks leading this bounce are the first names traders sell. Gasoline at $4 per gallon means the next oil move goes straight into the inflation outlook.
The 50-day moving average has been the anchor for the S&P 500 all month. The index is hovering right around it and that level is doing all the work. A sustained move above it opens the path toward the record high. A failure here keeps the market chopping in the range that has controlled the price action since the conflict escalated.
More Information in our Economic Calendar.