


SPCX Technical Analysis
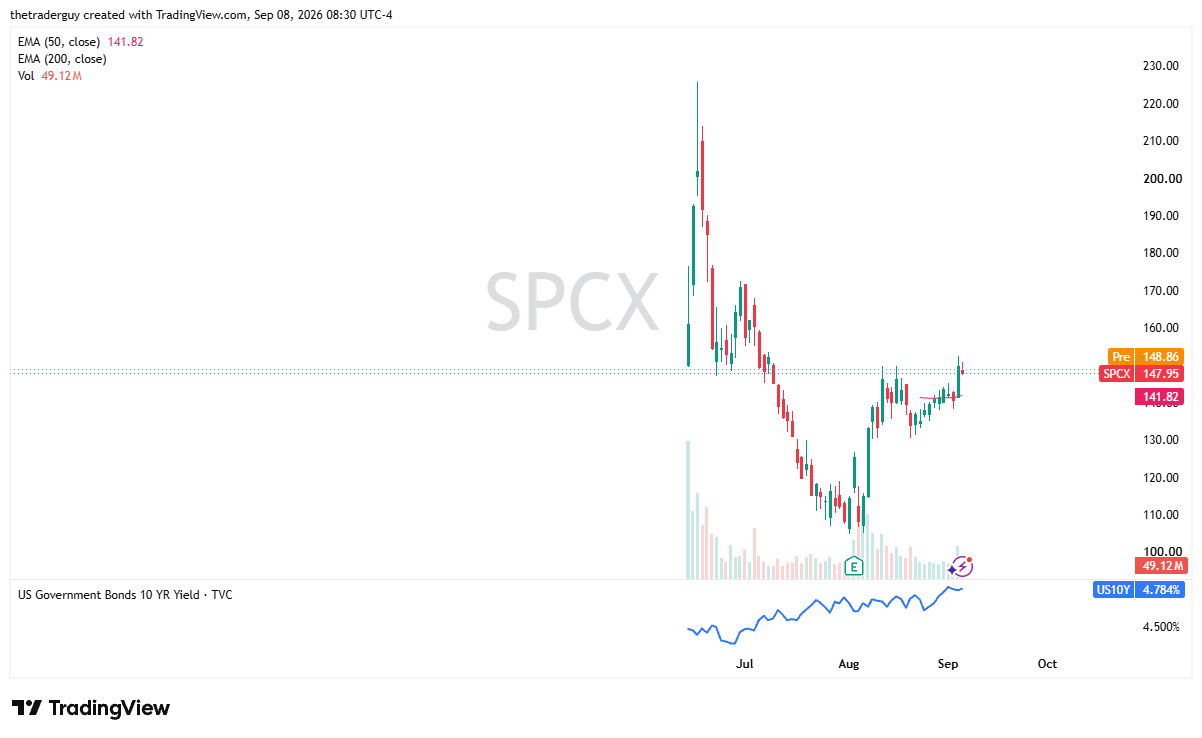
SpaceX is down a little bit from the previous session, but it does look like it’s trying to turn things around in pre-market trading, as it has since jumped a bit. This is an area that I find very interesting with SpaceX, right around $150. It seems like a pretty significant barrier.
The stock is consolidating currently after a strong recovery. The current debate is increasingly about valuation versus execution. Q2 revenue reached $7.8 billion, up 92% year over year, while adjusted EBITDA rose sharply, but the company is also carrying extremely heavy capex tied to Starship, Starship V3, and AI infrastructure.
Share supply is experiencing a little bit of lockup-related volatility as more stock became freely tradable. We did see a big selloff, but an additional staged lockup remains a little bit of an overhang.
TSLA Technical Analysis
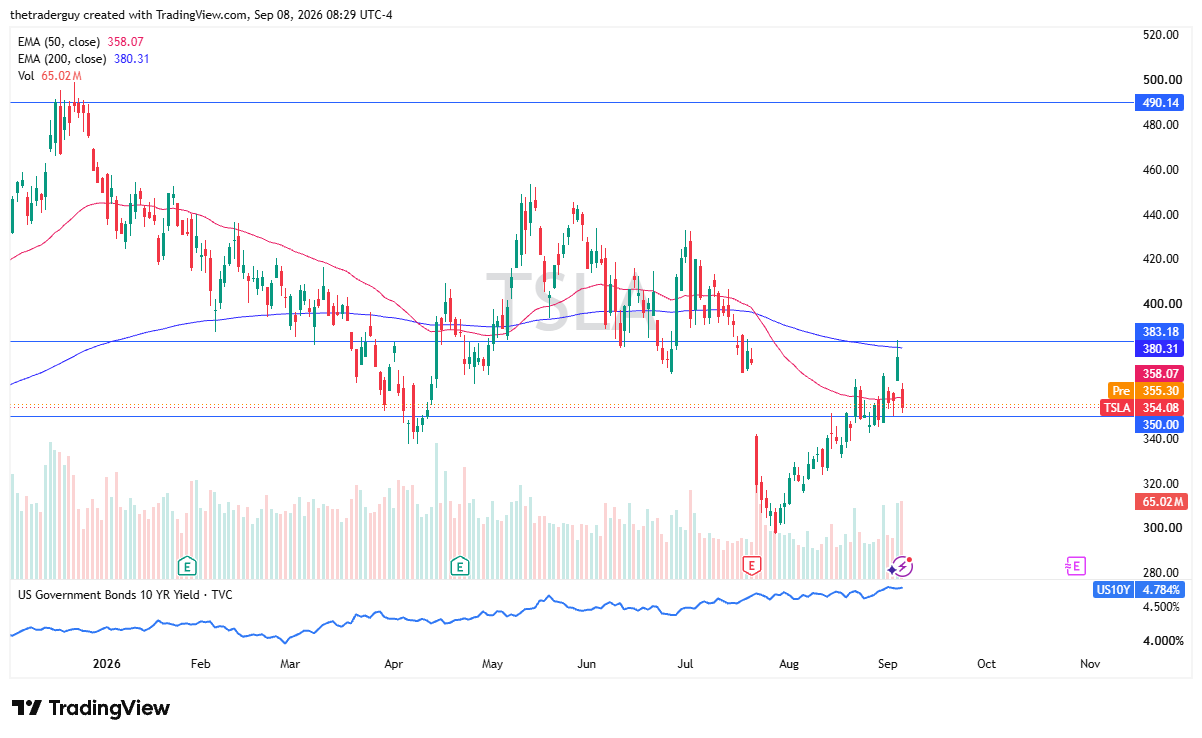
The market for Tesla looks like it is trying to recover a little bit. It remains caught between the traditional EV business and the much larger valuation narrative around FSD, Cybercab, and autonomous driving.
The most important news today right now is a little bit mixed. Tesla has gotten approval in Slovenia for FSD Supervised, becoming the sixth EU country to allow it ahead of a broader European vote.
At the same time, Tesla’s Cybercab rollout is facing some regulatory scrutiny, which directly hits the part of the story investors are currently focused on.
This combination explains a conflicted tape, but when we look at the technical analysis, we just bounced from the 200-day EMA after filling a gap, and now we’re testing an area that previously had been supported.
A little bit of consolidation from a technical analysis standpoint would make a certain amount of sense.
SMCI Technical Analysis
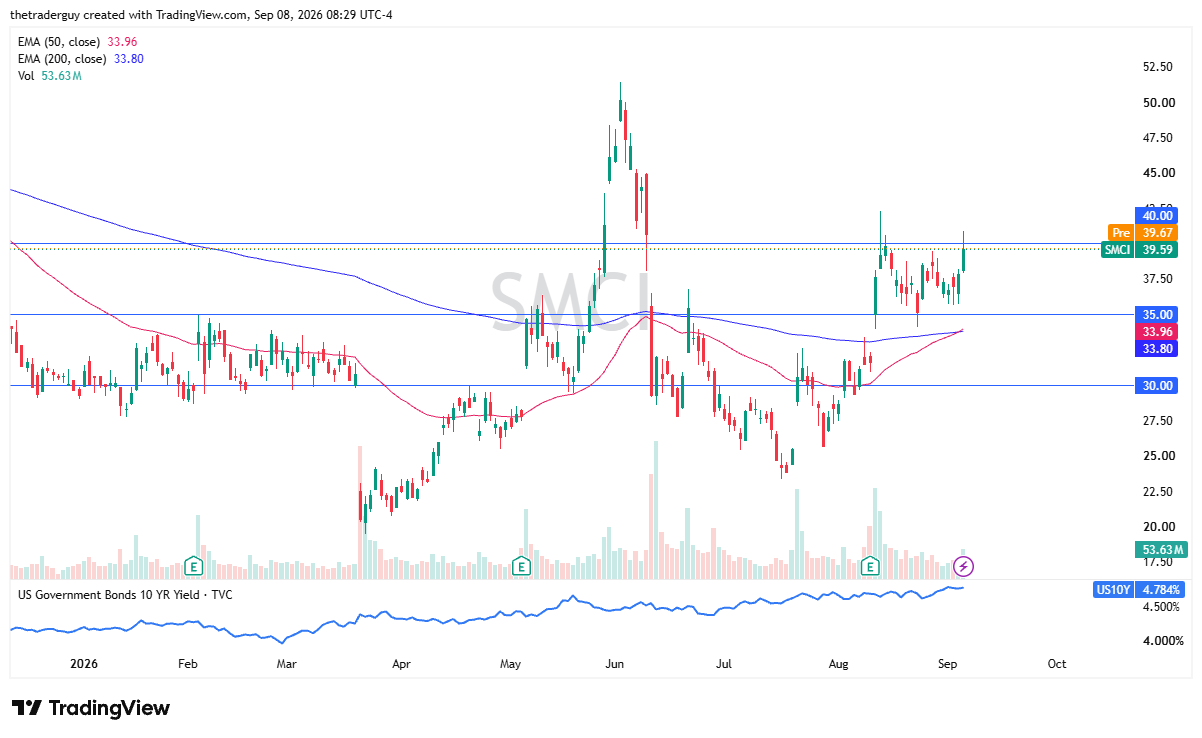
Then finally, Super Micro Computer. It remains one of the more volatile AI infrastructure plays out there, but its underlying revenue momentum has strengthened substantially.
The core catalyst right now is the fiscal 2027 guidance. Super Micro Computer has projected revenue of approximately $65 billion to $72 billion, dramatically above the $52 billion that analysts had expected. AI server demand remains exceptionally strong.
Fiscal 2026 revenue reportedly approached $39 billion, and backlog remains elevated. Gross-margin durability remains questionable for the longer term, so that is one headwind.
And then it did experience about $7 billion in cash flow, raising questions about how aggressively growth could be financed.
Nonetheless, we are getting the Golden Cross here, and this does suggest a certain amount of support. It does look like the $35 level offers a short-term floor as well, so with all of that being said, the bulls are still certainly making their presence known.
If you’d like to know more about technical analysis and how traders use it, please visit our educational area.