
US Dollar News: PCE and Warsh Put Fed Outlook Back in Focus
For the first trading session of August 26th, the U.S. dollar is holding tight due to market anticipation of the July PCE inflation report as well as market forecasts of the first Fed Chairman Jackson Hole speech by Kevin Warsh. A more hawkish timing for a potential September rate pause by the Fed seems to be the more prevalent market opinion, with the July PCE inflation report likely to reinforce that opinion or counter it and push the market towards an additional rate hike. Collins, Boston Fed President, said during the week that interest rates will need to go up unless core inflation (which is currently hovering around 3.3%) shows a material decline.
Fiscal policy is also a looking constraining. While Treasury attempts to stabilize long term yields by expanding its existing bond buyback programs, practices to support aggressive Treasury borrowing, have come back into the spotlight and prompted some to ask whether there is a real threat of “fiscal dominance” for a central bank. That is a theme that will almost definitely be addressed at Jackson Hole along with inflation and Fed independence.
The Euro, on the other hand, has a clearer and more pressing monetary policy environment. ECB Executive Board member, Schnabel, said that current policy remains accommodative and that rates will need to be raised higher in order to return inflation to target in a sustainable manner. ThisW applies especially in the current environment with elevated energy prices and re-enforces market expectations for a September rate hike.
Sterling is one currency impacted by the current divergence in narrowing policies. Even while inflation in the UK remains unacceptably high, growth has surprised to the upside, leaving the market not pricing aggressive easing. However, strong labor market conditions makes fast hiking a policy option.
For 26 August, the primary FX theme is uncertainty in U.S. inflation and Fed Policy versus clearer expectations for Euro zone rates, with PCE and the Jackson Hole summary by Richard Clarida and John C. Williams, the likely new Fed Vice Chair, as the likely dominant topics.

U.S. Dollar Index Technical Analysis: DXY Stays Bearish Below 99.41 as Recovery Struggles
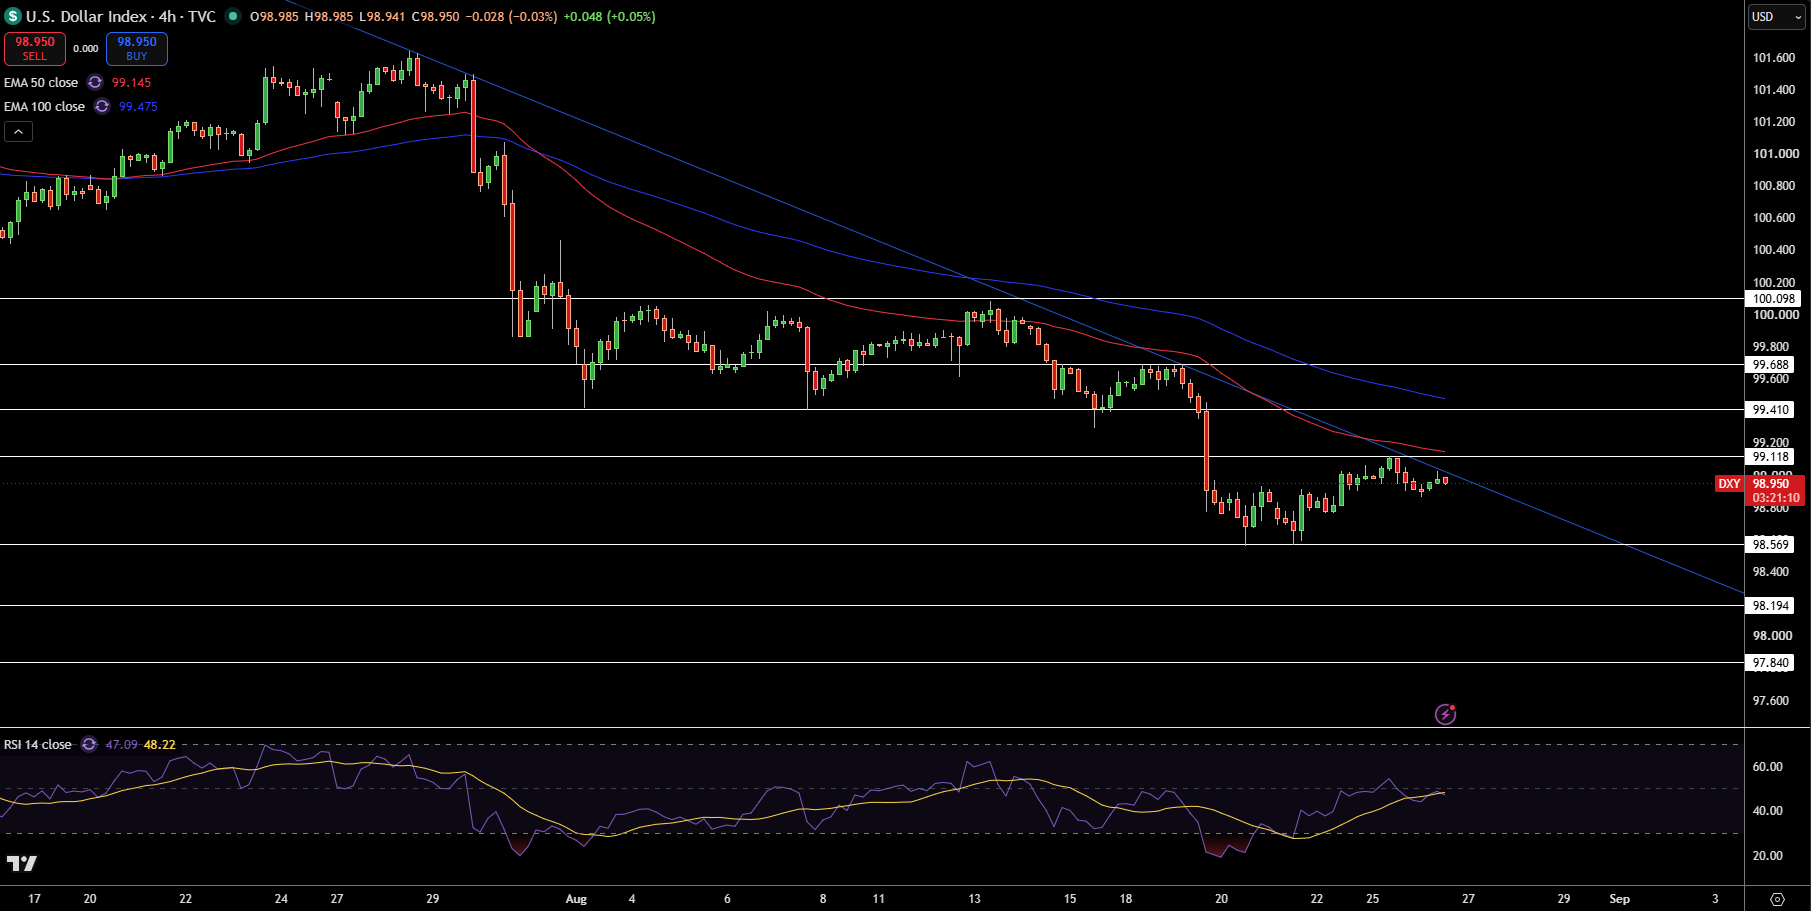
The U.S. Dollar Index sits at 98.95 on the 4-hour chart, and price is still being contained within a clear descending channel. DXY is still below the 50-EMA at 99.15, and the 100-EMA at 99.48, keeping the short-term trend bearish, despite the recent stabilization above the August lows. The descending channel has capped multiple attempts to continue this rebound, and the latest rebound was rather shallow.
RSI is at 47, indicating momentum is not yet strong enough to indicate a bullish reversal, but it has at least recovered from oversold territory. Immediate resistance is at 99.12 with 99.41, 99.69, and 100.10 above that. Support is at 98.57, 98.19, and 97.84.
I maintain my bearish outlook for DXY until it trades above 99.41. A break above that would strengthen the recovery case, and expose 99.69 – 100.10, but a break even lower to below the moving averages would quickly send the Index down to 98.57. A confirmed break below 98.57 would heavily strengthen the bearish trend.
EUR/USD Price Forecast
Every new EUR/USD analysis as it publishes, today's technical signal and key levels, live price — on one page.
See all EUR/USD forecastsGBP/USD Technical Analysis: Pound Consolidates Below 1.3656 as Rising Channel Supports Bulls
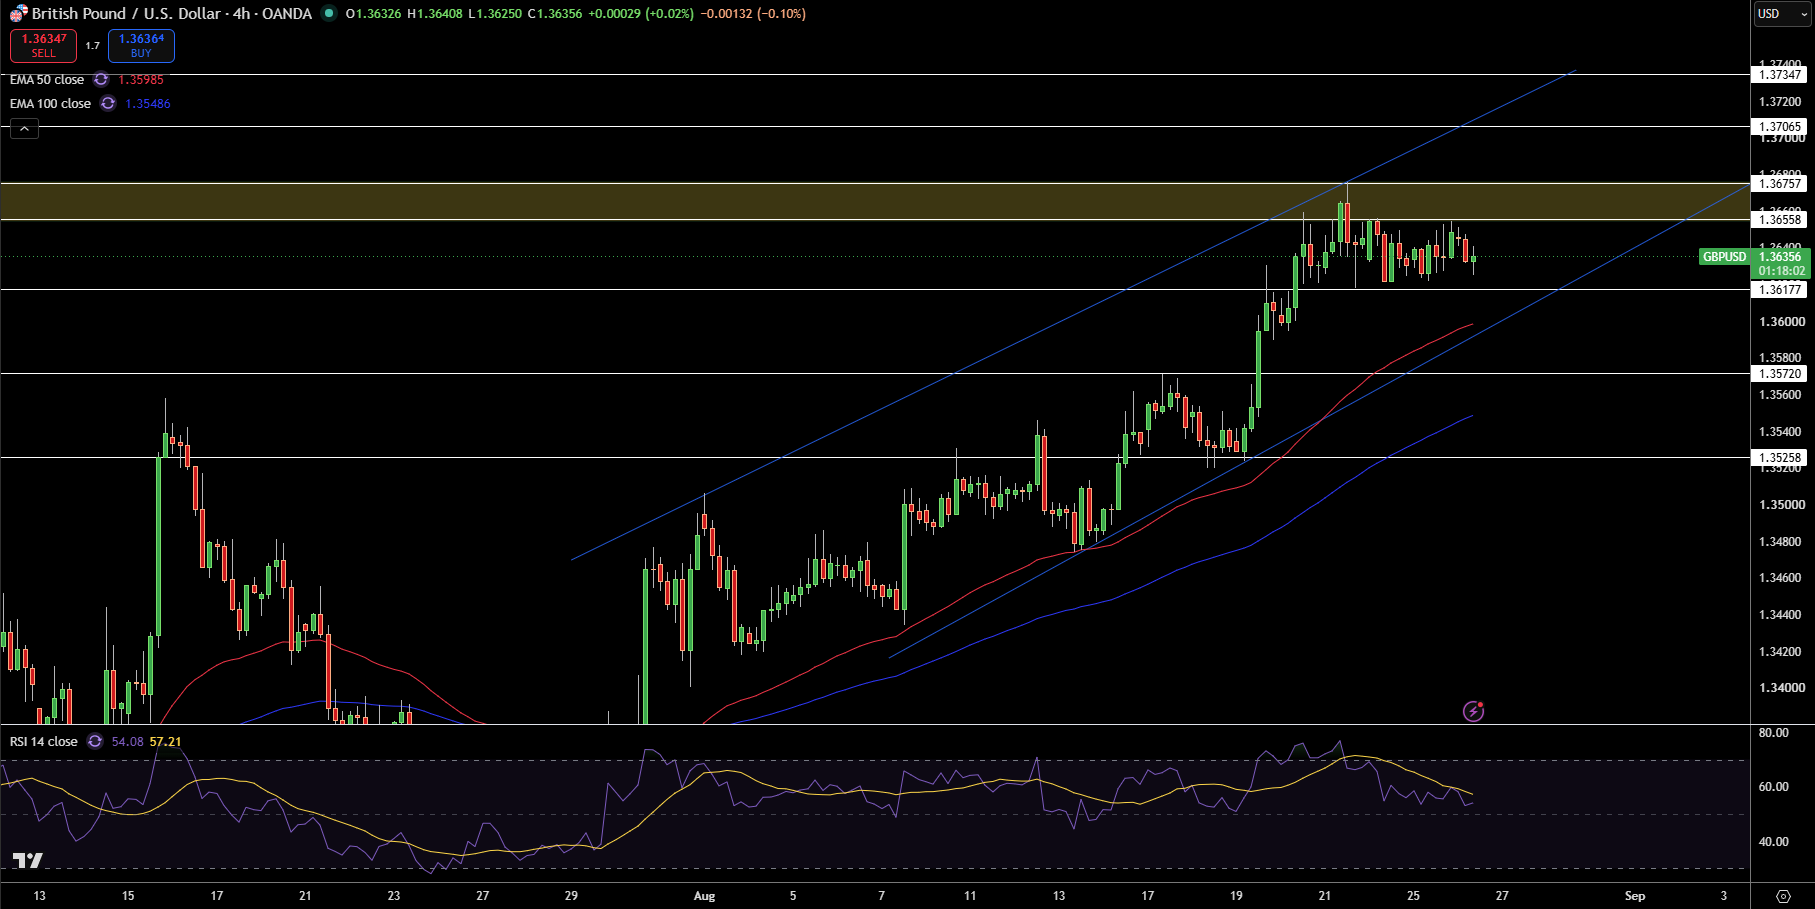
At the 4-hour chart, GBP/USD is seen at 1.3636, and is consolidating slightly below the 1.3656-1.3676 resistance zone. The pair is above the 50-EMA at 1.3599 and the 100-EMA at 1.3549, as the broader rising channel continues to support a bullish bias. Recent price action has been seen as sideways compression rather than selling, leaving the buyers in control of price action at higher levels.
RSI is at the 54 level, indicating neutral to bullish momentum after coming down from overbought territory. The resistance levels can be seen at 1.3656 and 1.3676, with 1.3707 and 1.3735 following. These are counteracted by the support levels of 1.3618, 1.3572, and 1.3526.
In this opinion, GBP/USD will maintain a bullish bias as long as price action is held above 1.3618. A clear break above the resistance levels of 1.3656 and 1.3676 would impart a bullish bias toward 1.3707 and 1.3735. A sustained break below the 1.3618 level would invalidate the bullish structure and shift the bias to 1.3572.
EUR/USD Technical Analysis: Euro Holds Above 1.1658 as Bulls Defend Rising Support
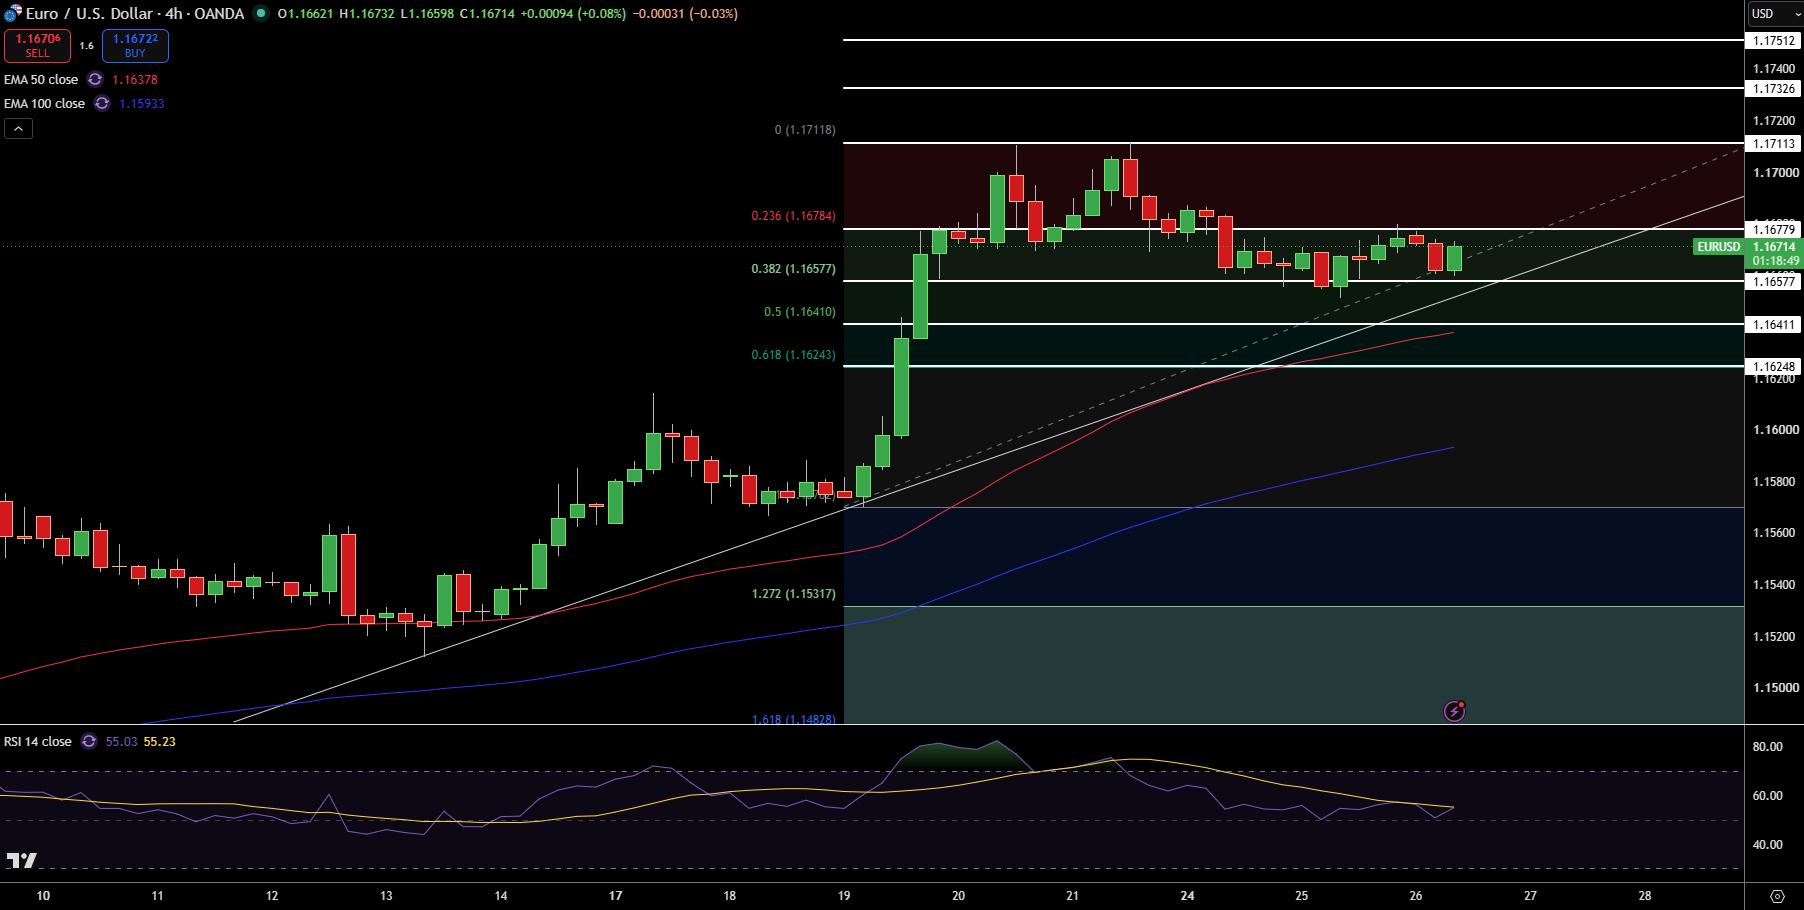
EUR/USD is at 1.1671 on the 4-hour chart, consolidating below the resistance area at 1.1711. The pair is above the 50-EMA at 1.1638 and the 100-EMA at 1.1593, preserving the overall bullish structure. Price is also above an ascending trendline, and has retraced roughly 38.2% to support, which is at 1.1658.
RSI stands at 55, indicating a small bullish momentum and slight overbought territory. Immediate resistance is expected around 1.1678, and is expected to be met around 1.1711, 1.1733, and 1.1751. Also, expected area of price support is at 1.1658, followed by 1.1641 and 1.1624.
At these levels, I believe the EUR/USD remains bullish as long as it is trading above 1.1658. If the price breaks 1.1678 to the upside, further bullish continuation towards 1.1711 is highly probable. On the other hand, a break of 1.1641 to the downside could signal the beginning of a more substantial move to the downside towards 1.1624 and the upward trendline.