
US Dollar News: Sticky PCE Lifts Fed Hike Risk Before Warsh
The U.S. dollar opens August 27 with buying after July inflation was slightly hotter than expected. The PCE price index climbed 0.2% month over month and 3.7% year over year, versus the 3.6% annual expected, while core PCE increased 0.2% and remained at 3.3%. This data has pushed market pricing in favor of a September Fed rate hike, however, a hold is still the more likely scenario. Markets wait for clarity on Fed Chair Kevin Warsh’s Jackson Hole speech on whether persistent inflation is greater than weaker consumer and labor market signals.
The euro’s performance is better relative to the rest of the majors due to the inflation challenges facing the ECB. Recent euro area data showed business activity growth, and even with ongoing energy costs and supply disruptions, the path back to the ECB’s 2% goal is beginning. This leads to expectations for further tightening despite uneven growth.
Expectations for revised tightening to soothe the inflation challenges currently pressing the BoE have weakened and slowly cooled. However, the still high inflation environment has emerged as a clear concern for the BoE, keeping it in a demand fallacy. Tuesday’s revelations by Reuters that recent movements in Sterling were being driven by expectations of U.S. policy rather than domestic factors was well indicated.
For August 27, the main FX theme is a slight increase in the risk of Fed-hikes due to sticky PCE, although steady expectations for European rate hikes continue to prevail. The main focus for the dollar is the messaging of Warsh at Jackson Hole, while the euro and pound maintain their sensitivity to whether their respective central banks can maintain their policies with the threat of limiting growth.

U.S. Dollar Index Technical Analysis: DXY Tests 99.12 as Descending Structure Caps Recovery
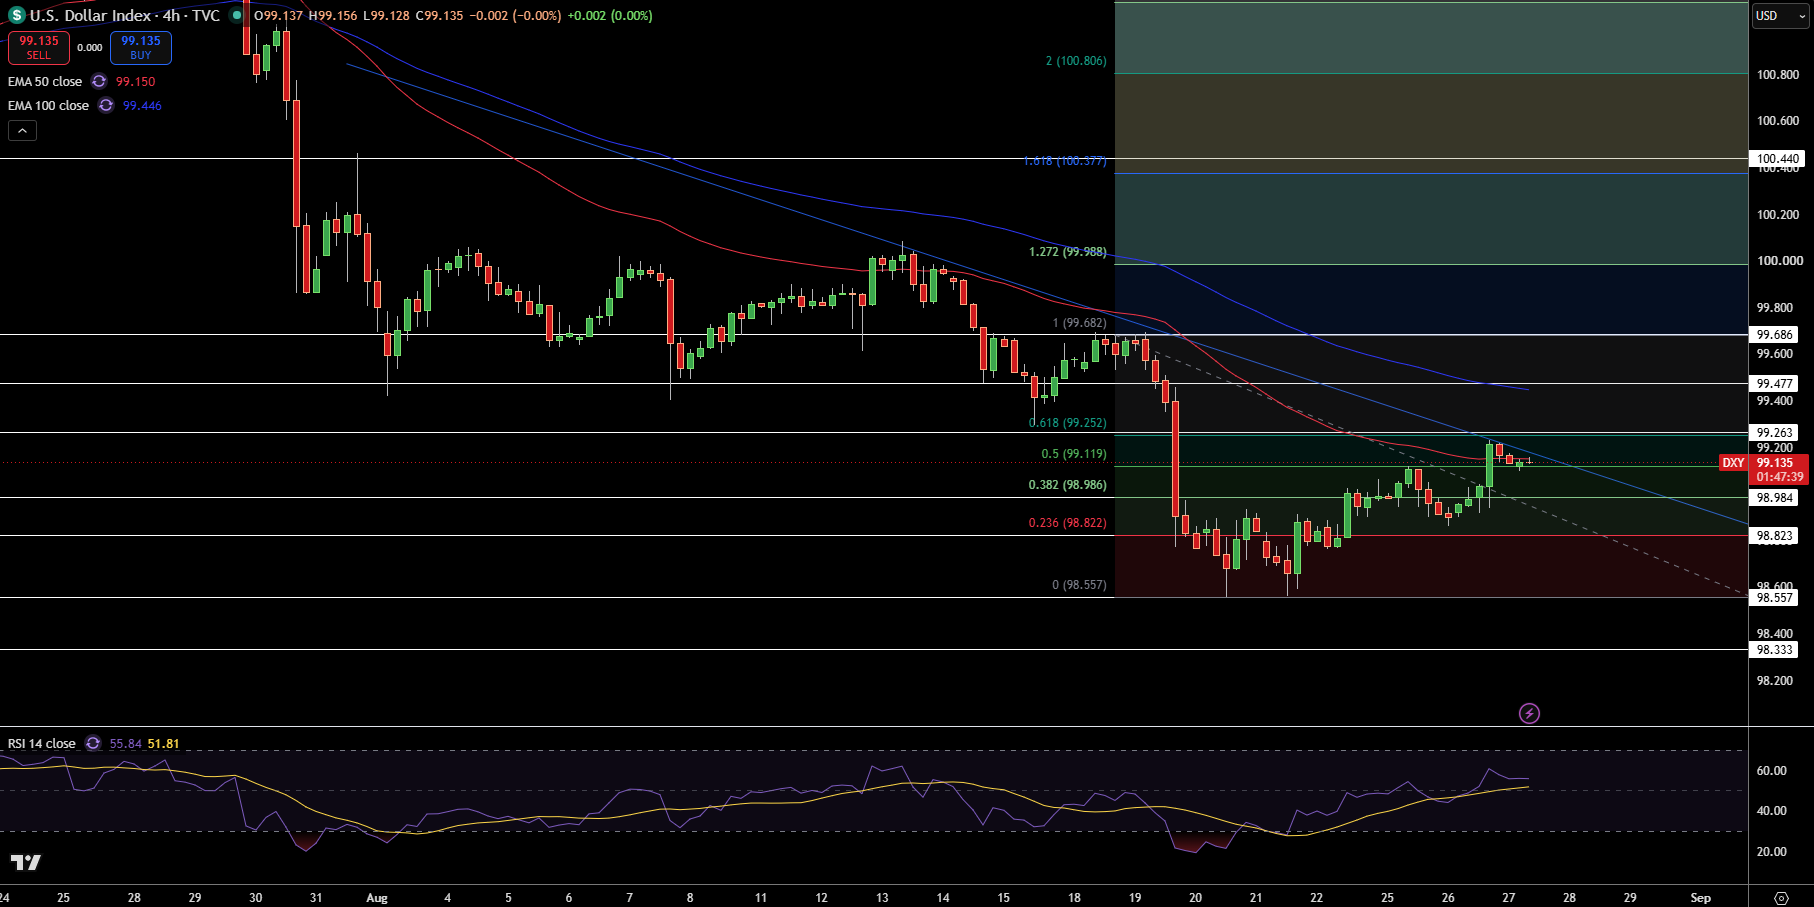
Currently, the DXY is trading at the 99.14 area on the 4-hour chart as it rebounded from the 98.56 area. The DXY has recovered from the lower levels, however, it remains below the 100-EMA at the 99.45 area and is still contained within the descending trendline in the area of the 99.15 area. Thus, the overall structure remains bearish despite the recovery.
The RSI is currently at the 56 area. This shows that the price has recovered some value, however, resistance is currently located at 99.12 – 99.26, which is followed by resistance at the 99.48 area, the 99.69 area and the 99.99 area. The first area of support is located at 98.99, followed by the 98.82 area, the 98.56 area and the 98.33 area.
According to my analysis, the DXY is attempting to form a corrective rebound. This rebound will remain contained below the areas of 99.26 and 99.48. A break above these areas would allow the price to retest the 99.69 area. If the DXY begins trading below the descending trendline, then the price would likely retest the 98.82 and 98.56 areas.
EUR/USD Price Forecast
Every new EUR/USD analysis as it publishes, today's technical signal and key levels, live price — on one page.
See all EUR/USD forecastsGBP/USD Technical Analysis: Pound Pulls Back to 1.3598 as Rising Channel Faces Key Test
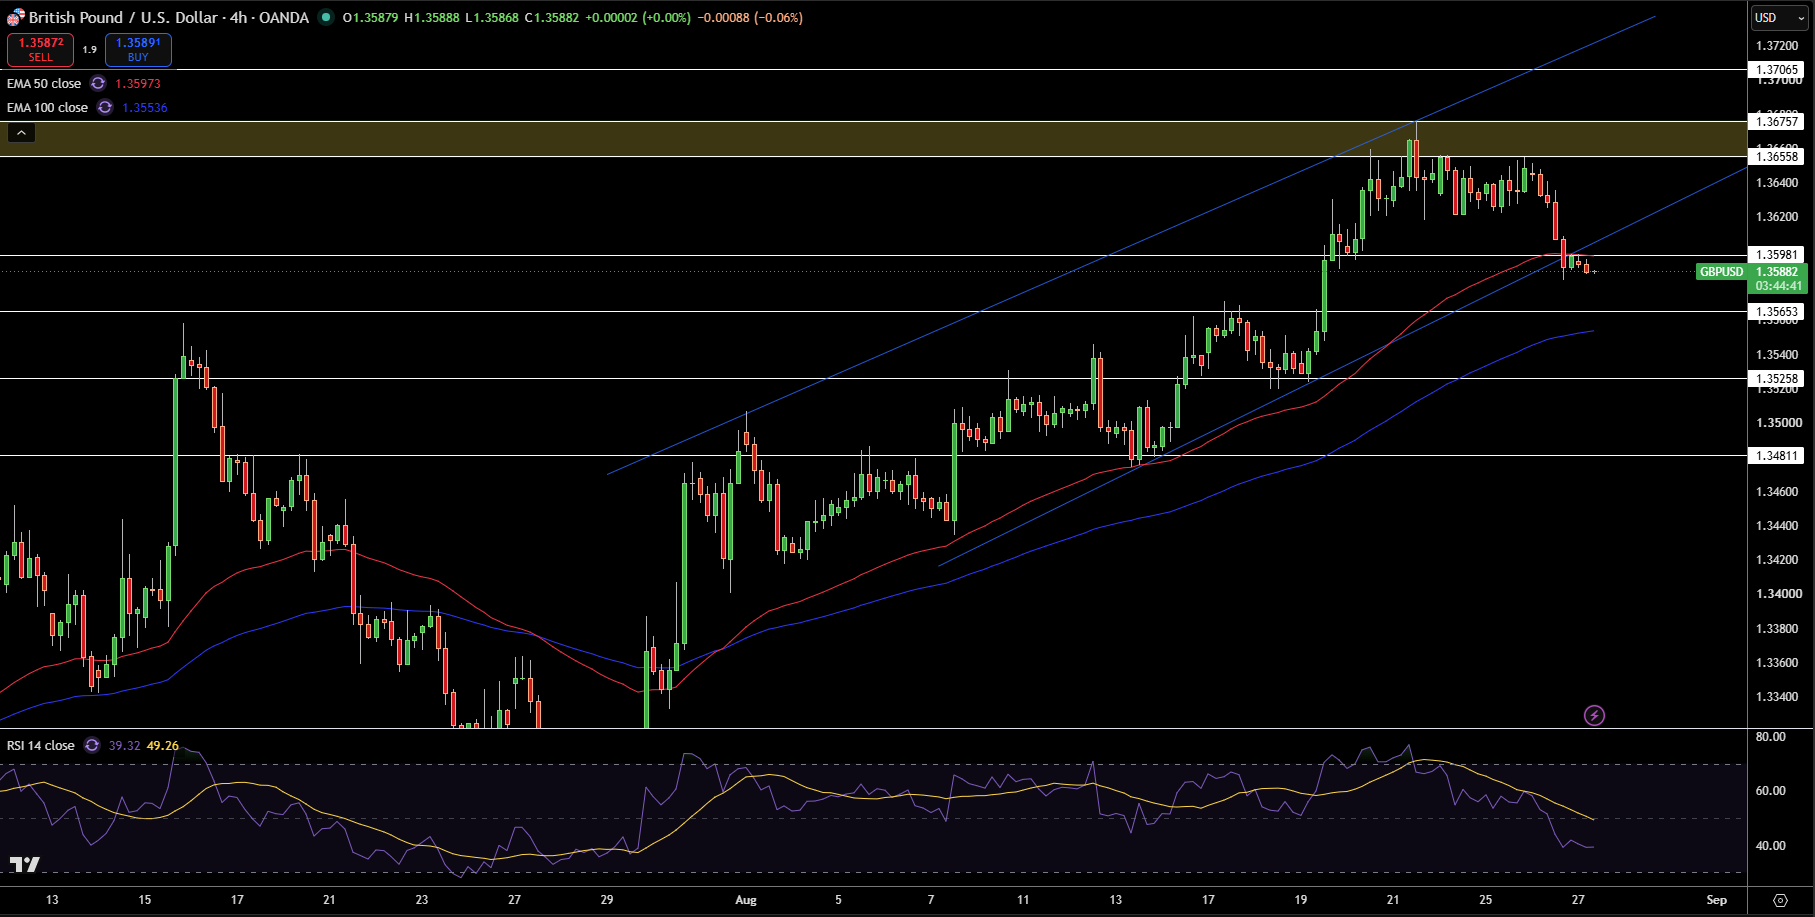
GBP/USD is trading at 1.3588 and has retreated sharply from the 1.3656 – 1.3676 resistance zone on the 4 hour chart. The pair is currently testing the lower boundary of the rising channel at 1.3597 and is trading immediately below the 50 EMA. The 100 EMA lies at 1.3554, further indicating positive price action, but the latest downward movement has undoubtedly weakened the overall short term momentum.
RSI is at 39, implying negative slope for price and control resistance in the 1.3565 zone. If price continues to the downside, support can be expected at the 1.3526 and 1.3481 zones. Resistance can be expected at the 1.3598 zone, followed by 1.3656 – 1.3676 and 1.3707 zones.
GBP/USD is currently at an important technical decision. Trading above 1.3565 and the rising channel would likely lead to a recovery toward 1.3656. Trading below 1.3565 would be a clear negative sign, likely leading to a drop to 1.3526.
EUR/USD Technical Analysis: Euro Holds Above 1.1641 as Pullback Stabilizes
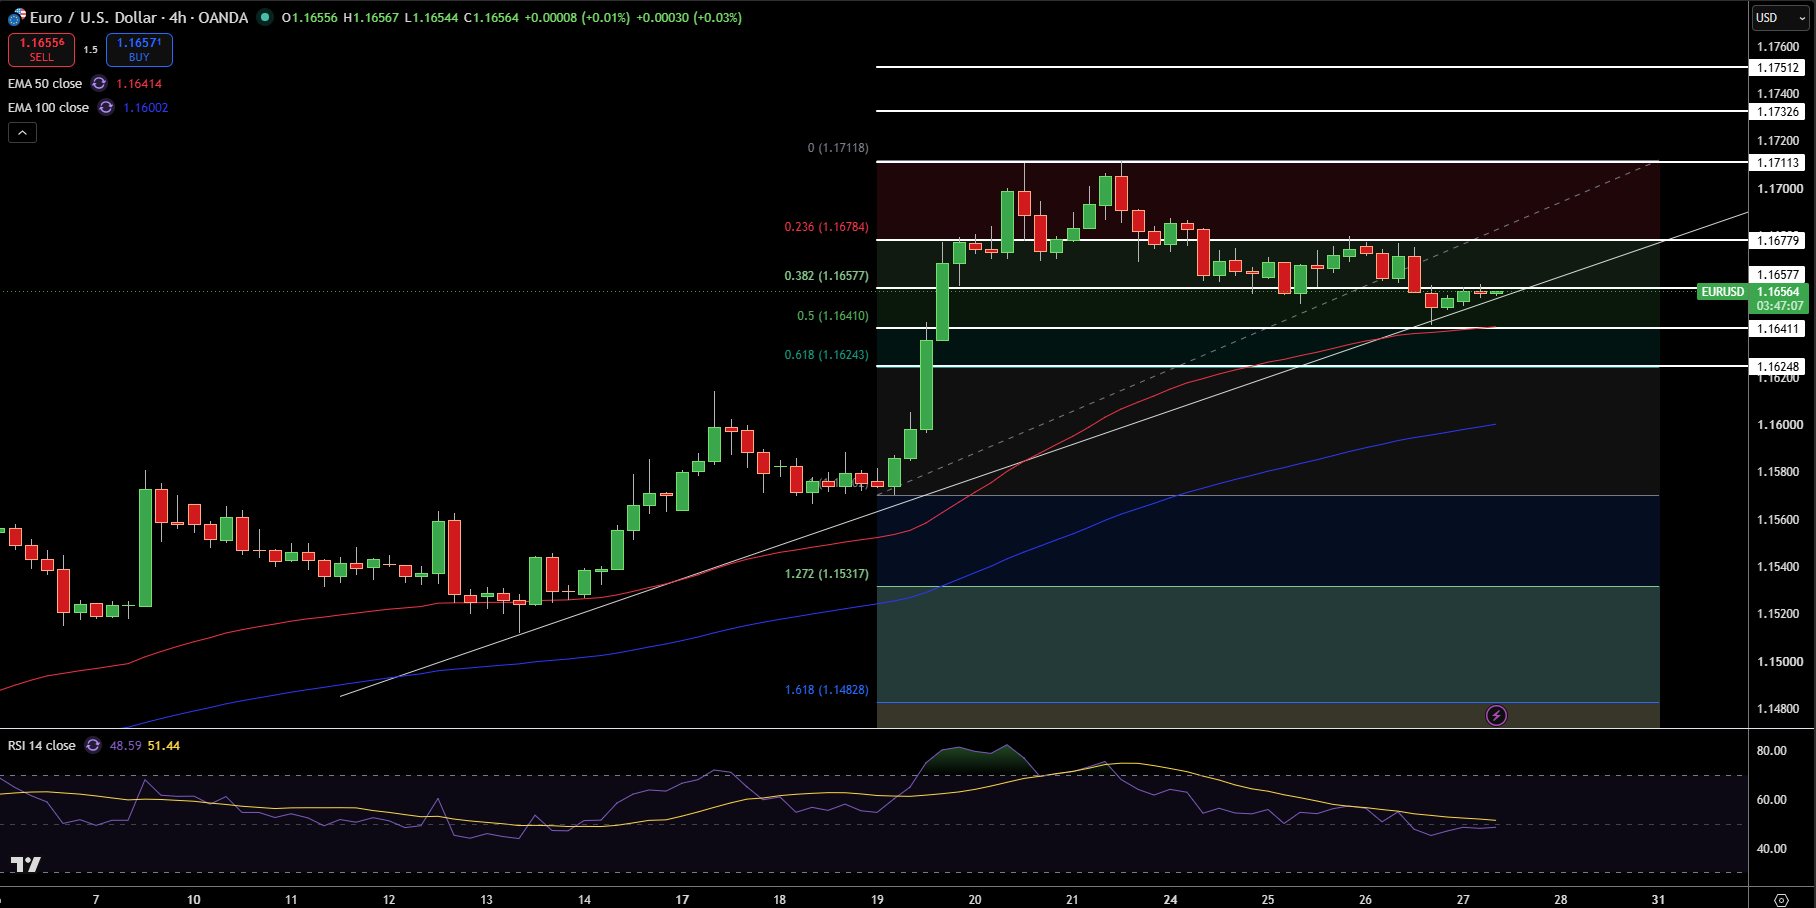
EUR/USD is currently trading at the 1.1656 area on the 4-hour chart after correcting from the 1.1711 area. EUR/USD has been trading above the 50-EMA at the 1.1641 area and the 100-EMA at the 1.1600 area. In addition, the overall structure is bullish as price has traded inside an ascending channel over the last few trading sessions without violating the upper boundaries of the channel.
RSI is at 49, which puts it in neutral territory after an overbought zone earlier. EUR/USD is supported at 1.1641, then 1.1624, and then 1.1600. Resistance may be found at 1.1658, then 1.1678, 1.1711, 1.1733, and 1.1751.
In my opinion, EUR/USD is still trading bullishly as long as it is trading above 1.1641, with potential for more gains up to 1.1678, and then perhaps even 1.1711. A break below 1.1641 would be bearish and likely take us back to the 1.1624 and 1.1600 support zones.