
US Dollar News: Soft ADP Data Tests Fed Hike Conviction
The greenback has begun the month with its momentum challenged by the more recent labor data. The August ADP report was 38,000 compared to the 48,000 report that economists expected, and also showed a loss of jobs in manufacturing as well as professional and business services. The report supports signs of cooling hiring, and was lower for Treasury yields. Even with the reports, futures still hint at a 60%–65% likelihood of a rate hike in September by the Fed. Fed Chair Kevin Warsh also kept a hawkish stance at Jackson Hole with his speech, keeping expectations of a rate hike high. Friday’s employment data will be the last big report with the potential to change expectations, and a weak report will drop the likelihood of a rate hike.
The euro still supports a firm policy with eurozone inflation reaching 3.3% in August from July’s 2.9%. This increase was largely due to the Iran conflict and the resulting energy costs. The markets have priced in the expected 25 basis point increase with the deposit rate most likely to reach 2.50% for this hike. With core inflation reaching 2.4%, a more cautious slow pace of tightening is expected, rather than a prolonged hiking period.
Sterling is facing the harder of the two domestics. Gilt yields for the ten year have reached their highest level since 2007 at 5.294% with energy costs, inflation, and fiscal concerns and spending all reaching a high prior to the October budget. The BoE is still expected to hold Bank Rate at 3.75% in September, but a 25 basis point hike is expected in the coming year at later dates.
The movement of the FX theme for September 3 is expected to be data-dependent. Soft U.S. hiring diminishes the conviction of the Fed Funds rate hike, and the ECB retains the most compelling case for forward tightening. In the meantime, fiscal stress is holding back GBP, despite higher than desired inflation.
For September 3, the FX theme appears to be increasingly data dependent. Soft U.S. hiring diminishes the conviction of the Fed Funds rate hike, and the ECB maintains the most persuasive case for front-running tightening.

U.S. Dollar Index Technical Analysis: DXY Breaks Rising Structure as 99.12 Support Comes Into Focus
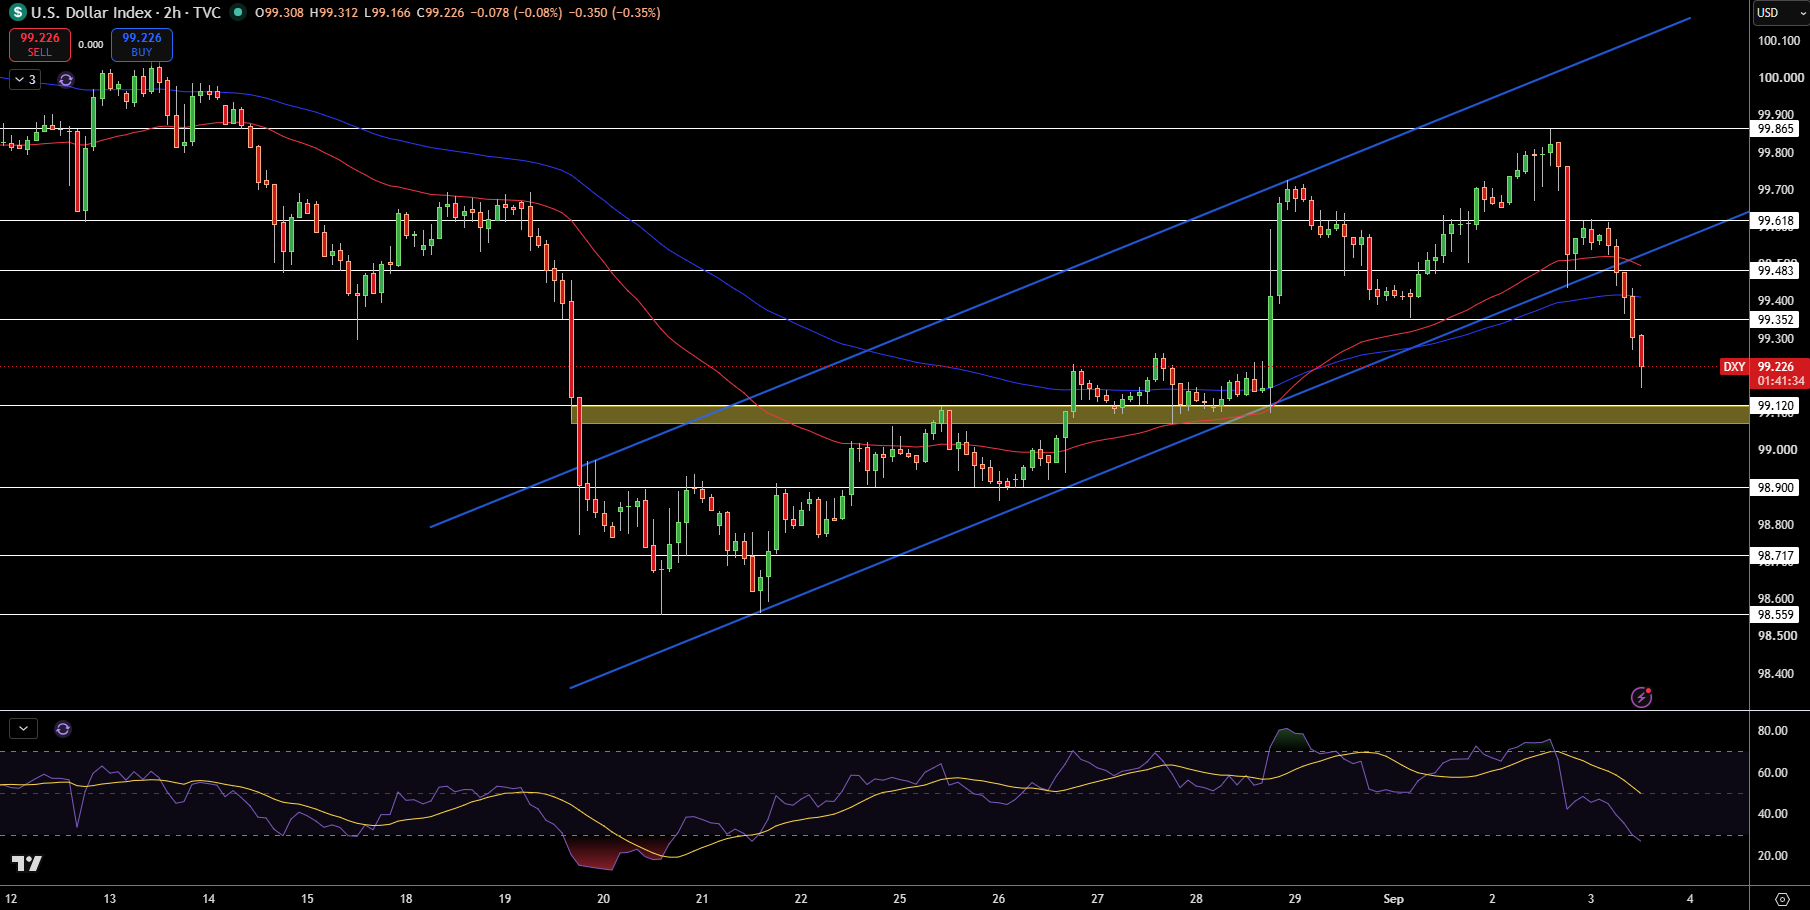
The U.S. Dollar Indexis currently trading at 99.23 on the 2-hour chart after dropping below the recovering channel from the August lows. What is interesting is how quickly the index was rejected at the 99.80 – 99.86 range. DXY lost 99.62, 99.48, and 99.35 very quickly, which shows how much the structure of the bullish recovery has weakened.
The first area I will be watching is 99.12, as the downwards support zone begins there. Breaking below this would expose 98.90, 98.72, and 98.56. In the opposite direction, looking at the previous support zone of 99.35 – 99.48 and adding 99.62, the resistance zone starts to form there.
RSI has dropped and begun to enter oversold territory, so a bounce in the index is possible, but I also believe that the DXY will drop furtherwhen trading below the 99.48 range. I will reverse that opinion if the index breaks above the 99.62 range, but I believe the rallies will be corrective in nature rather than a strong downtrend.
EUR/USD Price Forecast
Every new EUR/USD analysis as it publishes, today's technical signal and key levels, live price — on one page.
See all EUR/USD forecastsGBP/USD Technical Analysis: Sterling Bounces From 1.3477 but 1.3526 Resistance Keeps Bears in Control
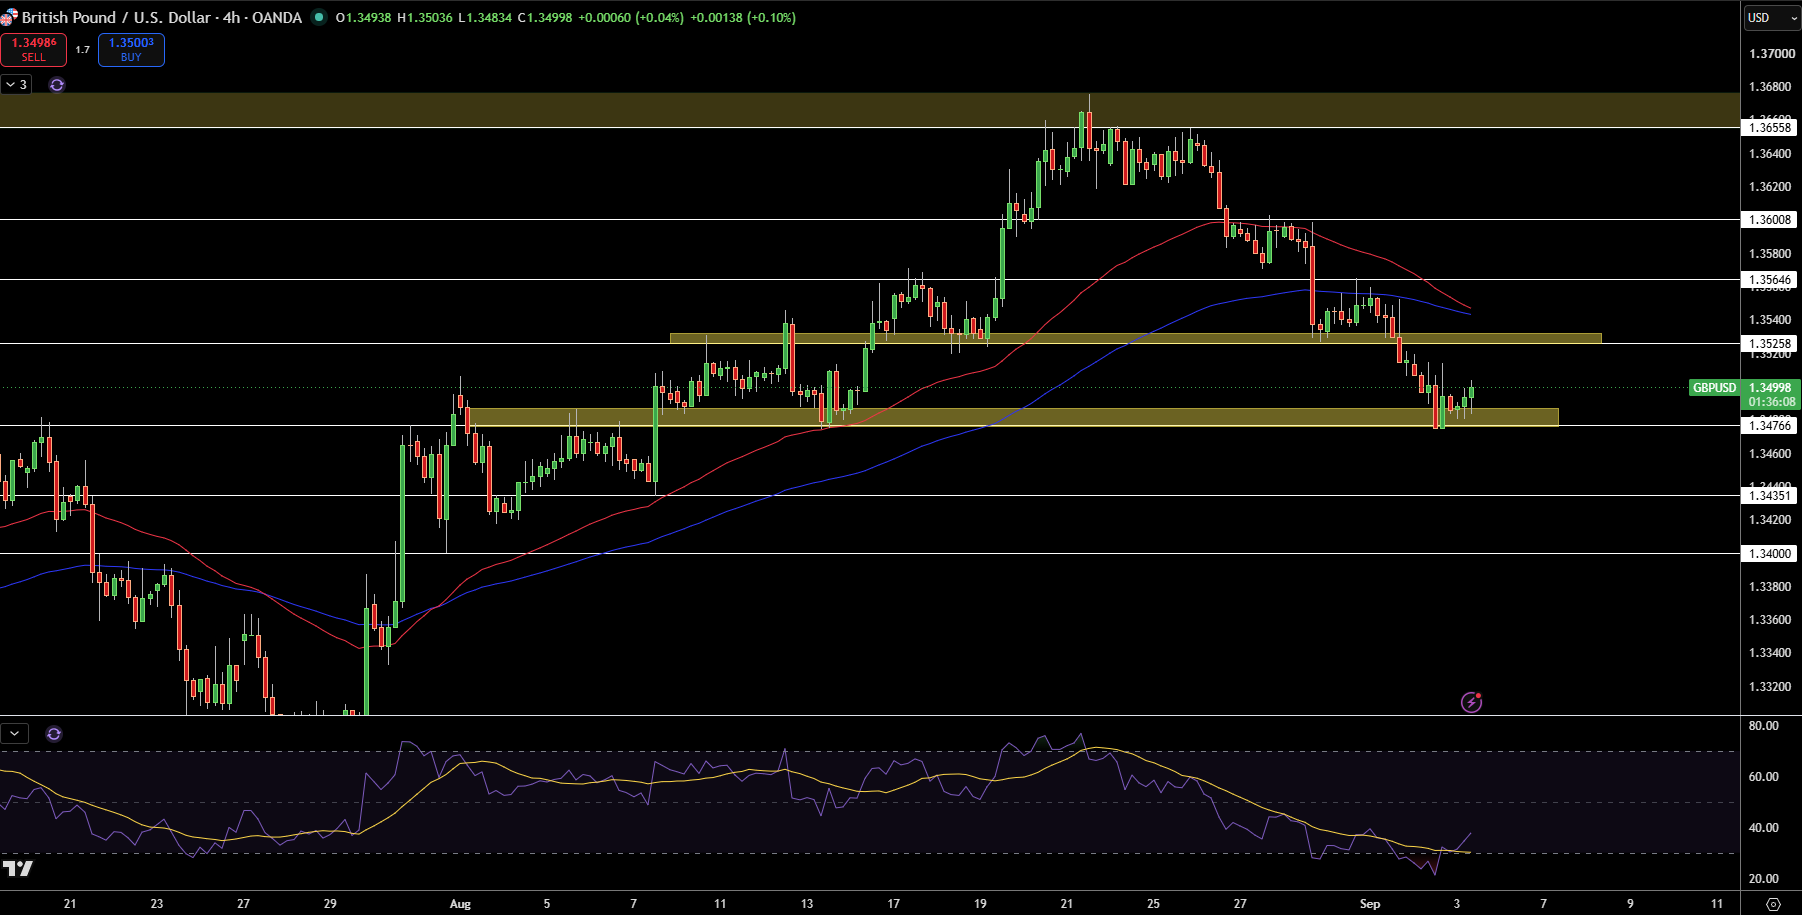
Currently, GBP/USD is trading at the 1.3500 level on the 4-hour chart as price rebounds from the support zone of 1.3477. What I want to point out is that price is bouncing out of a support zone, but is below both moving averages and the 1.3526 support area which is now an area of resistance.
1.3526 is the first resistance area, followed by the resistance area of 1.3565 and 1.3601. Beyond those, resistance is expected to cluster around the area of 1.3656-1.3676. 1.3477 is the next support area, with potential support at 1.3435 and 1.3400 should 1.3477 break.
RSI is recovering from deeply oversold territory. This leads to believing that the pair may continue to climb, however, I am still bias to the below 1.3526 and 1.3565 bearish resistance zone. Should 1.3565 bullish resistance zone break, I will black a resistance call. Until then I believe this is a corrective rally in a weaker bullish short-term trend.
EUR/USD Technical Analysis: Euro Rebounds From 1.1571 but 1.1610–1.1625 Is the Real Test
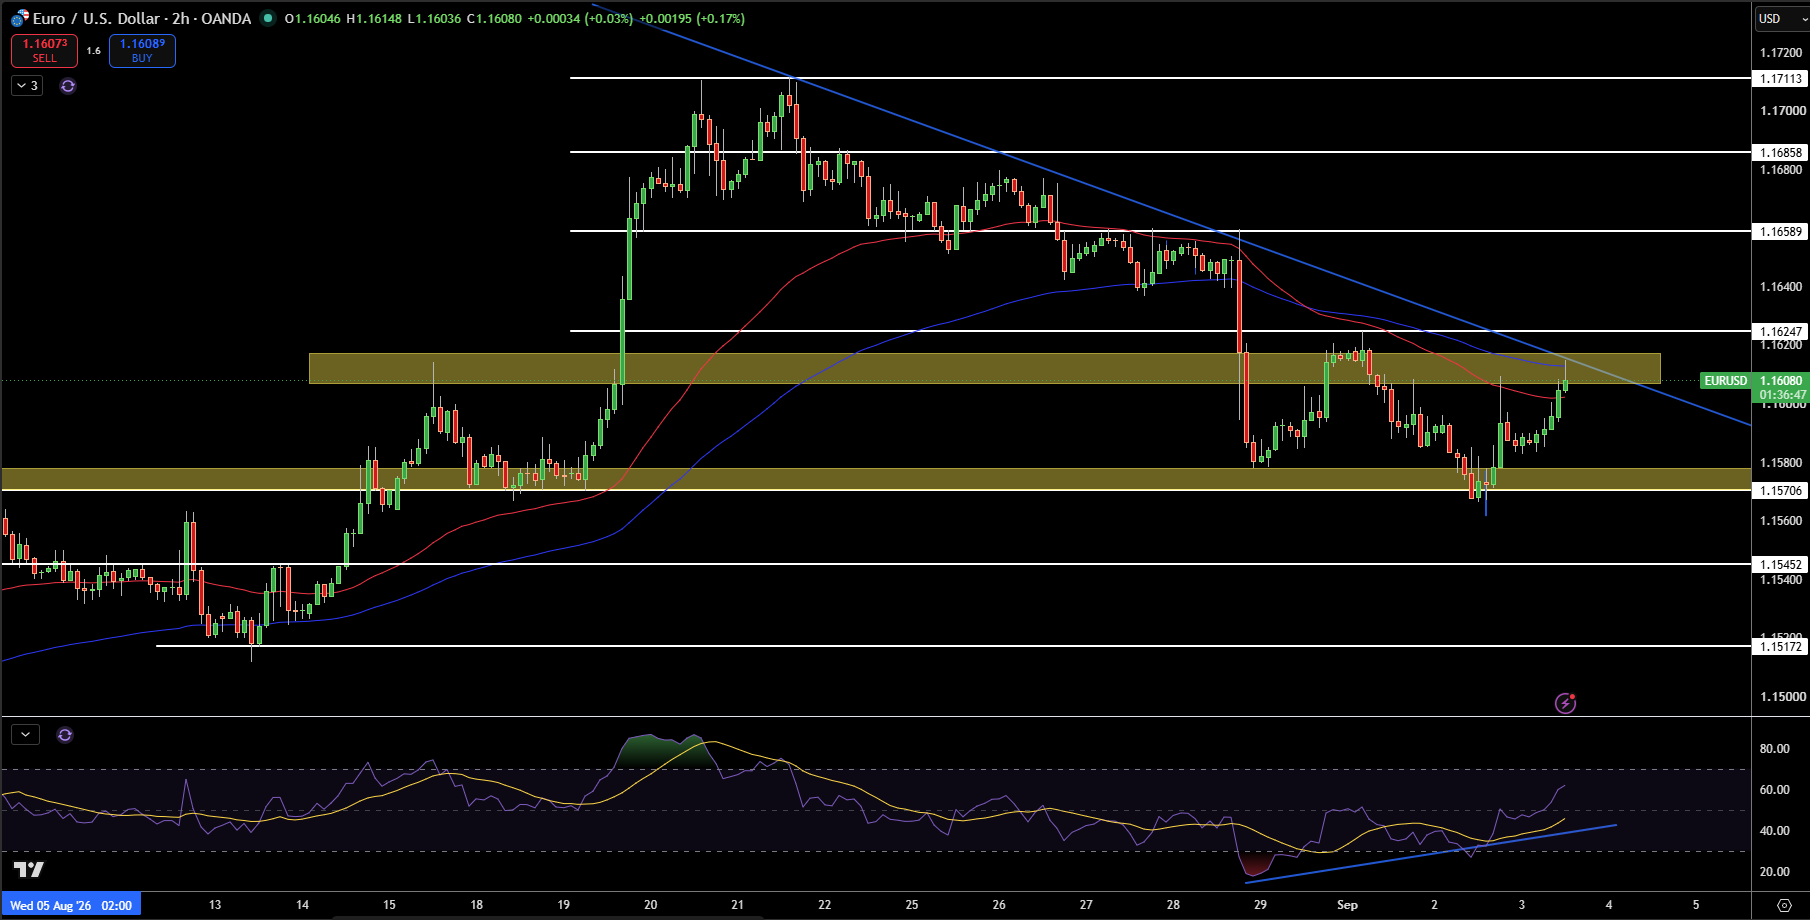
EUR/USD is currently trading at 1.1608. The pair has been bought aggressively on the 1.1571 support level, and what has been interesting is how quickly the pair has bounced from oversold levels. That said, the level that is currently more important is the previous support zone and the descending trendline.
The pair has bounced directly into the zone, rather than the bounce itself.
1.161–1.1625 and 1.1659 are immediate resistance level regions currently. Above 1.1659, buyers would be focused on 1.1686 and 1.1711. Sellers continue to define 1.1571 as the first major support level on the downside with 1.1547 and ultimately 1.1517.
RSI recovering in oversold territory favors the bullish scenario. I’m neutral, but I favour market bears, as long as EUR/USD is below 1.1625. A decisive close above 1.1625 would lead me to a more bearish outlook. A retest of the area around 1.1571 would also be of interest.