AMD Technical Analysis
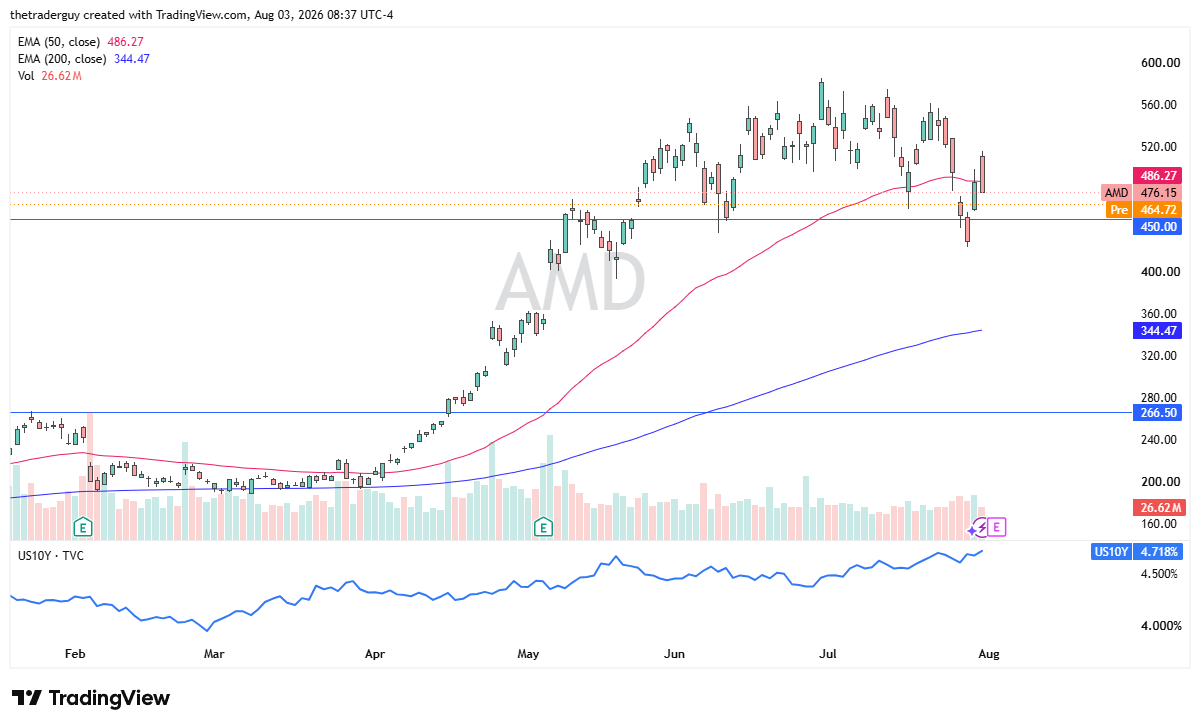
The pre-market trading for AMD looks a bit soft as South Korea had a bit of a tough night last night as well, a major source of semiconductor sentiment, and it looks like we’re going to possibly open up pretty weak to kick off the trading session, although still at this point above the $450 level, an area that previously had been support. AMD continues to form what looks like a rounding top, but has not been confirmed yet, without the breakdown of support yet.

NVDA Technical Analysis
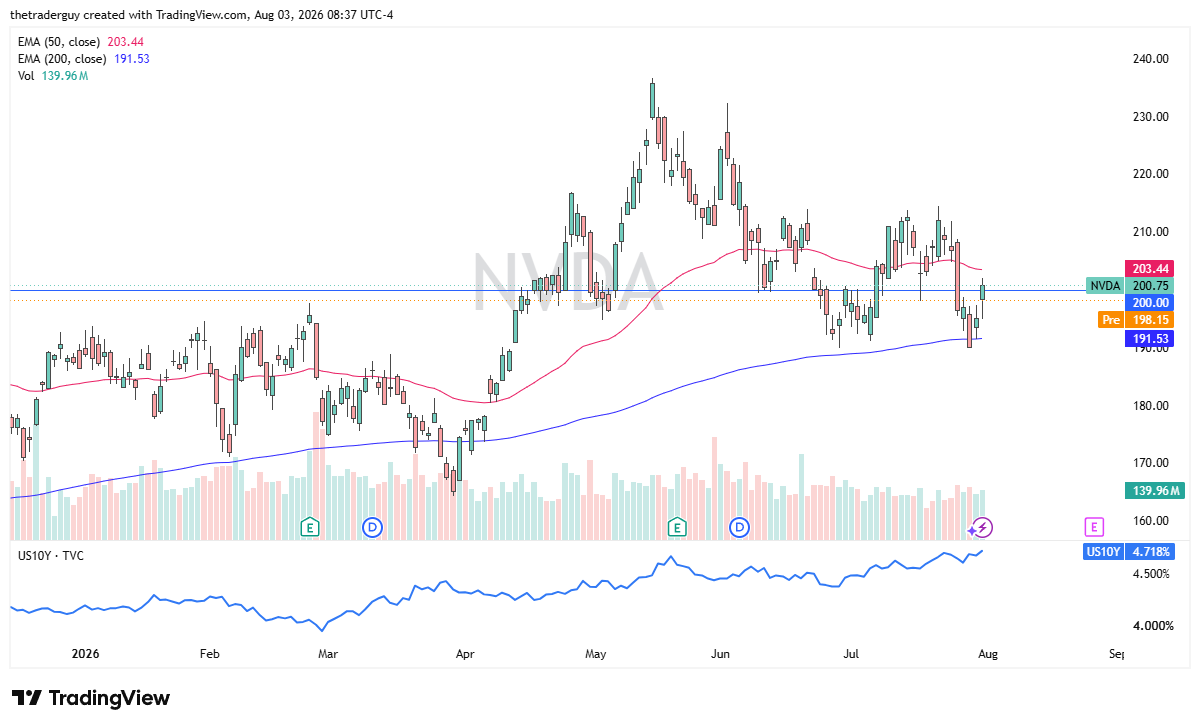
NVIDIA looks like it’s going to be a little bit soft at the open as well. Ultimately, this is a market that continues to dance around the $200 level and obviously is very highly leveraged to the artificial intelligence trade, which is unwinding a bit. At this point, most investors are starting to ask questions about whether or not artificial intelligence is going to be profitable, because so far it has not been, and that concerns everyone right now. In fact, that seems to be one of the biggest themes on Wall Street at the moment.
INTC Technical Analysis
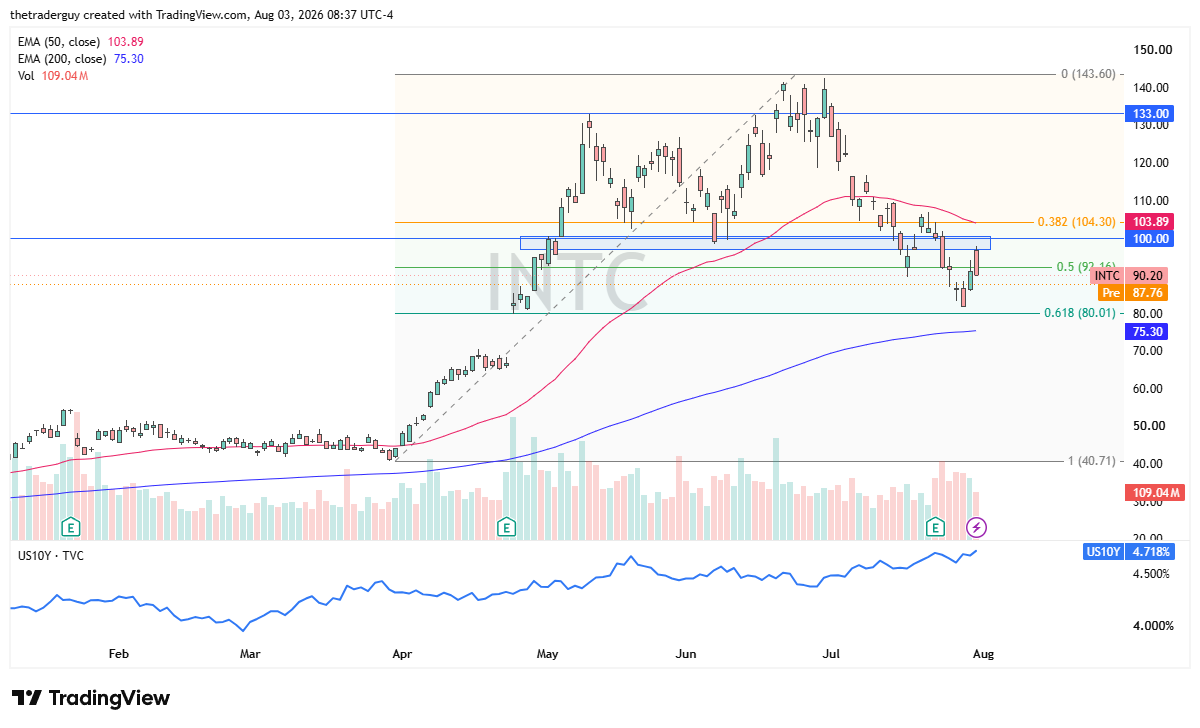
Intel looks like it’s going to be a little soft in pre-market trading as well, continuing the overall grind lower. The market had tried to rally and test the $100 level but has since fallen somewhat to show signs of negativity on Friday after that gap higher, and Monday looks like it’s going to continue that downward pressure. $80 was an area of support previously; the 200-day EMA is racing towards that area, so watching both of those is what I plan on doing.
If you’d like to know more about technical analysis and how traders use it, please visit our educational area.