Bitcoin (BTC) has rebounded more than 35% over the past two months, but analyst Midas says the rally may be nearing exhaustion just as renewed US–Iran tensions add fresh pressure to risk assets.

Midas Says Bitcoin Could Fall Toward $54,000
In a Monday post, Midas highlighted a bearish divergence between Bitcoin’s price and its relative strength index (RSI).
For beginners, RSI is a momentum indicator that measures how aggressively an asset has been bought or sold. Readings above 70 are generally considered overbought, meaning the rally may have moved too far, too quickly.
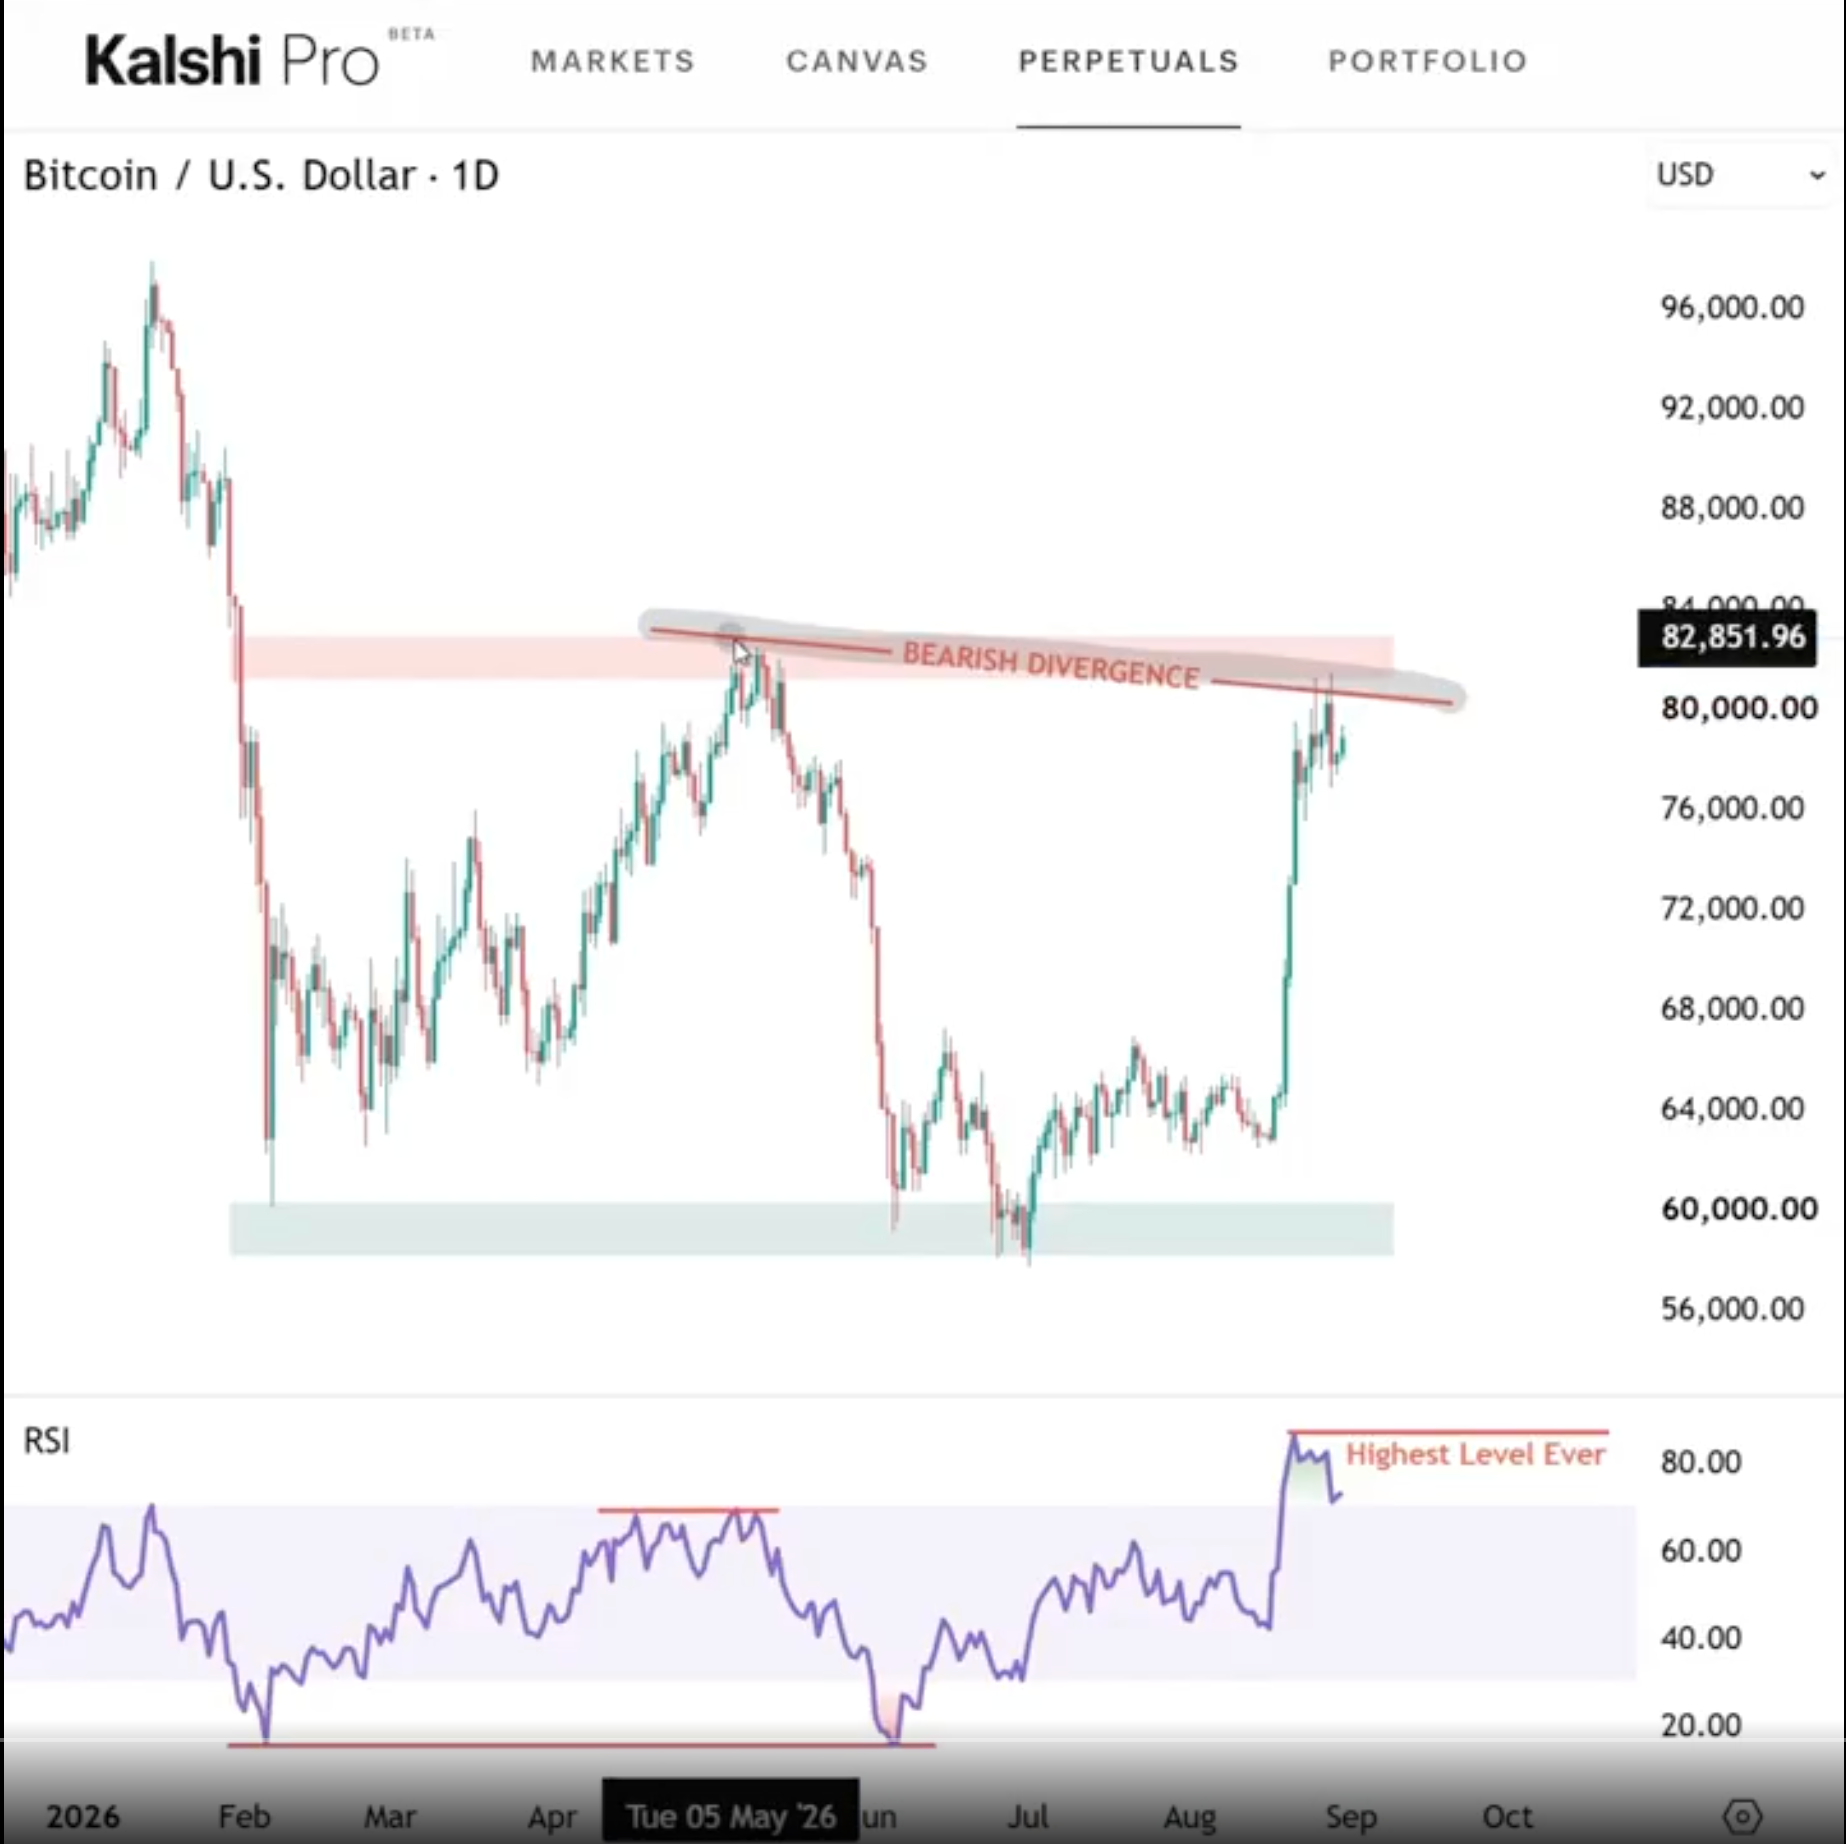
Midas compares the setup with May, when Bitcoin showed a similar divergence near its highs before falling roughly 40%.
He argues the current setup looks “mega overheated” because RSI has reached higher levels this time.
BTC may look bullish in the short term, but unless it can convincingly break and hold above $83,000, the larger bearish trend remains intact, according to Midas.
Another roughly 40% decline from the latest highs could send Bitcoin toward $54,000 if the May pattern repeats.
Bitcoin Price Forecast
Every new Bitcoin analysis as it publishes, today's technical signal and key levels, live price — on one page.
See all Bitcoin forecastsUS–Iran Escalation Adds Another Risk for Bitcoin
Midas’ bearish warning also comes as tensions between the US and Iran flare again.
US forces struck two Iranian rocket launchers on Iran’s Larak Island near the Strait of Hormuz on Sunday, prompting retaliatory attacks from Tehran. The renewed fighting sent Brent crude above $90 a barrel as traders priced in greater risks to oil supplies through the crucial shipping route.
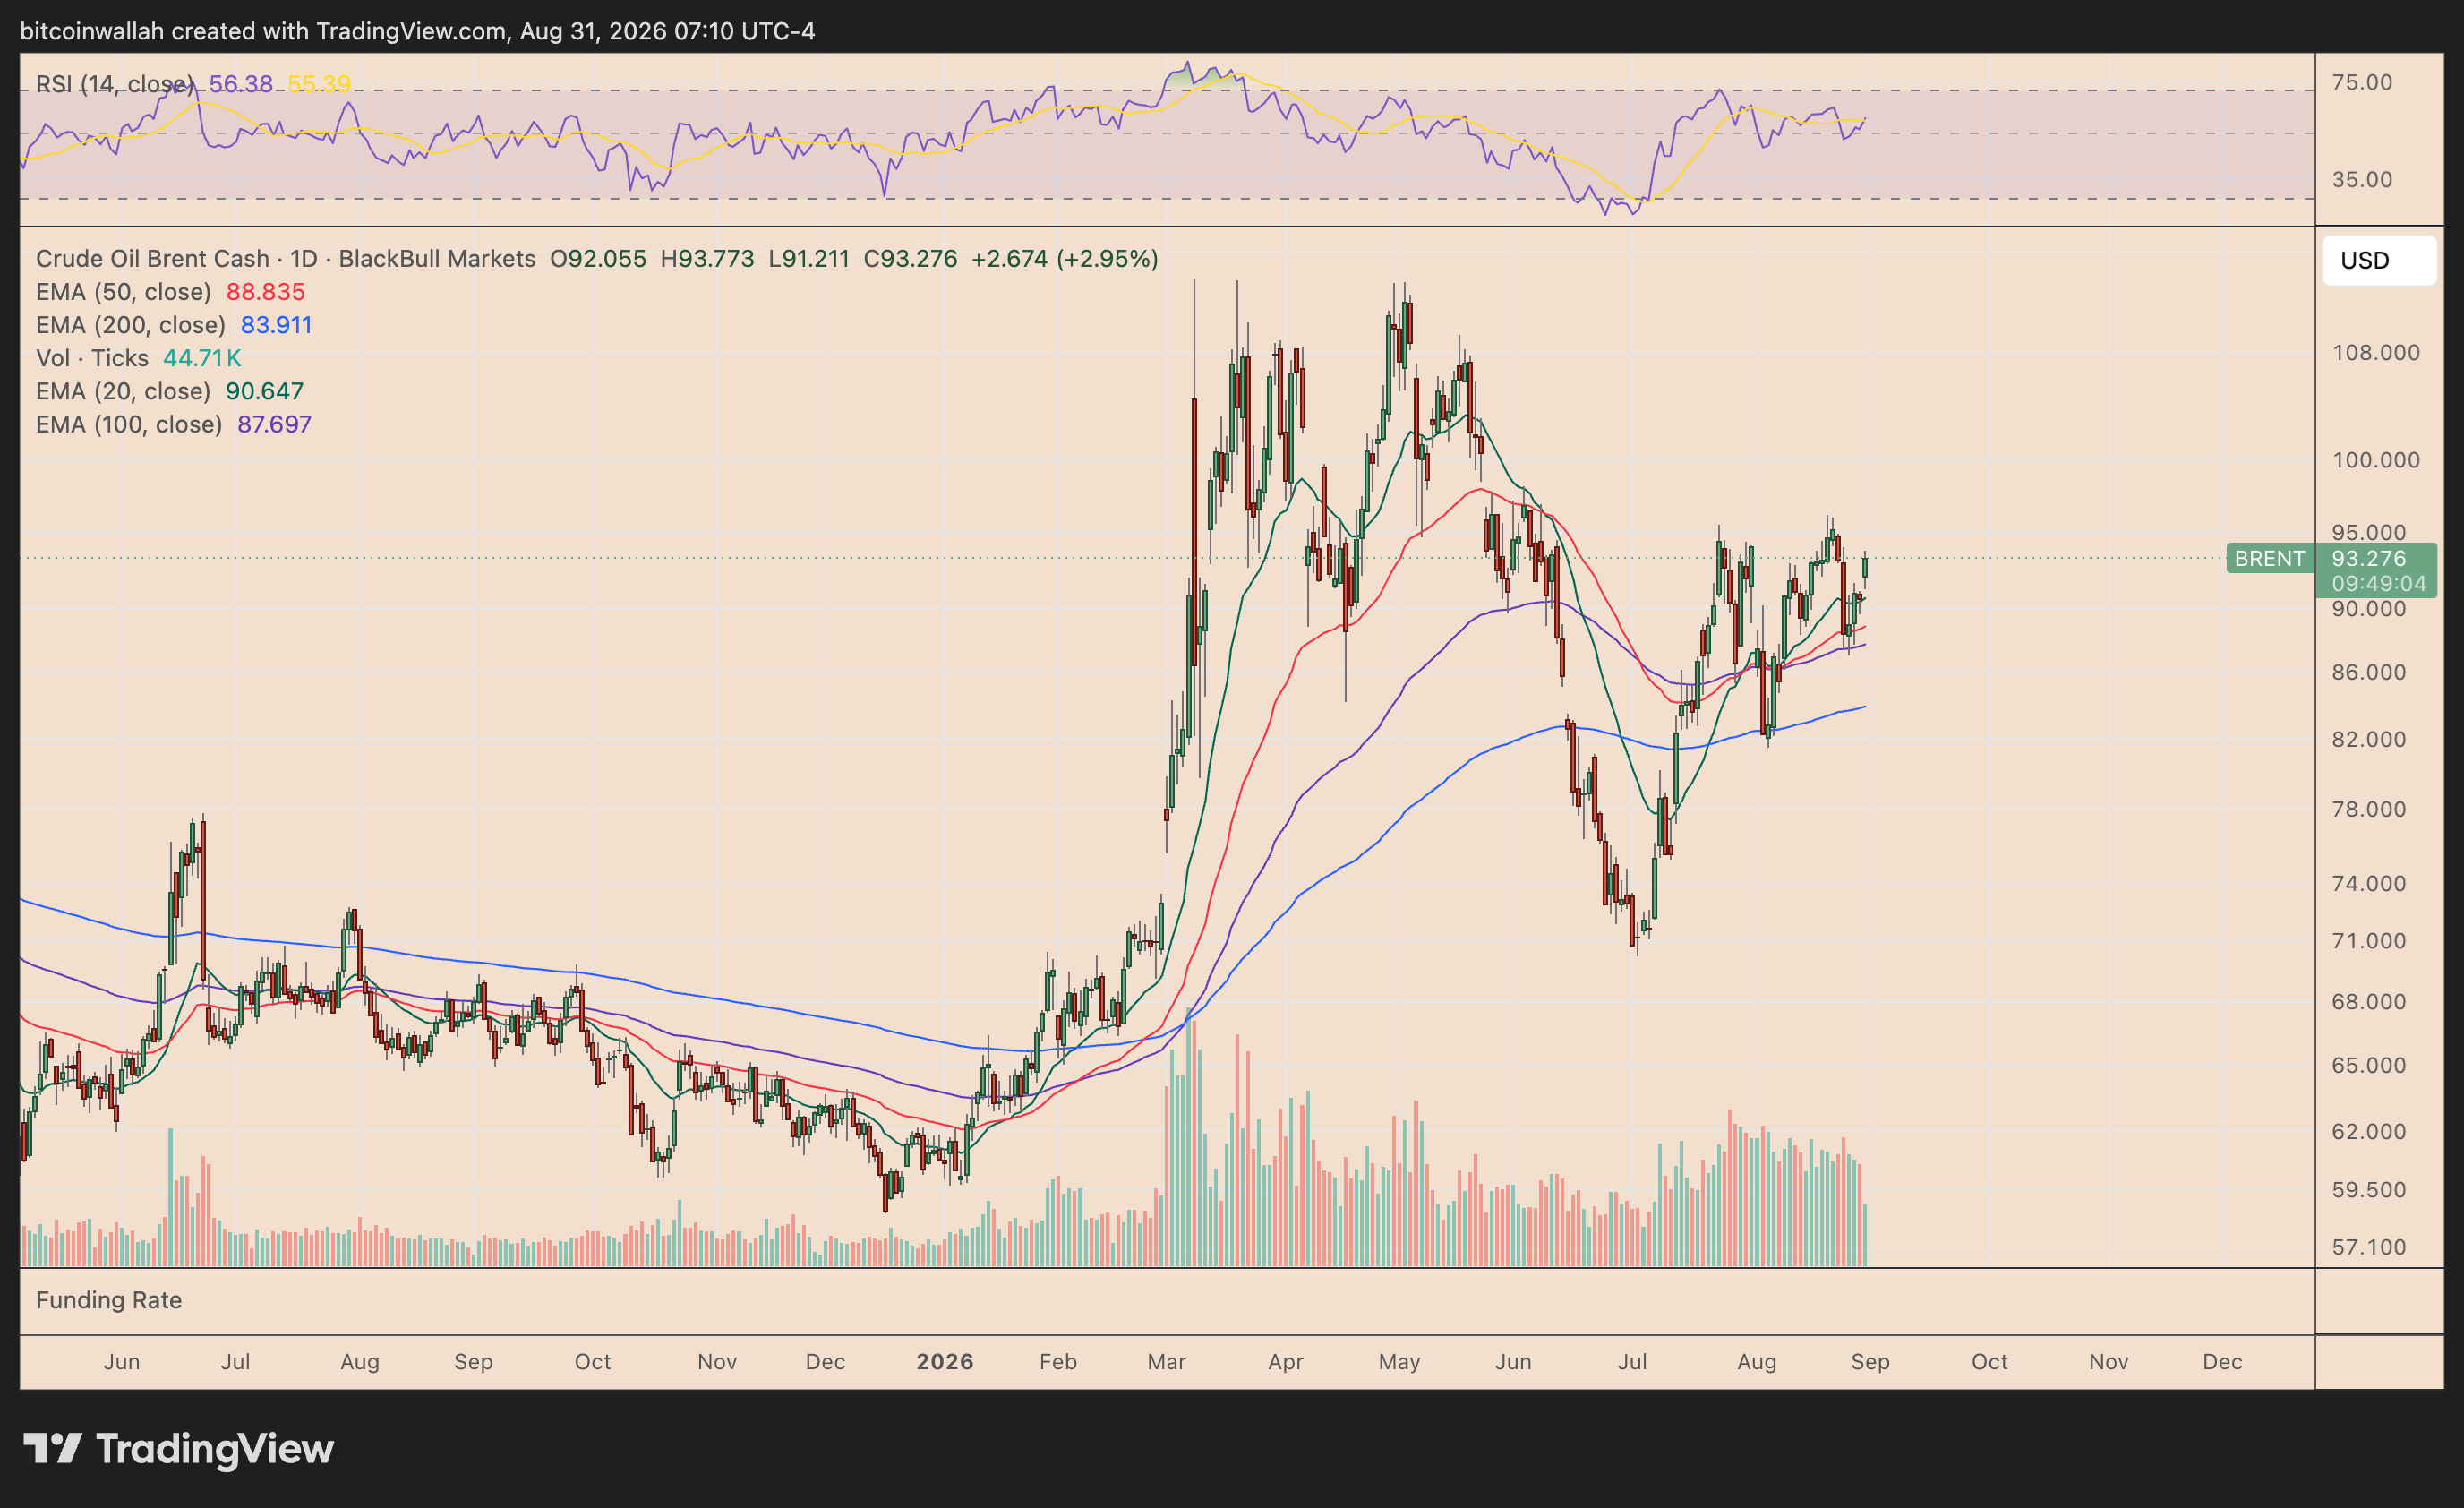
For Bitcoin, the bigger concern is what higher oil prices could mean for inflation.
A prolonged energy-price shock could make it harder for the Federal Reserve to ease monetary policy, keeping interest rates elevated.
Rate futures now price a 61.9% chance of a 25-basis-point hike at the Sept. 16 meeting, up from 41.4% a week ago. The shift followed Fed Chair Kevin Warsh’s hawkish Jackson Hole remarks, where he stressed that inflation remains above the central bank’s 2% target.
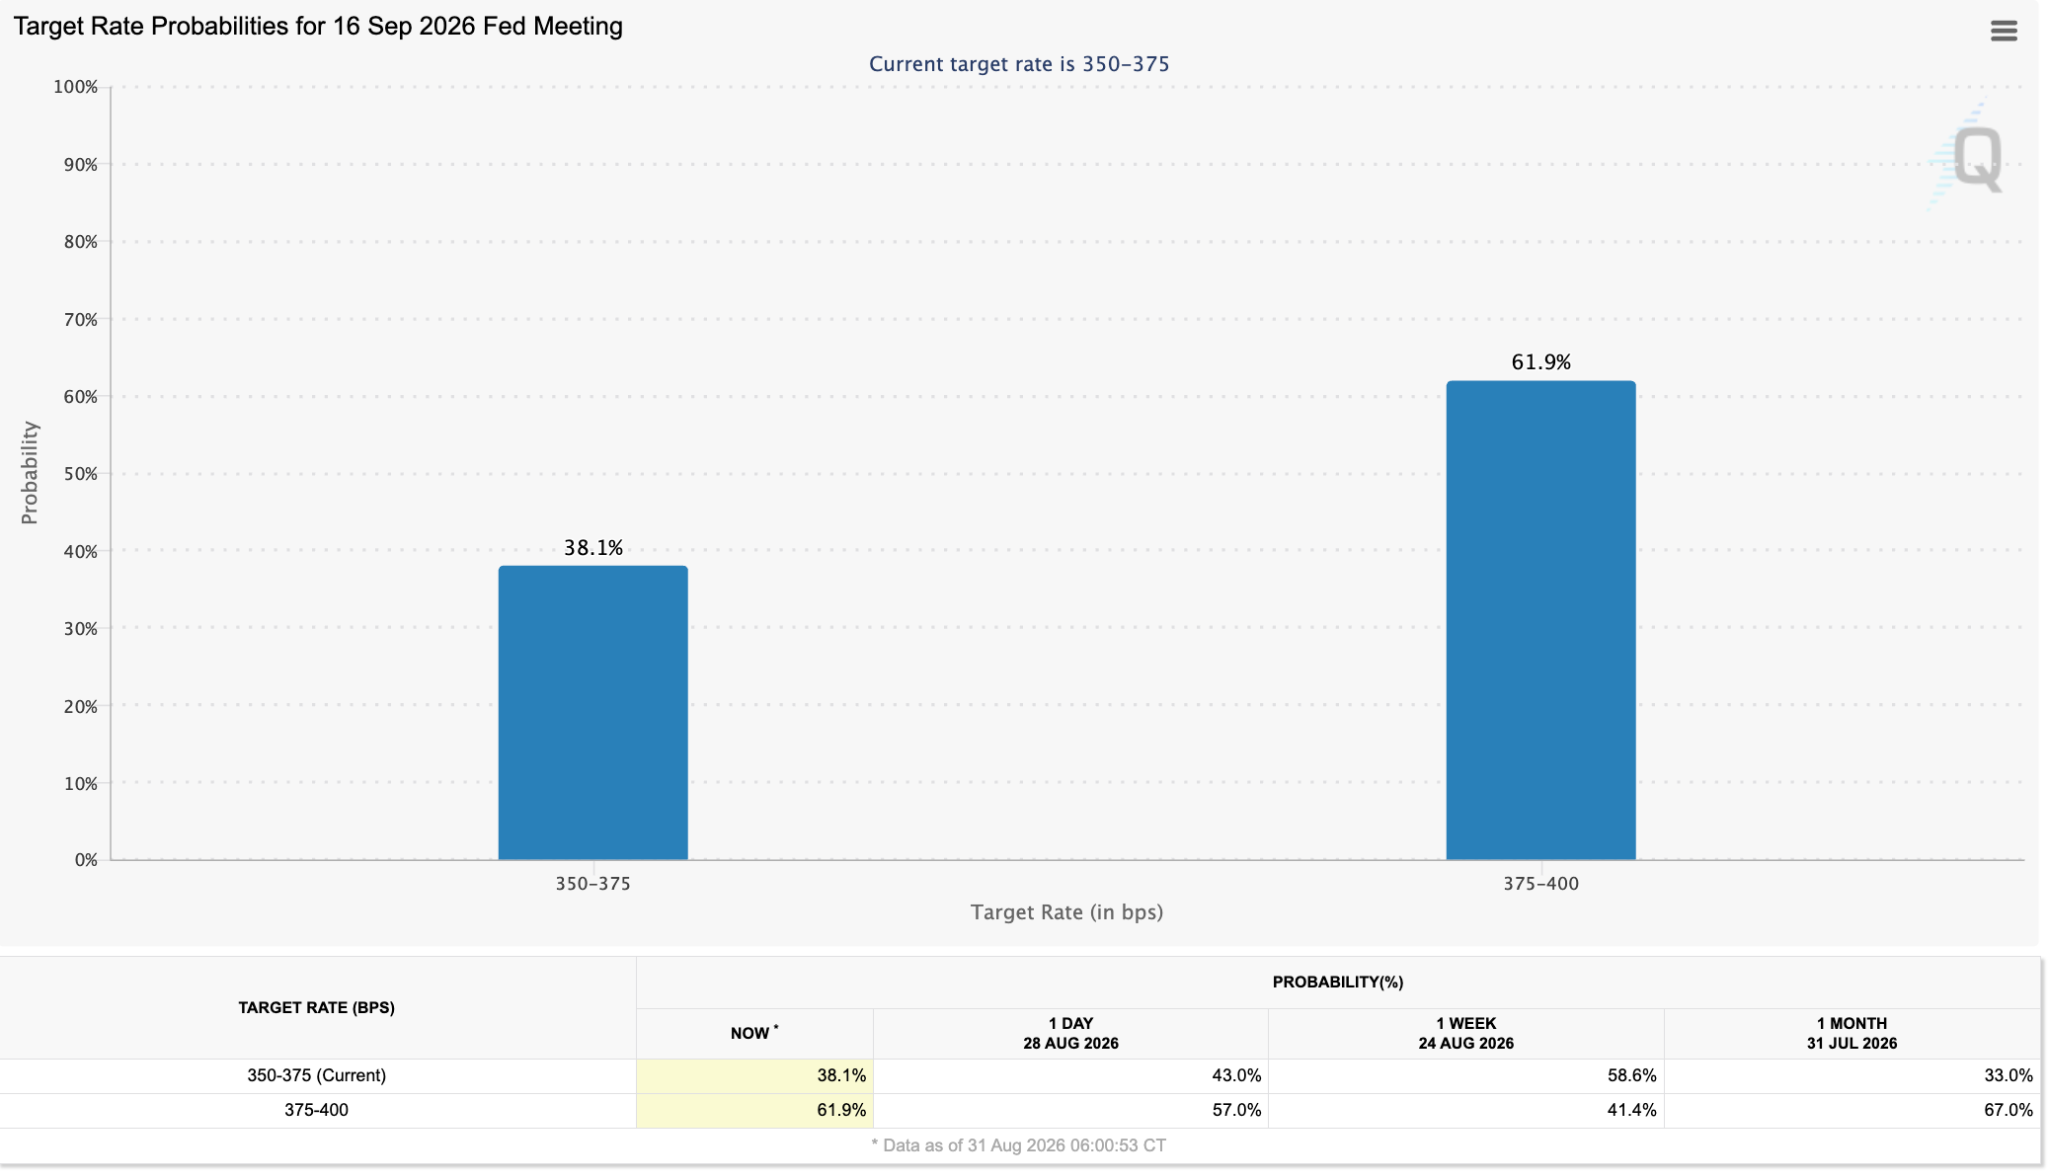
For Bitcoin, that combination matters because higher rates tighten financial conditions and can reduce demand for risk assets.
Bitcoin Symmetrical Triangle Adds to Downside Risk
The bearish fundamental backdrop also coincides with a potential symmetrical triangle breakdown on Bitcoin’s four-hour chart.
BTC is consolidating between converging trendlines near $78,600, while its 50-period EMA around $77,400 is providing immediate support. A decisive break below the triangle’s lower trendline and the 50-period EMA (red) could confirm weakening momentum.
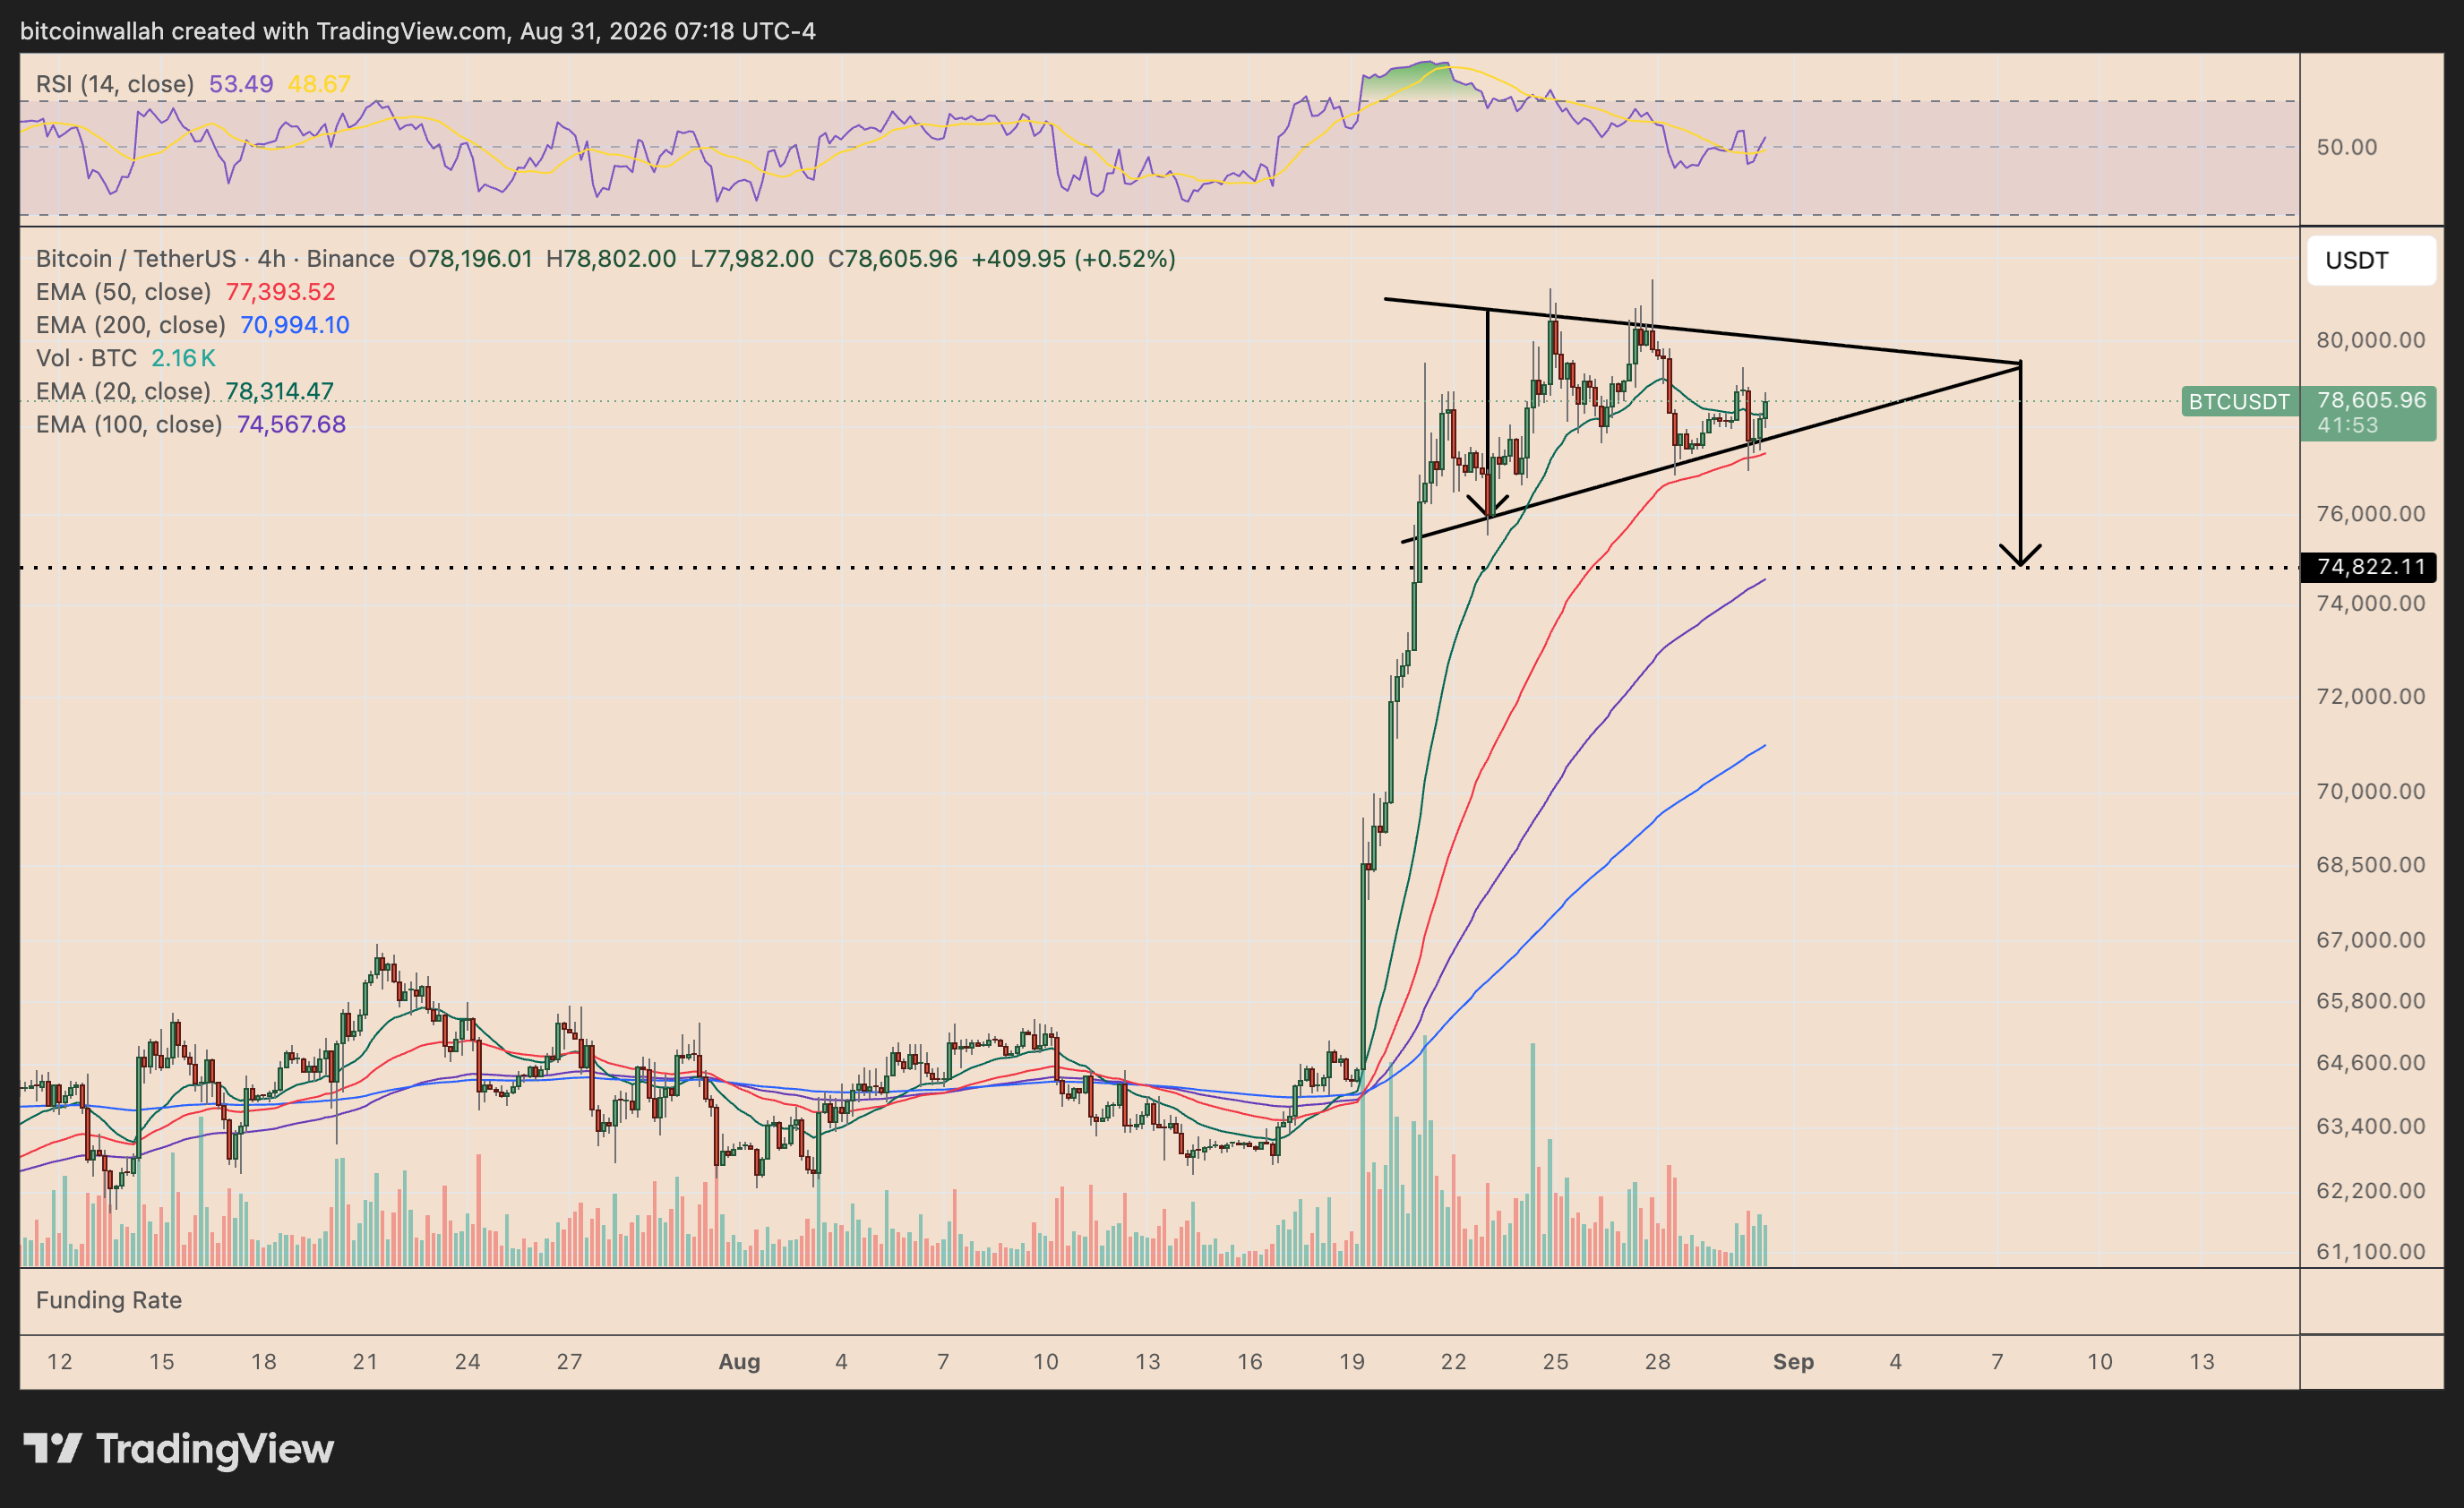
The first downside target sits near $74,800, close to Bitcoin’s 100-period EMA (purple) around $74,570. Conversely, a breakout above the triangle’s upper trendline near $80,000 would invalidate the immediate bearish setup.