
US Dollar News: Warsh’s Hawkish Turn Revives September Hike Bets
The U.S. dollar starts the month of August with fresh fundamental support. The markets are now assigning a 57 percent probability of a September rate increase, up from 35 percent after Federal Reserve Chair Kevin Warsh’s remarks at Jackson Hole. The two-year Treasury notes are yielding around 4.33 percent, near a one-month high, which supports the dollar’s interest rate differentials. Gulf tensions have also become defensive demand buyers after the U.S. strikes on Iran’s Larak Island and Iran retaliated by striking Jordan.
The euro continues enjoying support from a more hawkish European Central Bank. From the ECB meeting minutes, policymakers were of the view that another rate hike was inevitable. A move from 2.25 percent to 2.50 percent was still a viable option in September, if inflation was to remain high. The euro-area has stabilized enough for policymakers to focus on inflation, giving the ECB room to act.
The pound continues to have a more dovish policy. Expectations for Bank of England rate hikes were further reduced before Jackson Hole and continue to be reduced, as inflation remains high and the British sterling is still set for monthly gains.
The foreign exchange landscape for August 31 is primarily about U.S. policy divergence. Warsh’s shift to a more hawkish view has increased the likelihood of a September rate hike and strengthened the dollar’s fundamental support. The euro continues to enjoy ECB tightening support, whereas the pound continues to have a more dovish BoE.

U.S. Dollar Index Technical Analysis: DXY Rebounds Into 99.58 Resistance as 99.34 Support Holds
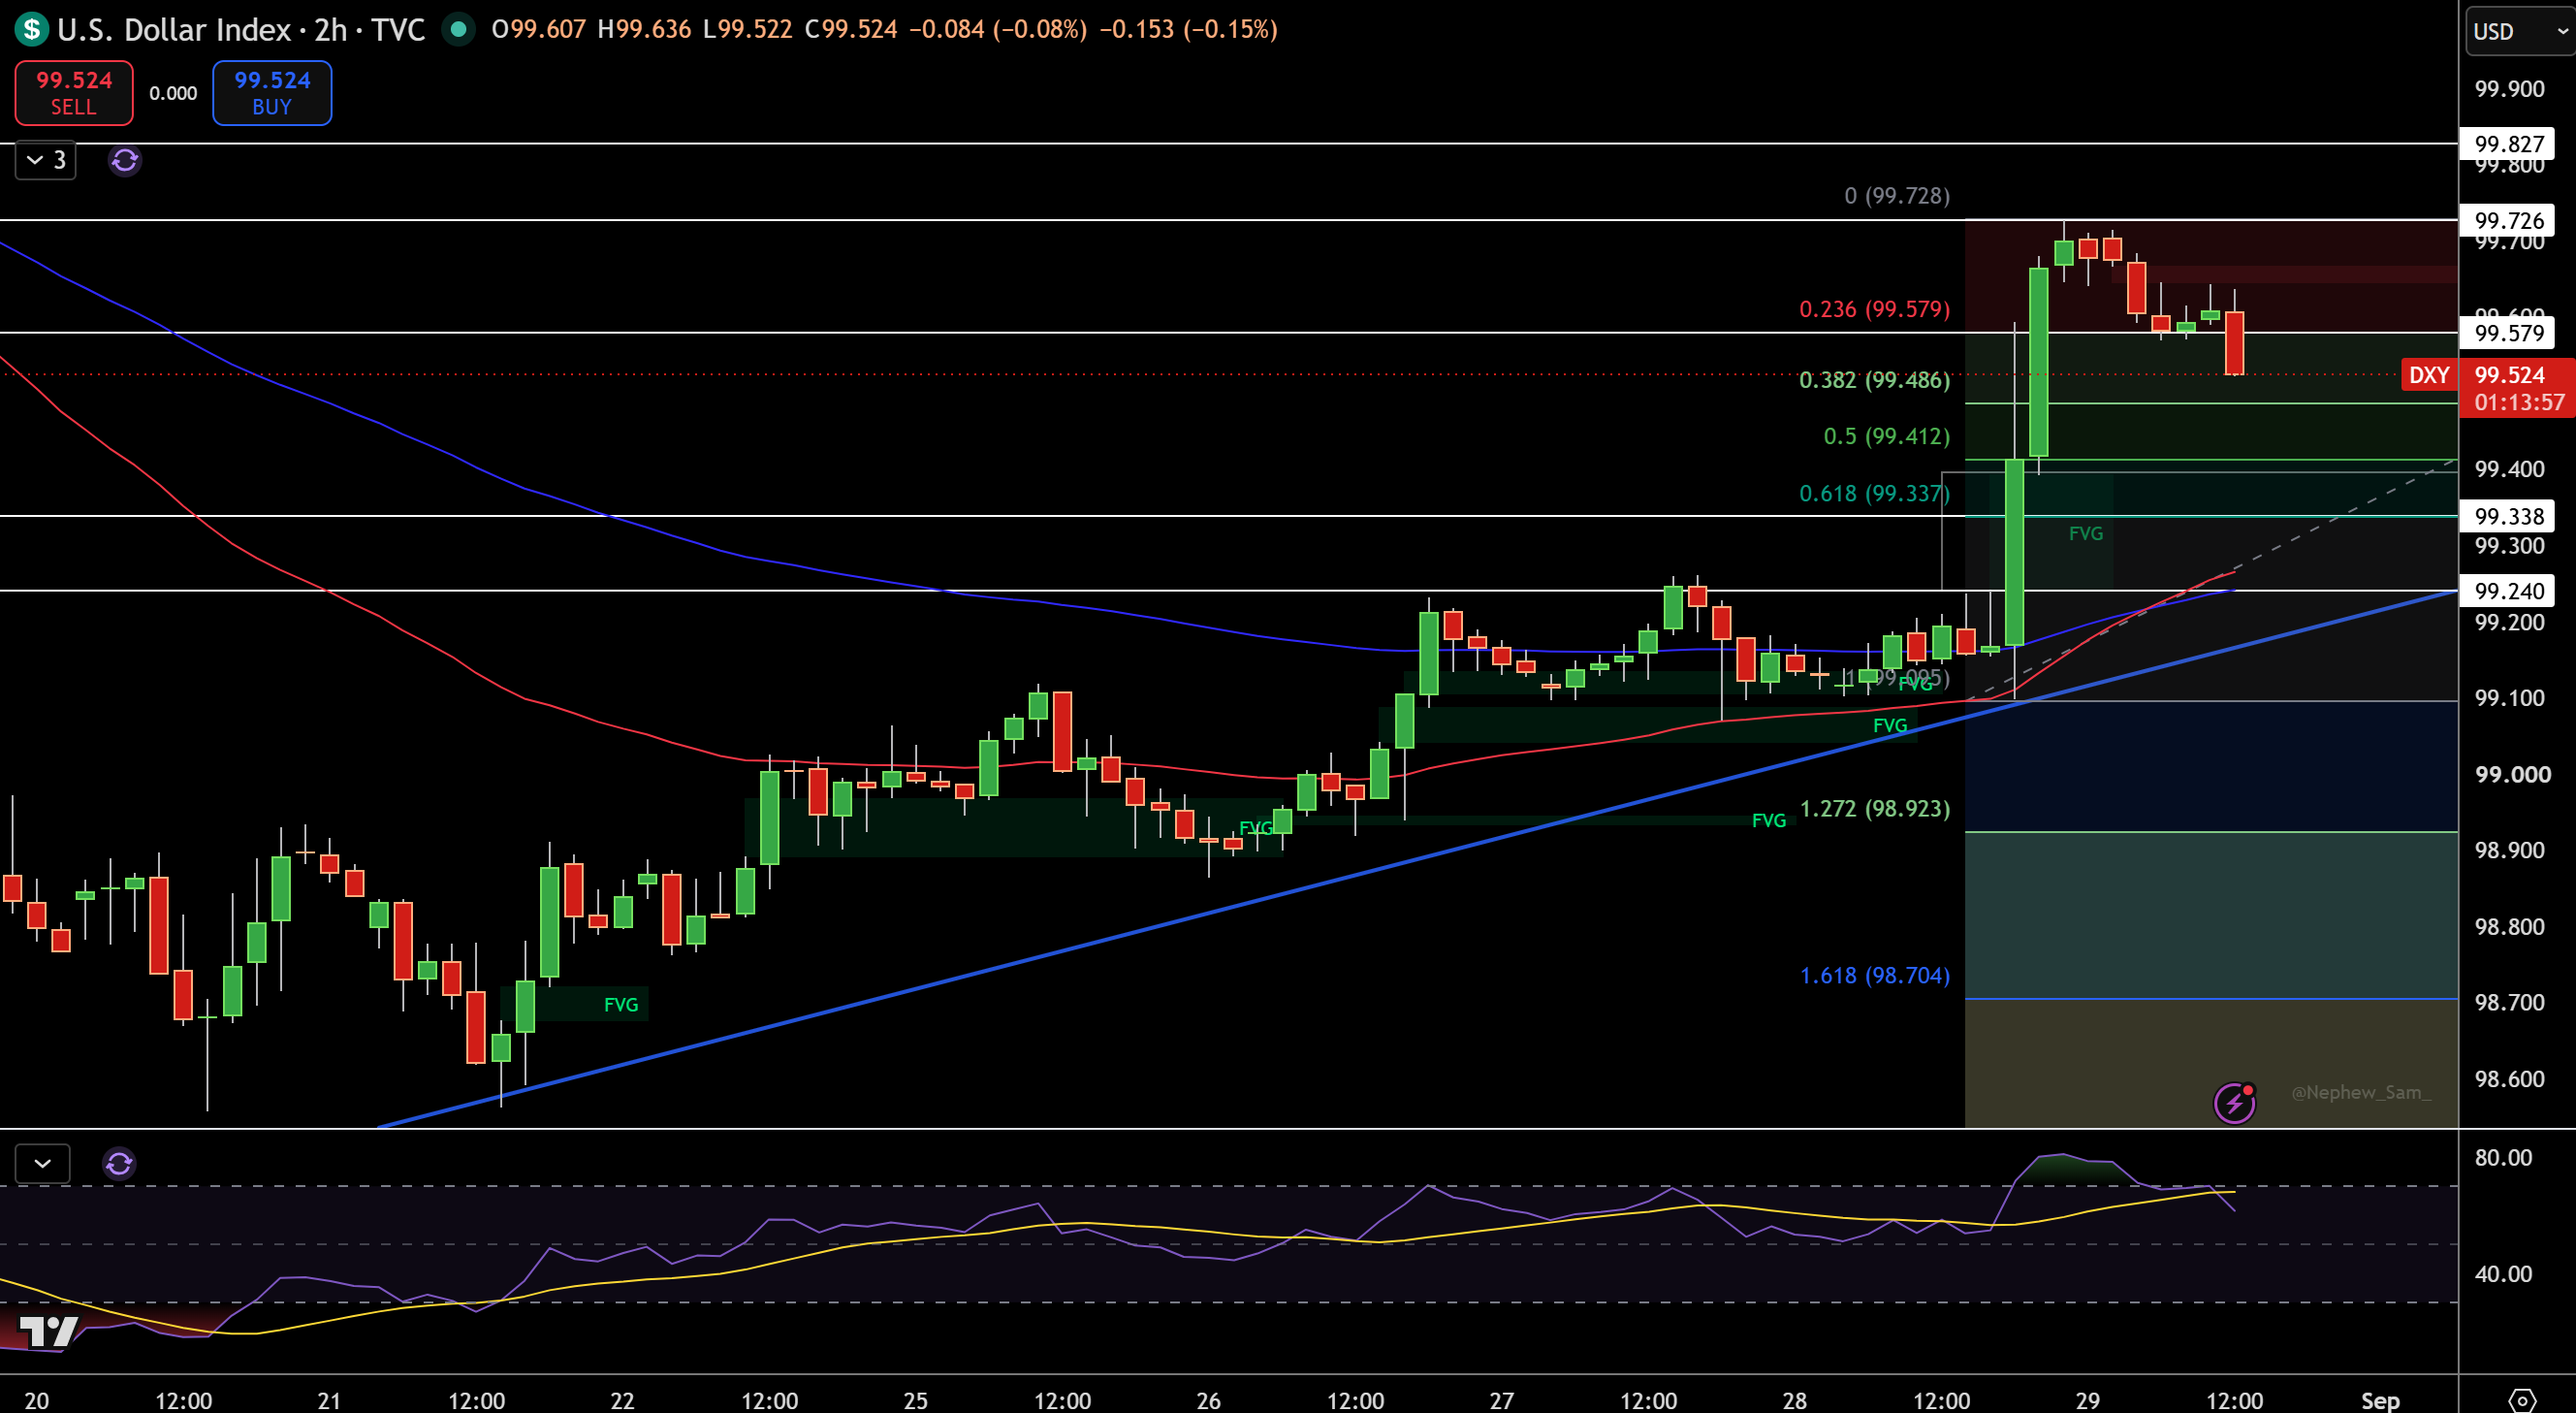
The U.S. Dollar Index is trading around 99.52 on the 2-hour chart after extending its recovery from the 98.56 low. Price has now risen above the 38.2% Fibonacci level at 99.49 and is currently testing the 23.6% retracement at 99.58. The recovery has been technically constructive, however, DXY is still approaching a heavier resistance zone at 99.58–99.73, where recent highs are located.
The short-term structure remains supported by the rising trendline and fair-value gap at 99.24–99.34. Immediate resistance is located at 99.58, and above that at 99.73, 99.83, and 100.03. On the downside, support is located at 99.49, and below that at 99.41, 99.34, and 99.24.
Looking at the bigger picture, I believe DXY is still in the process of recovering above 99.34–99.41. A break above 99.58 would strengthen the bullish case in the direction of 99.73–100.03, while a break above current resistance would likely result in a sell off back towards the 99.34 support zone.
EUR/USD Price Forecast
Every new EUR/USD analysis as it publishes, today's technical signal and key levels, live price — on one page.
See all EUR/USD forecasts
GBP/USD Technical Analysis: Pound Breaks Rising Channel as 1.3545 Support Faces Pressure
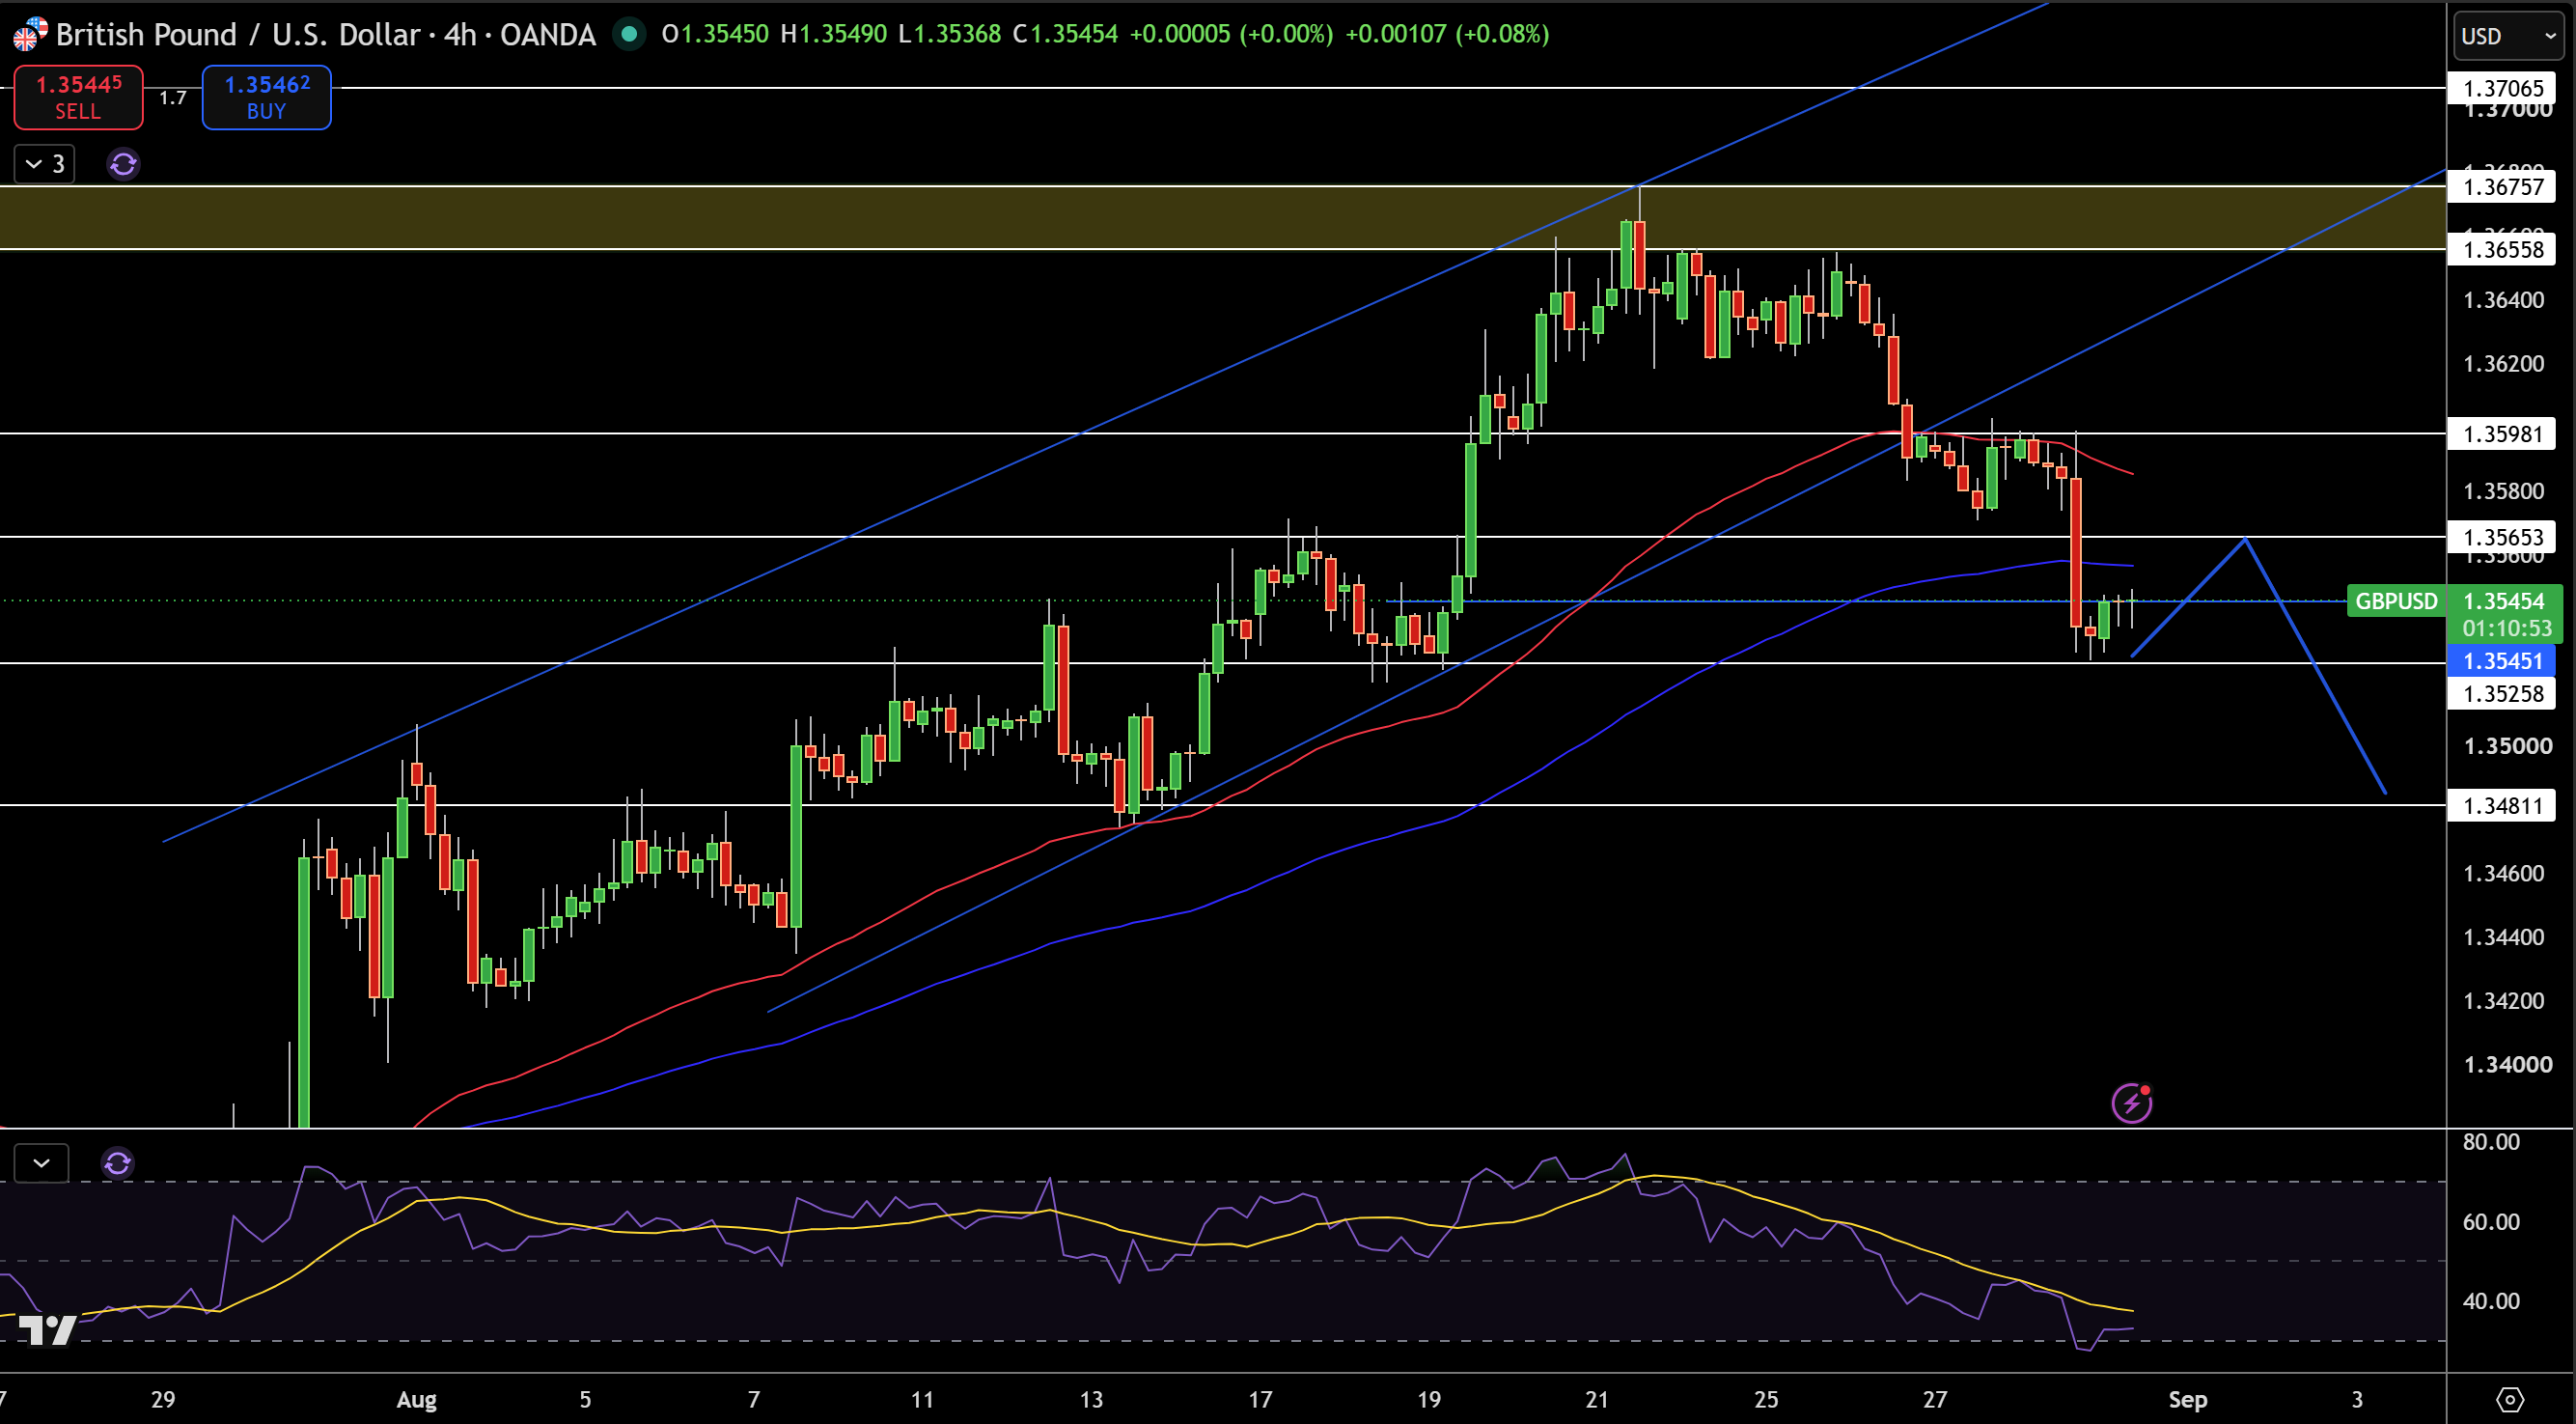
GBP/USD is now at 1.3545 on the 4-hour chart after falling below the lower boundary of its rising channel. A clear rejection at the upward range of 1.3656 – 1.3676 has led to a downward movement which also broke beneath the 50 EMA at 1.3597. The 100 EMA is currently at 1.3557 and is calling the shots, indicating that the movement is looking more and more negative.
On the temporary support side, the range begins at 1.3545, goes to 1.3526 and then finally 1.3481. For temporary resistance, the range is 1.3565, 1.3598 and then the major resistance zone of 1.3656 – 1.3676. A limited recovery after the breakdown shows that for now, the selling pressure is still greater than the buying pressure.
Taking everything into consideration, I think we can safely say that GBP/USD has started its move into a bearish correction below 1.3598. A break below 1.3545 tests 1.3526 and 1.3481, while buying resistance above 1.3598 improves the near-term outlook.
EUR/USD Technical Analysis: EUR/USD Breaks Rising Trendline as 1.1571 Support Comes Into Focus
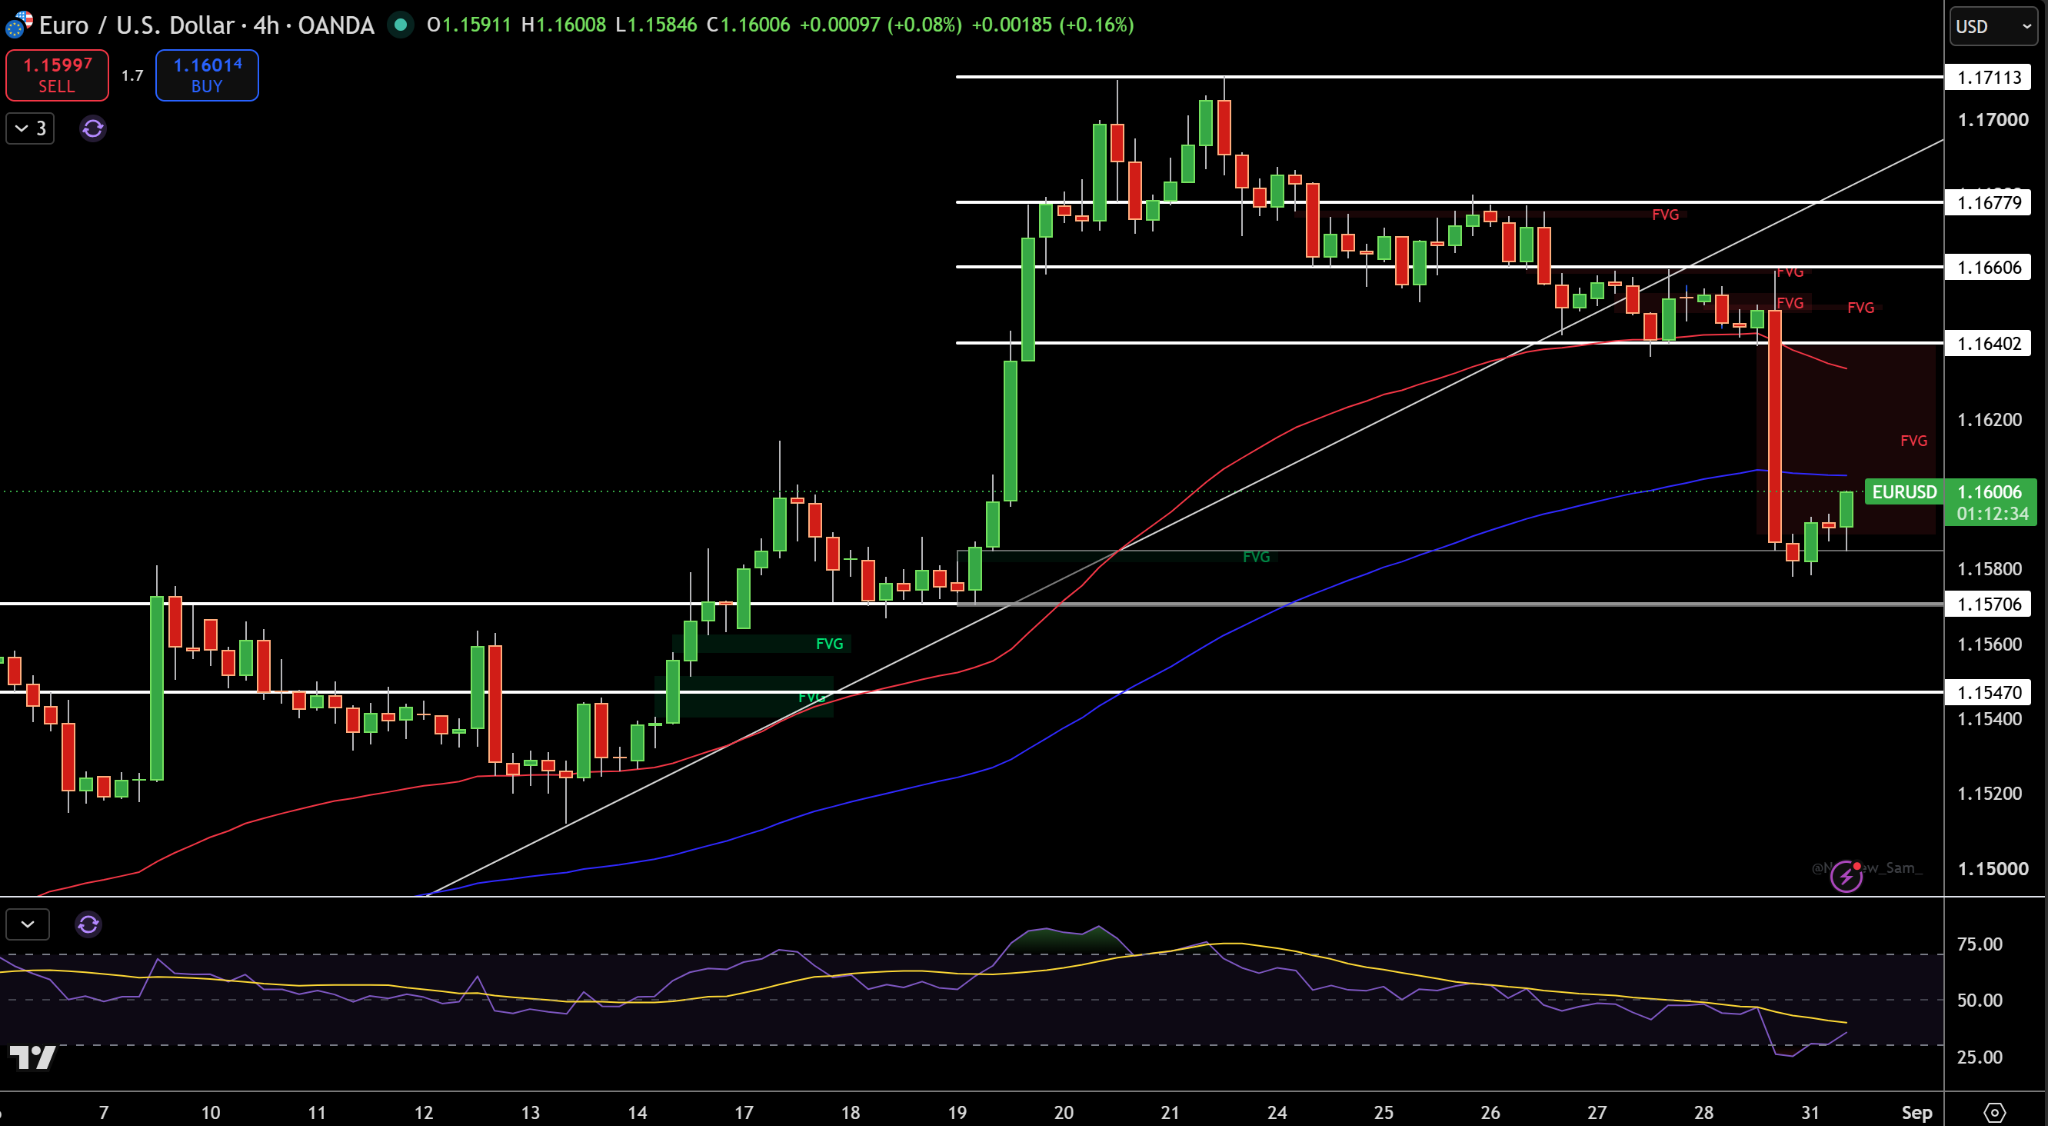
EUR/USD is trading at 1.1601 on the 4-hour chart after a sharp bearish breakdown below the rising trendline and 1.1640 support area. Price has even fallen below the 50-EMA, while the 100-EMA is now about 1.1600. This breakdown has further eroded the short-term bullish structure and indicates that sellers are now in control after inflating stopped orders multiple times at 1.1678–1.1711.
The latest bounce from below 1.1580 is small. The price is still breaking the trendline. Immediate resistance will be found around 1.1640, and then at 1.1661, 1.1678, and 1.1711. From below, the main support will be seen around 1.1571, and then at 1.1547 as well as the broader area of 1.1530 – 1.1510.
Momentum is also still soft after the sharp sell-off. In my opinion, EUR/USD will still be vulnerable while below the 1.1640 level. A break below 1.1571 will allow the selling pressure to continue and target 1.1547. On the other hand, a break above 1.1640 will tell us that the selling pressure has subsided.