Key Insights:
- Bitcoin (BTC) slumped by 11.63% on Monday, following on from last week’s 11.6% reversal.
- Despite crypto market panic setting in, the Fear & Greed Index dropped just 1 point to sit at 10/100.
- Bitcoin’s technical indicators continue to flash red, with Bitcoin sitting well below the 50-day EMA.
On Monday, bitcoin (BTC) fell for a fifth consecutive day, with risk aversion from the global financial markets causing crypto investors to jump ship.
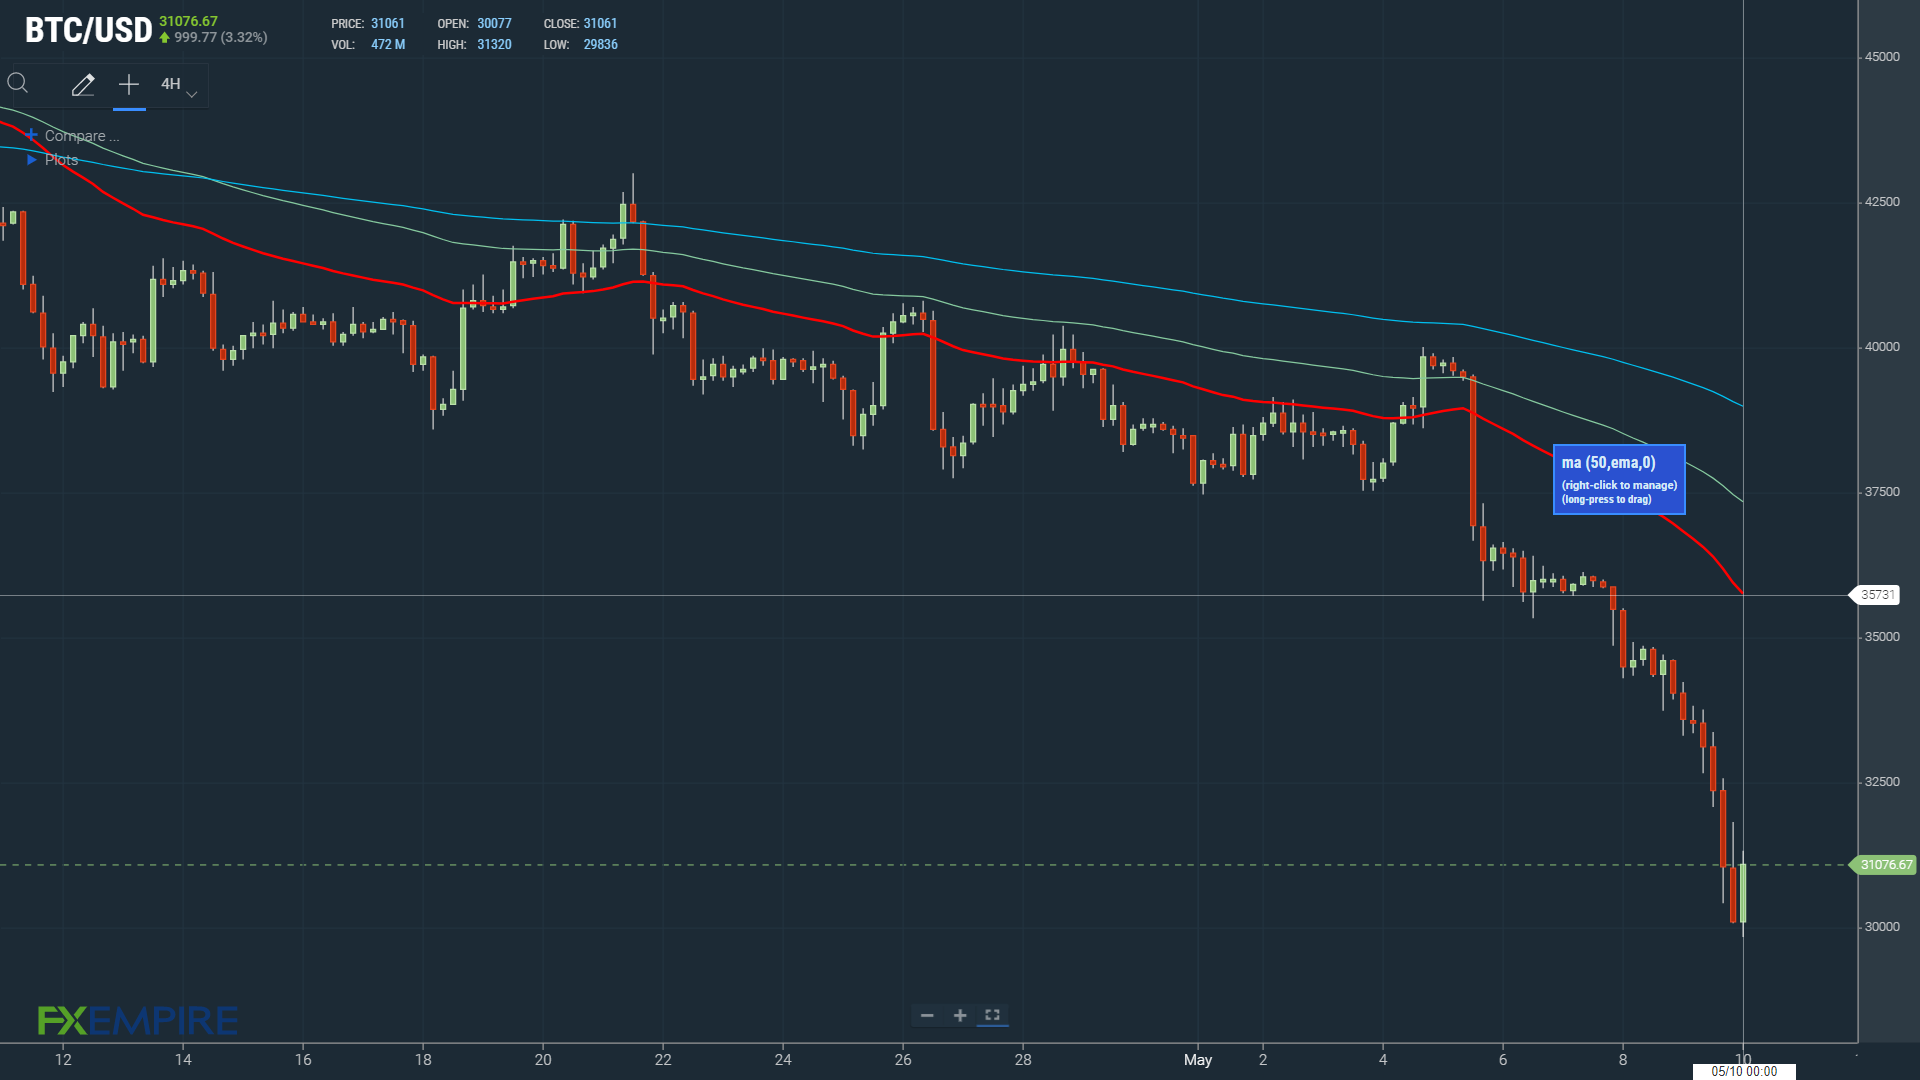
Following a 4.05% decline on Sunday, bitcoin tumbled by 11.63% to end the day at $30,077.
A day-long sell-off saw bitcoin fall to a final hour intraday low of $30,068 to test support at $30,000 before ending the day at $30,077.
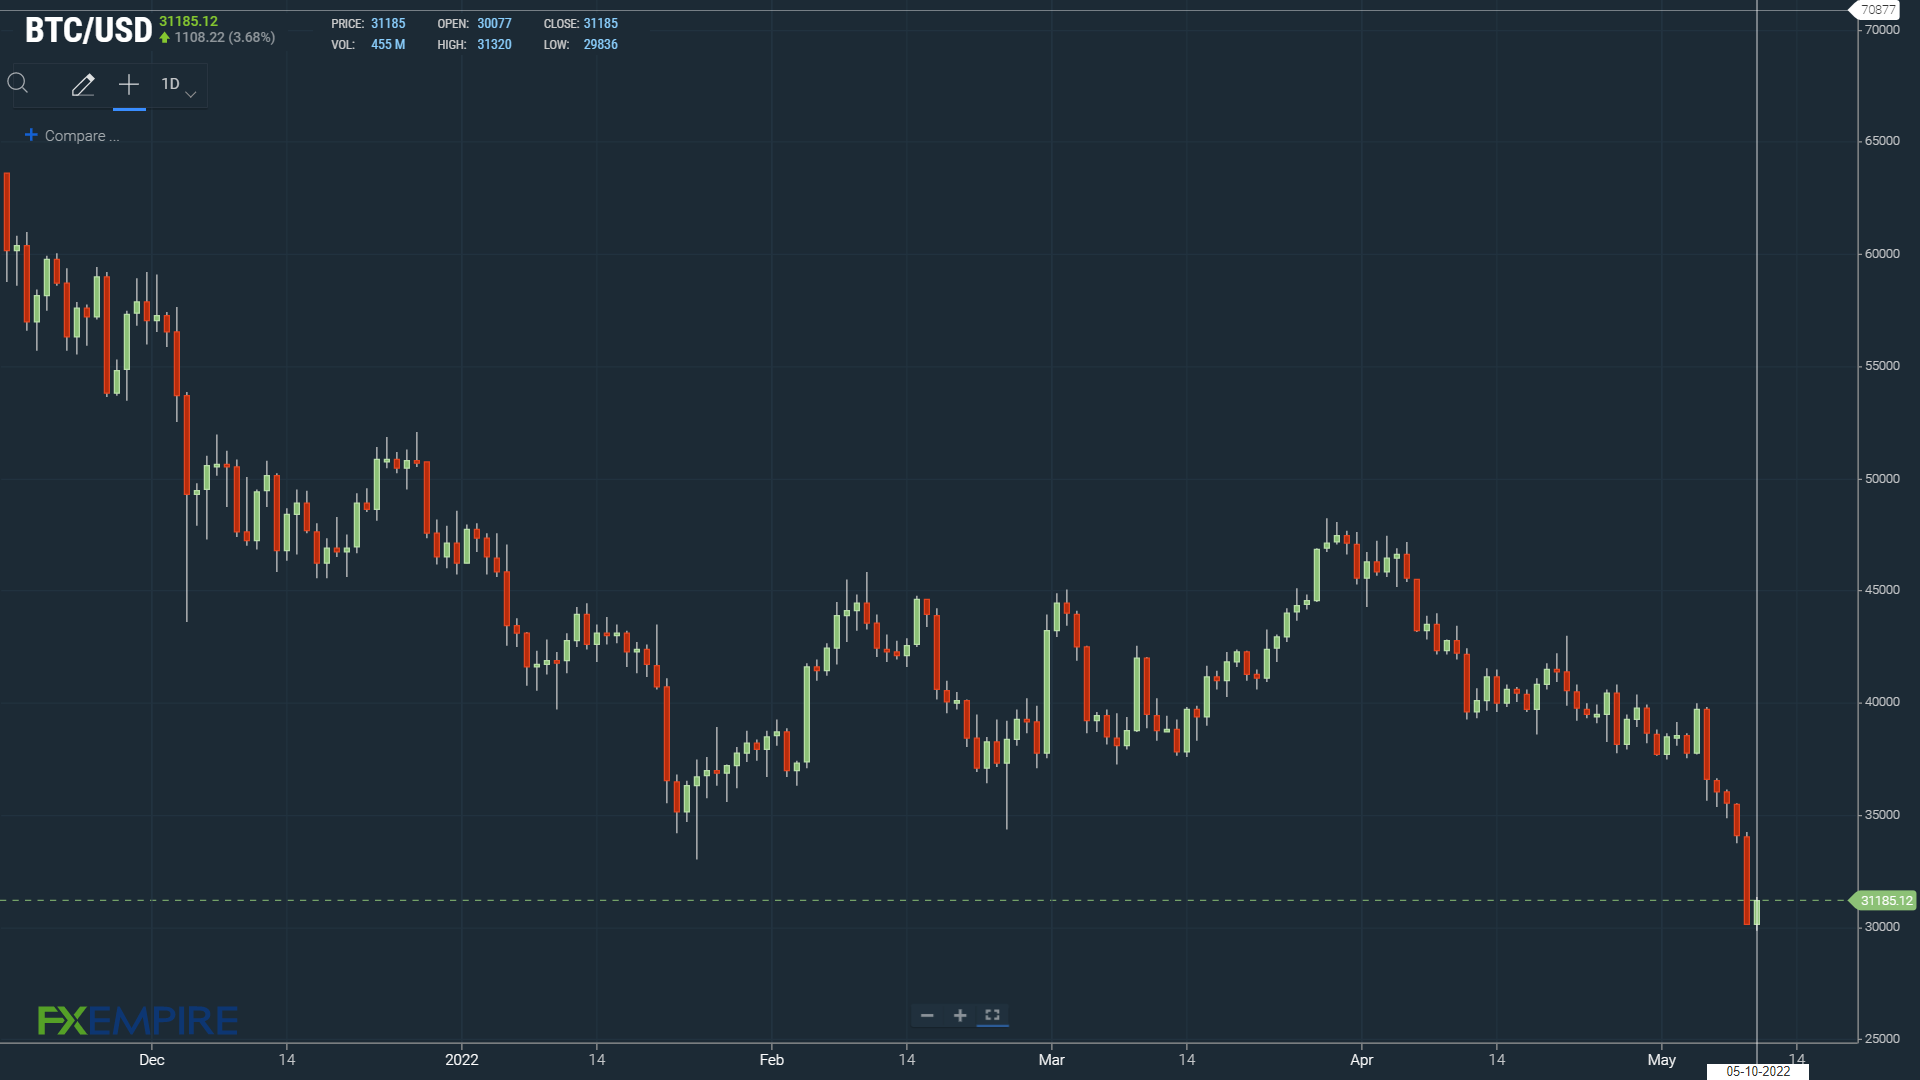
The reversal saw bitcoin slide through January’s previous current year low of $32,991 with ease.

Bitcoin Fear & Greed Index Hits Reverse
This morning, the Fear & Greed Index fell deeper into the “Extreme Fear” zone. The Index fell from 11/100 to 10/100, suggesting a possible bottom at $30,000. This is the lowest level since January 8, when the Index also sat at 10/100.
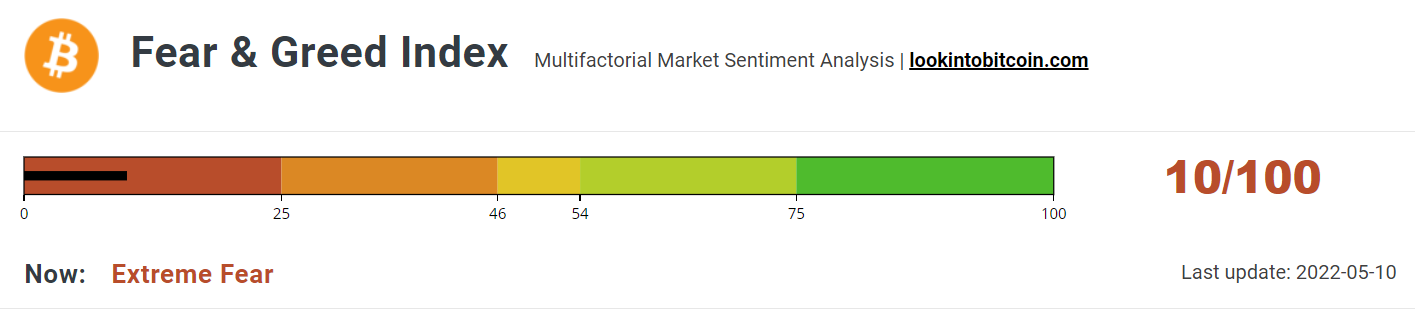
The modest decline came despite bitcoin’s 11.63% loss.
The “Extreme Fear” zone, however, reflects investor expectations of further price deterioration, which is aligned with the technical indicators.
In late March, the Index hit a current year high of 60/100, recovering from a January-8 current year low of 10/100.
With the Index sitting at a current year low, downside risk remains. Bitcoin now needs to hold above a June 22, 2021 low of $28,908 to avoid the risk of a fall back to sub-$25,000 levels.
NASDAQ-Sell-Off Tests Bitcoin Support as Investors Dump Riskier Assets
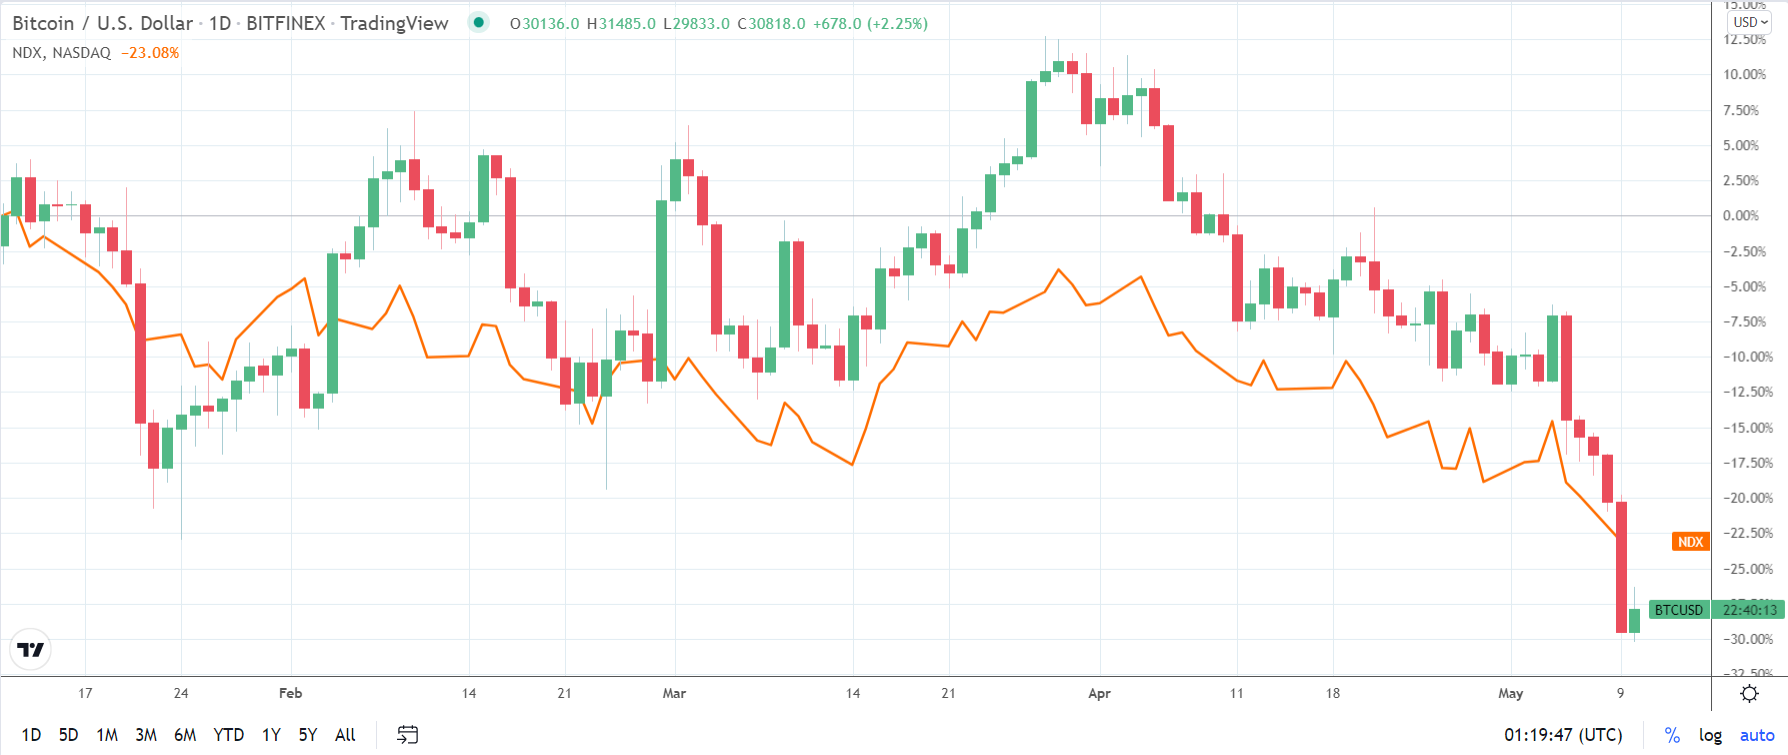
On Monday, the NASDAQ 100 tumbled by 4.29% to end the day at 11,623.25. The last time the NASDAQ was at current levels (Nov-2020), bitcoin was at sub-$20,000.
At the time of writing, the NASDAQ 100 Mini was down by a modest 15.75 points ahead of tomorrow’s US inflation figures.
This morning’s movements across the crypto market suggest a bottom for riskier assets. A dead cat bounce could be in play, however, with no market event unfolding to support a rebound.
Bitcoin (BTC) Price Action
At the time of writing, BTC was up by 3.68% to $31,185. A bearish start to the day saw bitcoin fall to a morning low of $29,836 before finding support.
Through the early morning, a hold above a July 20, 2021 low of $29,320 was key.
Technical Indicators
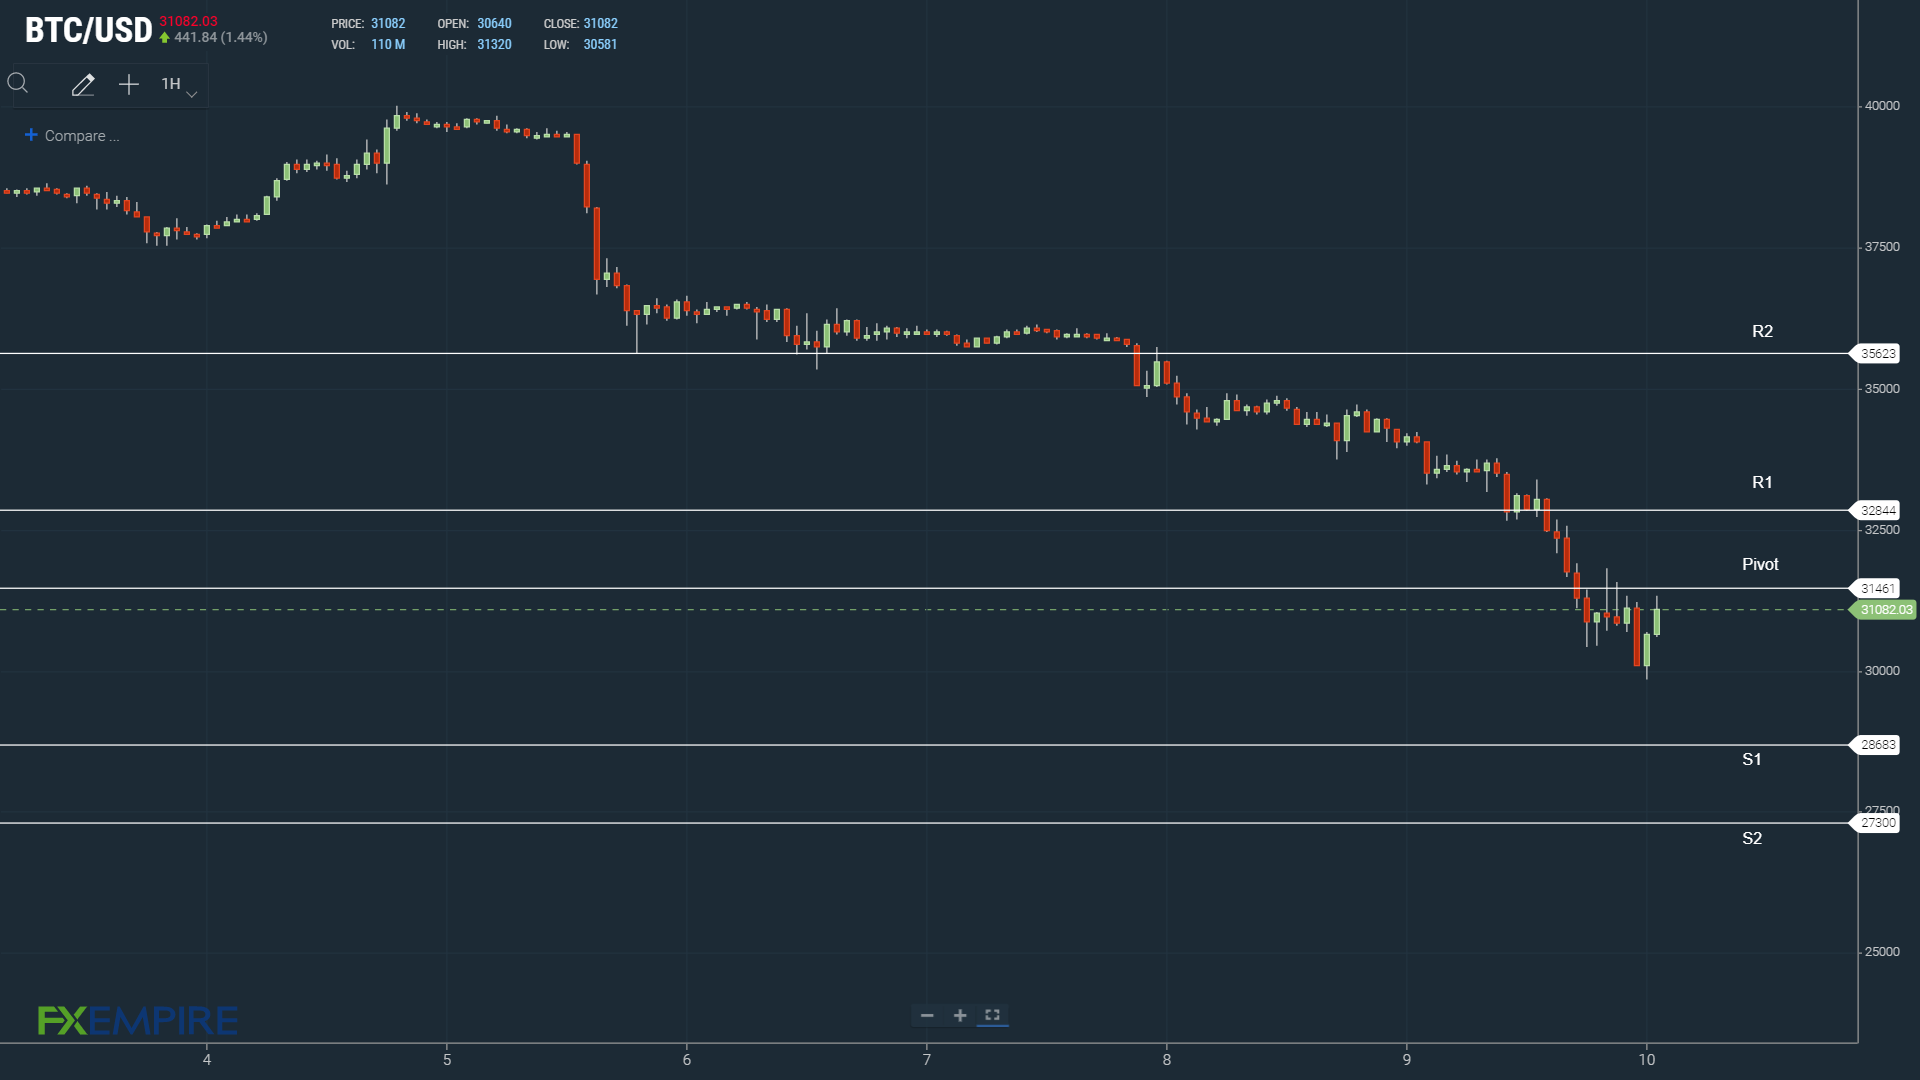
BTC will need to move through the day’s $31,461 pivot to target the First Major Resistance Level at $32,844. BTC would need broader market support to break out from $31,500.
In the event of an extended rally, BTC could test the Second Major Resistance Level at $35,623. The Third Major Resistance Level sits at $39,782.
Failure to move through the pivot would bring the First Major Support Level at $28,683 into play. Barring another extended sell-off, BTC should avoid the Second Major Support Level at $27,300.
Looking at the EMAs and the 4-hourly candlestick chart (below), it is a bearish signal. BTC sits below the 50-day EMA, currently at $35,731. This morning, we saw the 50-day EMA pull back from the 100-day EMA, delivering downside pressure. The 100-day EMA also fell back from the 200-day EMA, BTC negative.
A move through the 50-day EMA would support a look at $37,000.