US BTC-spot ETF Market Ends Seven-Day Outflow Streak
Bitcoin (BTC) rallied 6.42% on Friday (May 3). Following a 1.16% gain on Thursday (May 2), BTC closed the session at $62,938.
Investors reacted to the US Jobs Report and ISM Services PMI Survey. Weaker-than-expected data rekindled investor expectations of a September Fed interest rate cut.
Average hourly earnings rose 3.9% year-on-year in April after increasing by 4.1% in March. Nonfarm payrolls advanced by 175k after jumping by 315k in March. Softer-than-expected wages could impact disposable income and consumer spending. Downward trends in consumer spending may dampen demand-driven inflation and allow for a more dovish Fed rate path.
Furthermore, the US ISM Services PMI fell from 51.4 to 49.4 in April, influencing sentiment toward the Fed rate path.
BTC-spot market flow data for Friday (May 3) reflected market relief from the Friday numbers.
According to Farside Investors.

- Grayscale Bitcoin Trust (GBTC) recorded net inflows of $63.0 million on Friday (May 3), the first since before January 11.
- Fidelity Wise Origin Bitcoin Fund (FBTC) saw net inflows of $102.6 million, the first since April 24.
- Franklin Bitcoin ETF (EZBC) recorded net inflows of $60.9 million, its highest since launch.
- Bitwise Bitcoin ETF (BITB), ARK 21Shares Bitcoin ETF (ARKB), Invesco Galaxy Bitcoin ETF (BTCO), Valkyrie Bitcoin Fund (BRRR), and VanEck Bitcoin Trust (HODL) also saw inflows on Friday (May 3).
- Excluding flow data for iShares Bitcoin Trust (IBIT), the US BTC-spot ETF market recorded total net inflows of $302.6 million. Significantly, inflows for Friday ended a seven-day outflow streak.
Technical Analysis
Bitcoin Analysis
BTC hovered below the 50-day EMA while remaining above the 200-day EMA. The EMAs affirmed the bearish near-term but bullish longer-term price signals.
A BTC break above the 50-day EMA and the $60,365 resistance level could give the bulls a run at the $69,000 resistance level. However, selling pressure may increase at the $64,000 resistance level. The 50-day EMA is confluent with the resistance level.
On Saturday (May 4), investors will likely consider the US data from Friday and BTC-spot ETF flow trends.
Conversely, a BTC break below the $60,365 support level could give the bears a run at the $55,000 handle.
With a 47.04 14-Daily RSI reading, BTC could drop to the $55,000 handle before entering oversold territory.
Bitcoin Price Forecast
Every new Bitcoin analysis as it publishes, today's technical signal and key levels, live price — on one page.
See all Bitcoin forecasts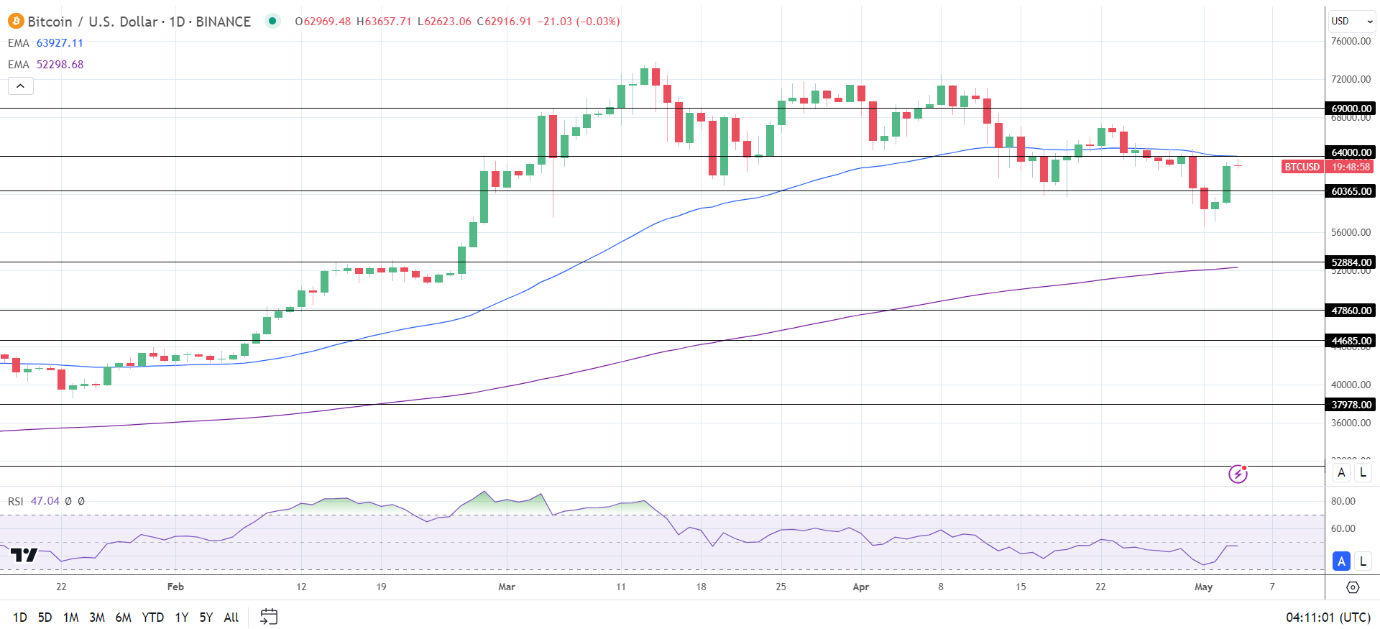
Ethereum Analysis
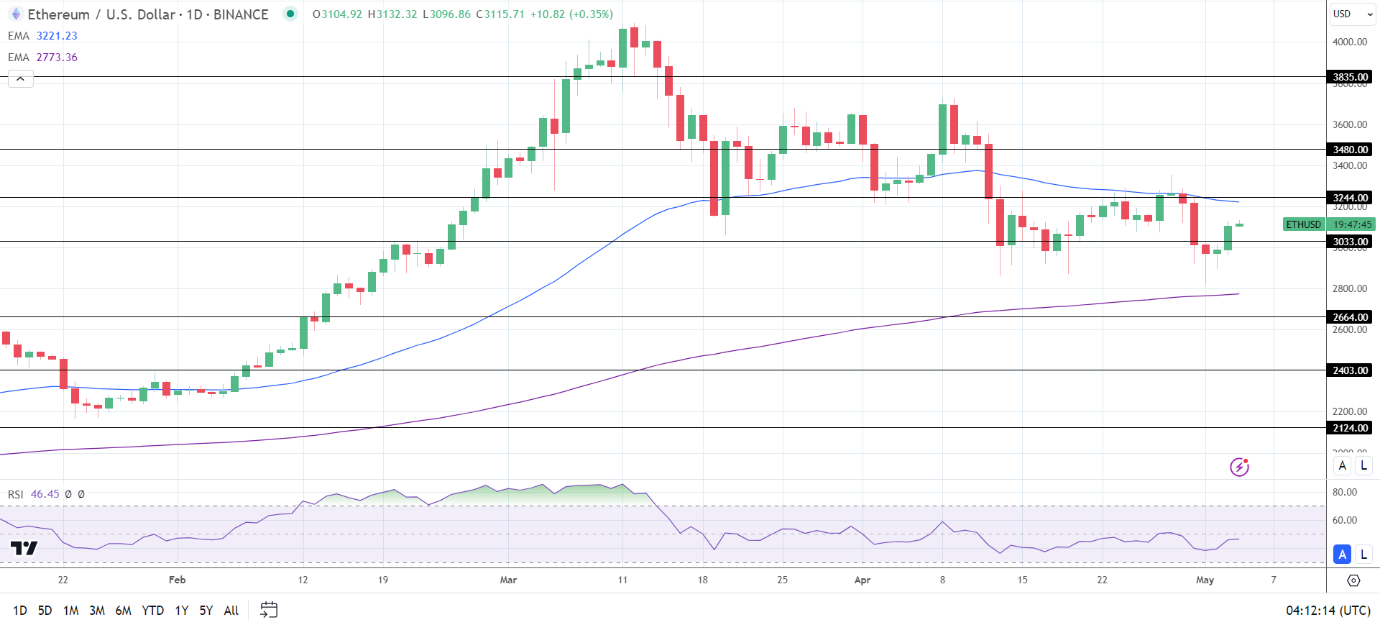
ETH remained below the 50-day EMA while hovering above the 200-day EMA. The EMAs confirmed the bearish near-term but bullish longer-term price trends.
An ETH break above the 50-day EMA and $3,244 resistance level would support a move toward the $3,480 resistance level.
Conversely, an ETH fall through the $3,033 support level could give the bears a run at the 200-day EMA.
The 14-period Daily RSI reading of 46.45 indicates an ETH drop to the 200-day EMA before entering oversold territory.