Key Insights:
- On Sunday, bitcoin (BTC) wrapped up a bearish weekend with a 1.29% fall to end the week at $19,067.
- Market angst over US inflation and the Fed continued to weigh, with the NASDAQ 100 Mini adding pressure in the final hour (UTC).
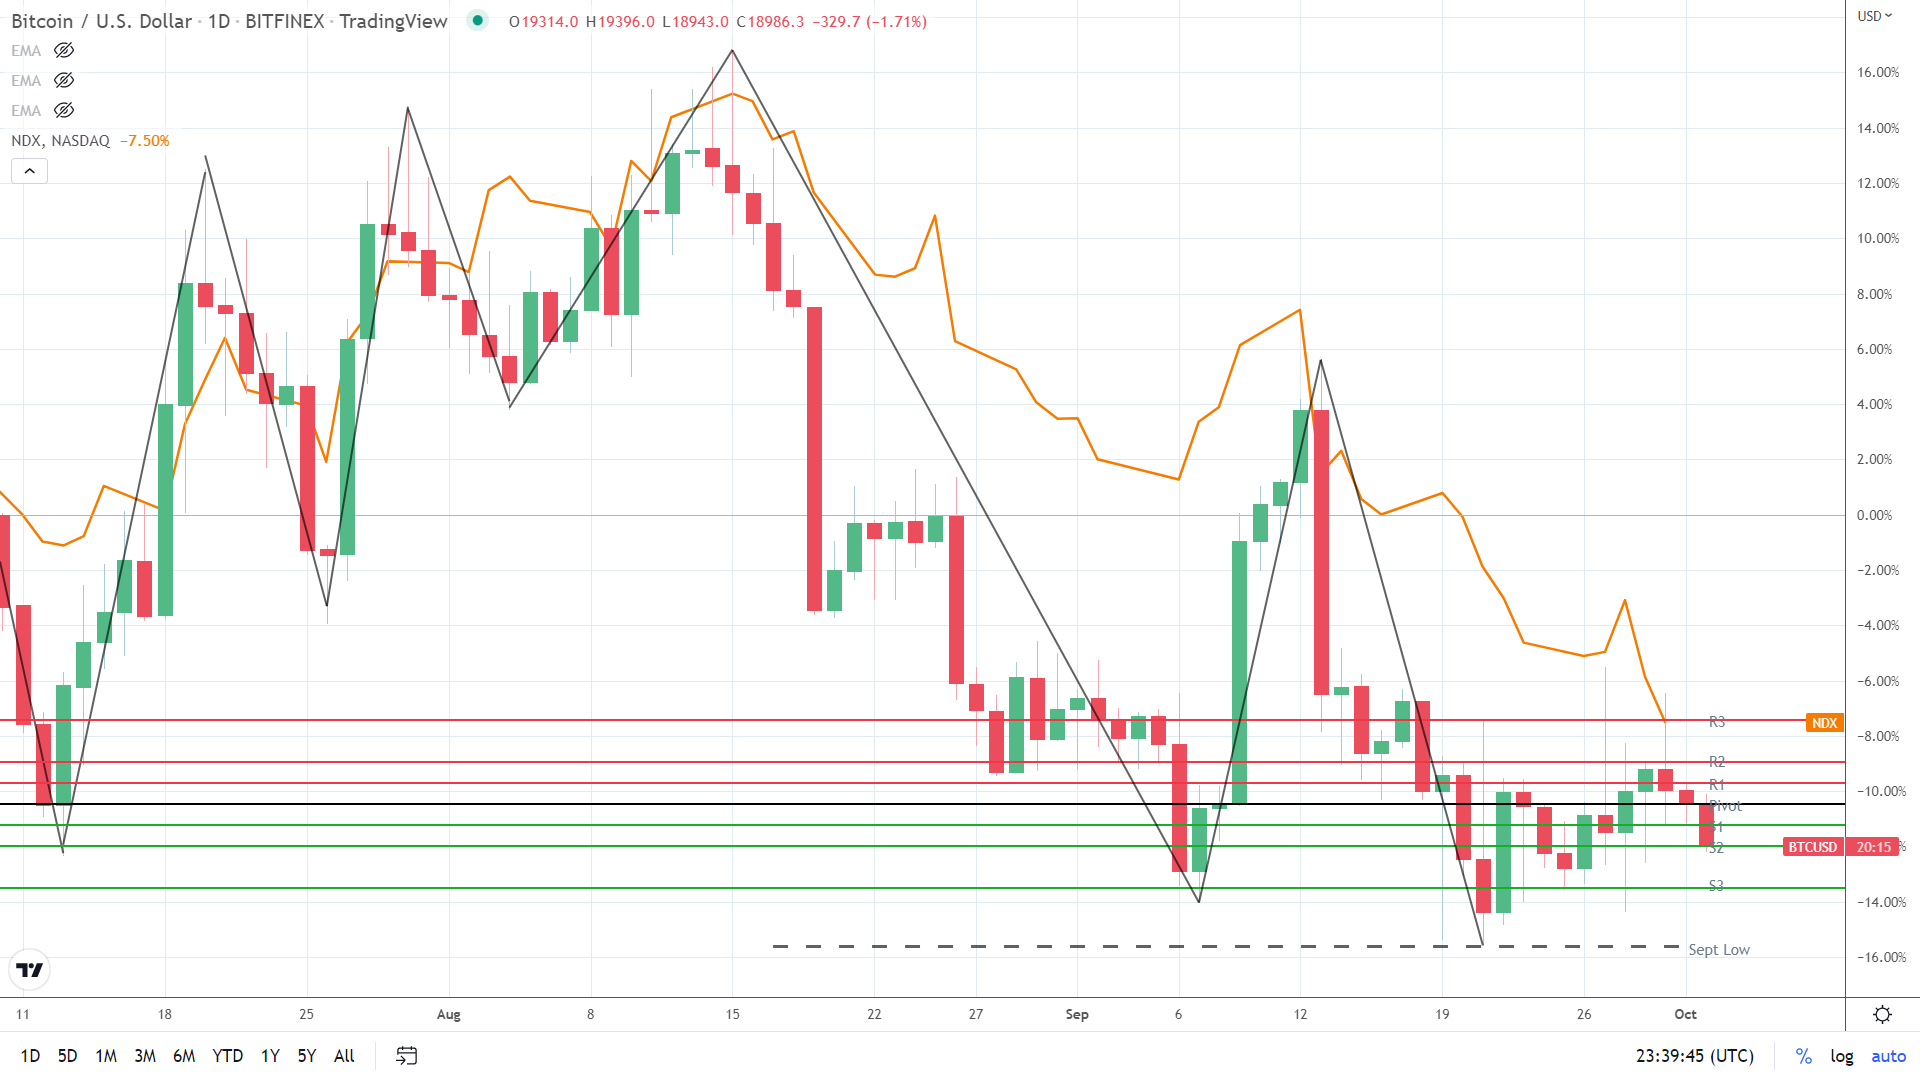
- Despite the bearish session, the Bitcoin Fear & Greed Index held steady at 24/100.
On Sunday, bitcoin (BTC) fell by 1.29%. Following a 0.59% decline on Saturday, BTC ended the week up 1.33% to $19,067.
A mixed start to the session saw BTC rise to a late morning high of $19,396. Coming up short of the First Major Resistance Level (R1) at $19,482, BTC slid to a final hour low of $18,943.
BTC fell through the First Major Support Level (S1) at $19,154 and the Second Major Support Level (S2) at $18,991 before a partial recovery to $19,067.
While market sentiment Fed fear and investor jitters over the economic outlook lingered, the NASDAQ 100 Mini weighed. BTC moved within tight ranges before the NASDAQ Mini influence. A fall in the NASDAQ 100 Mini sent BTC to sub-$19,000 in the final hour (UTC).
At the time of writing, the NASDAQ 100 Mini was down 115.50 points.

Bitcoin Fear & Greed Index Holds Steady Despite Bearish Session
Today, the Fear & Greed Index held steady at 24/100. A bearish BTC session, weighed by the NASDAQ 100 Mini, led BTC into the red. However, BTC recovered from sub-$19,000, which continued to suggest a bottoming out.
US inflation figures from Friday, Fed monetary policy, and the economic outlook remained crypto market headwinds.
For the bulls, the Index will need to continue to avoid sub-20/100 to support a shift in sentiment. However, a fall to sub-20/100 would signal a BTC slide to sub-$18,000.
Bitcoin Price Forecast
Every new Bitcoin analysis as it publishes, today's technical signal and key levels, live price — on one page.
See all Bitcoin forecasts
Bitcoin (BTC) Price Action
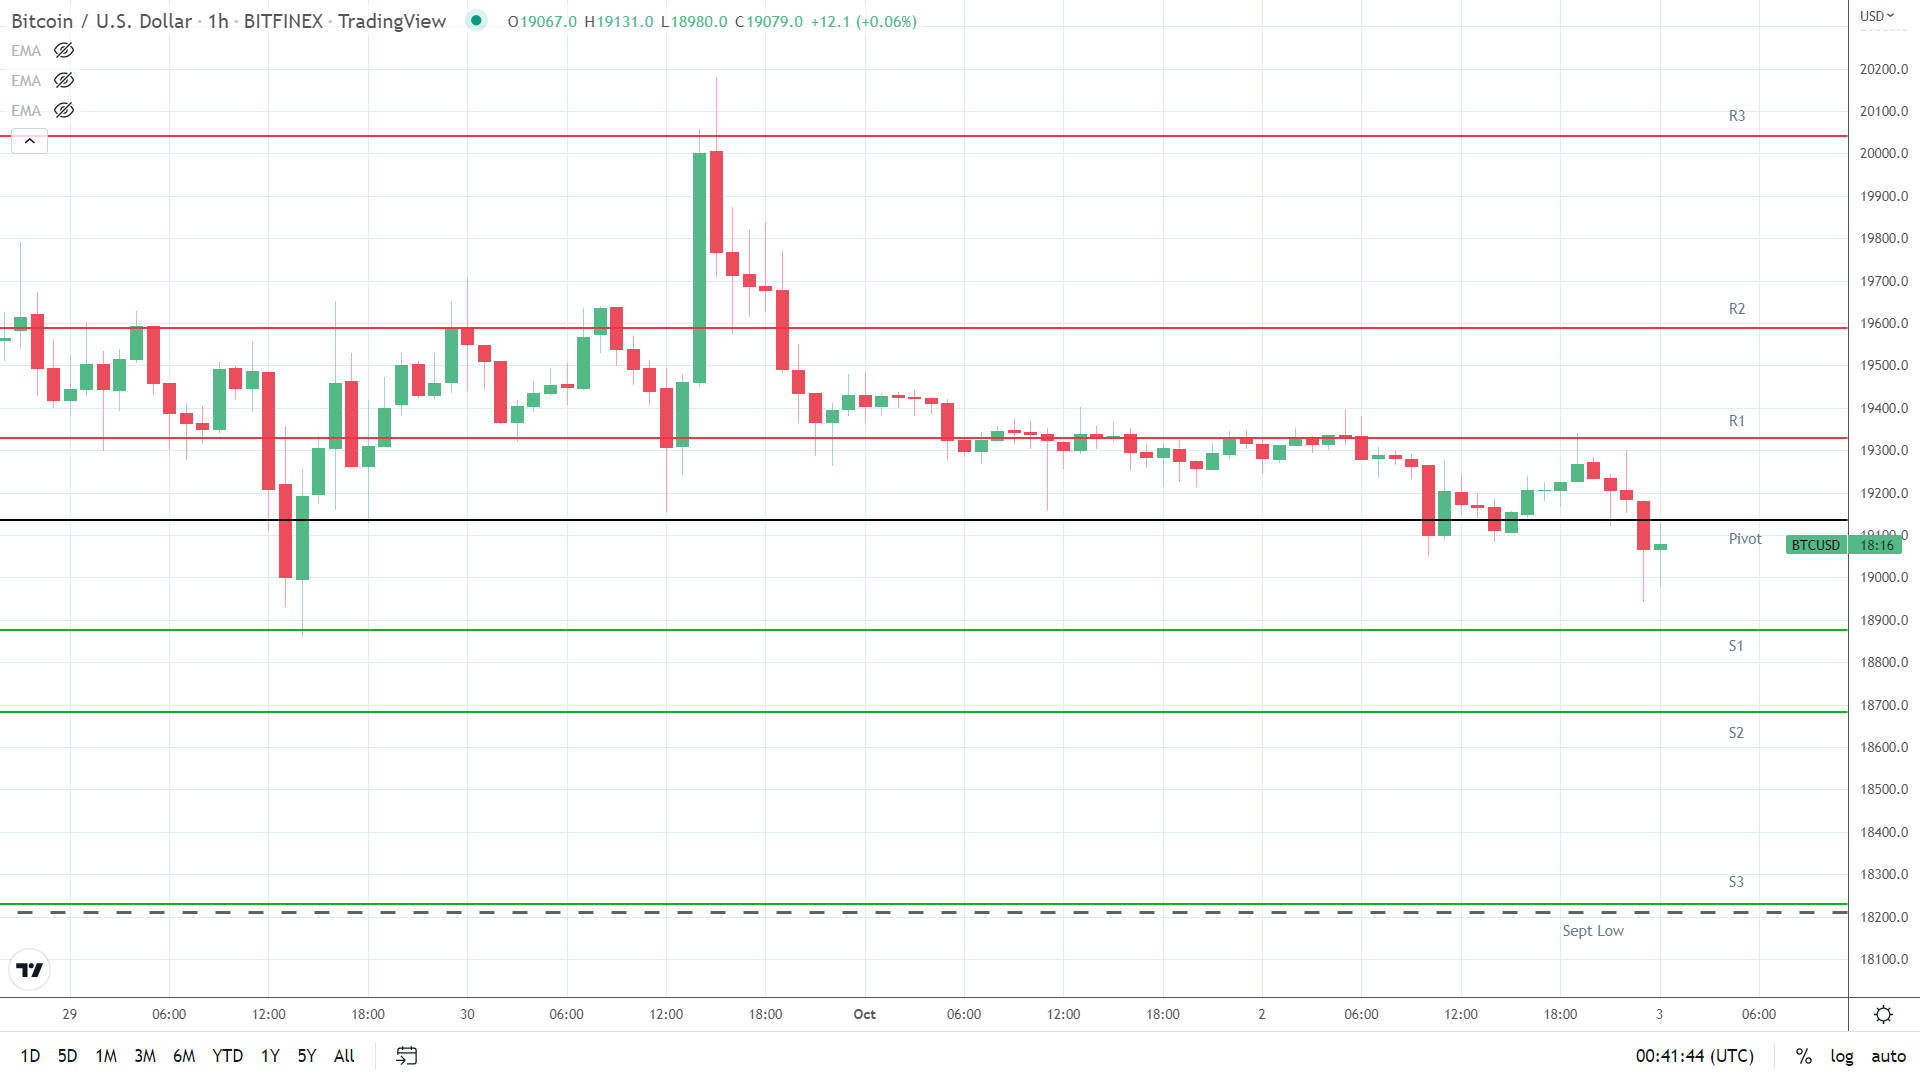
At the time of writing, BTC was up 0.04% to $19,074. A choppy start to the day saw BTC fall to an early low of $18,980 before rising to a high of $19,131.
Technical Indicators
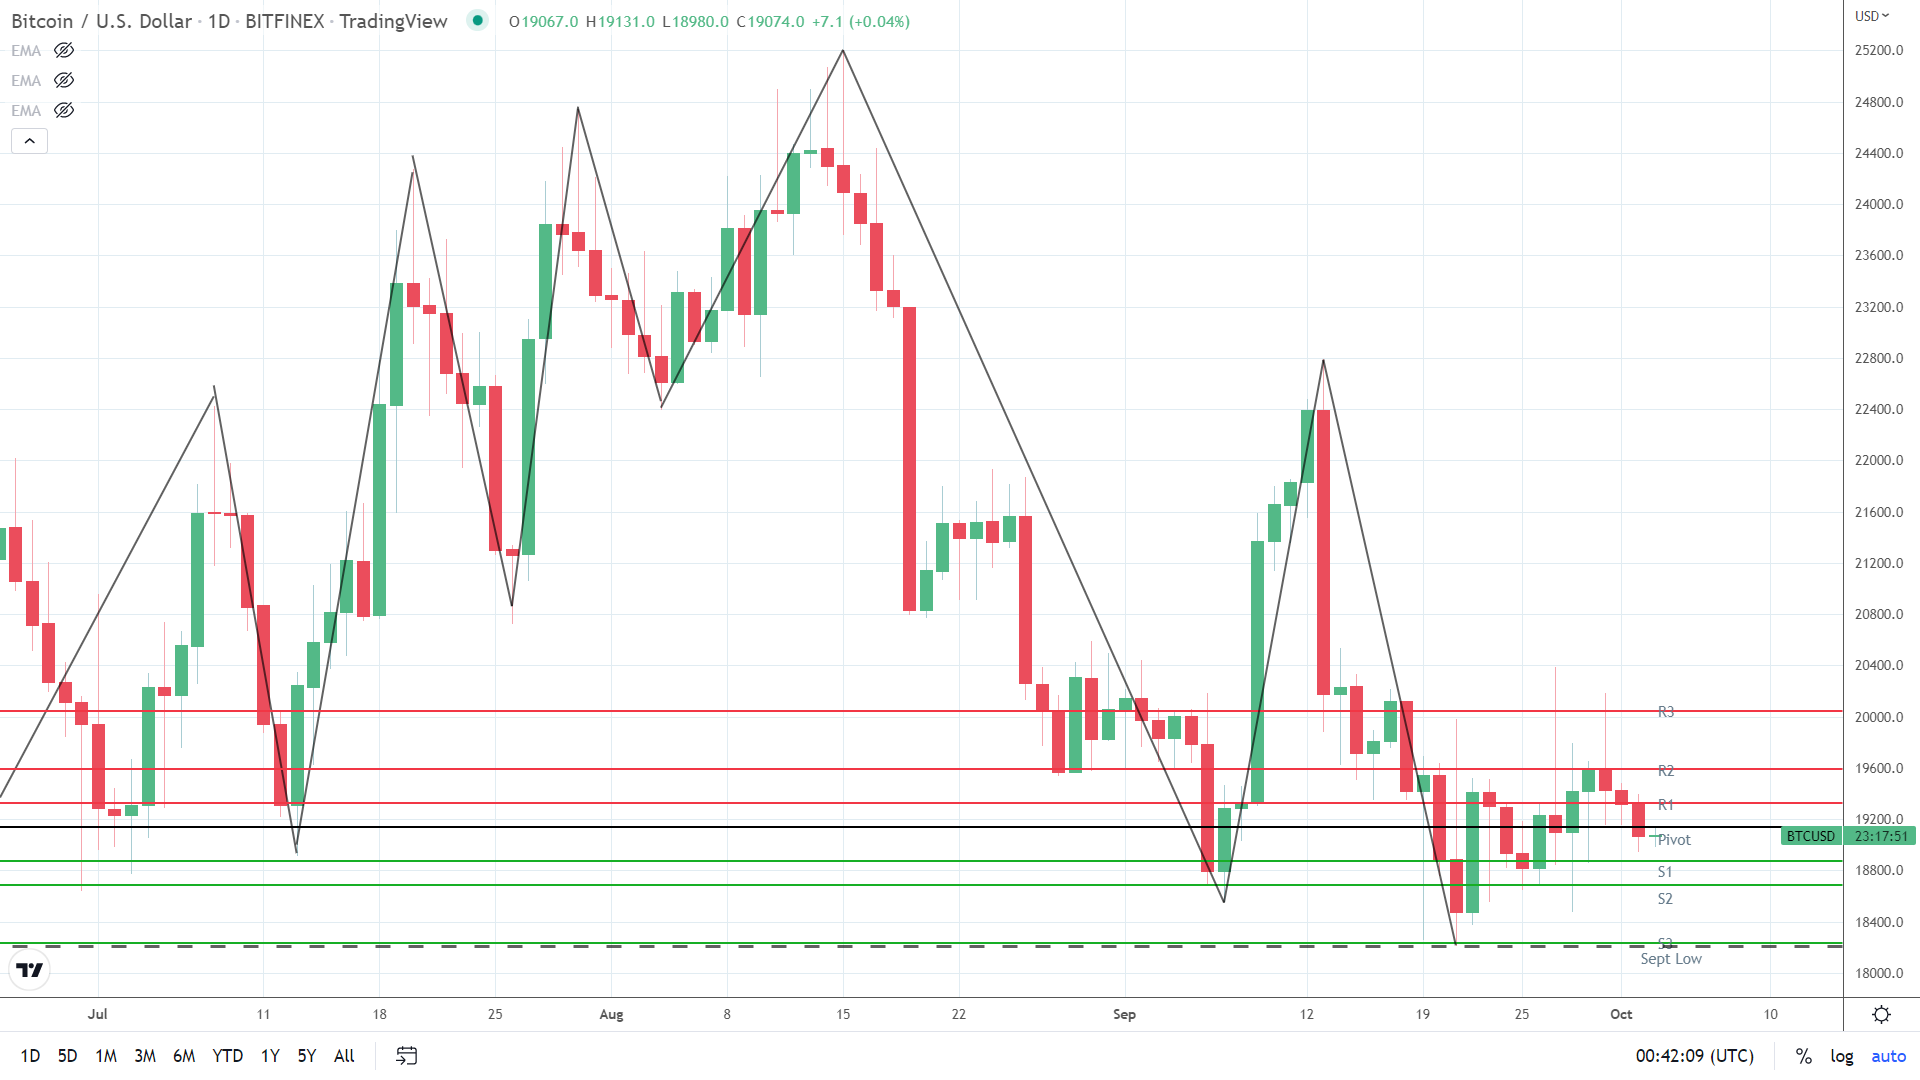
BTC needs to move through the $19,135 pivot to target the First Major Resistance Level (R1) at $19,328 and the Sunday high of $19,396. A BTC move through the Sunday high of $19,396 would signal a bullish session.
In the case of another extended rally, BTC should test the Second Major Resistance Level (R2) at $19,588 and target the Third Major Resistance Level (R3) at $20,041.
Failure to move through the pivot would leave the First Major Support Level (S1) at $18,875 in play. Barring an extended sell-off, BTC should avoid sub-$18,500. The Second Major Support Level (S2) at $18,682 will likely limit the downside.
The Third Major Support Level (S3) sits at $18,229.
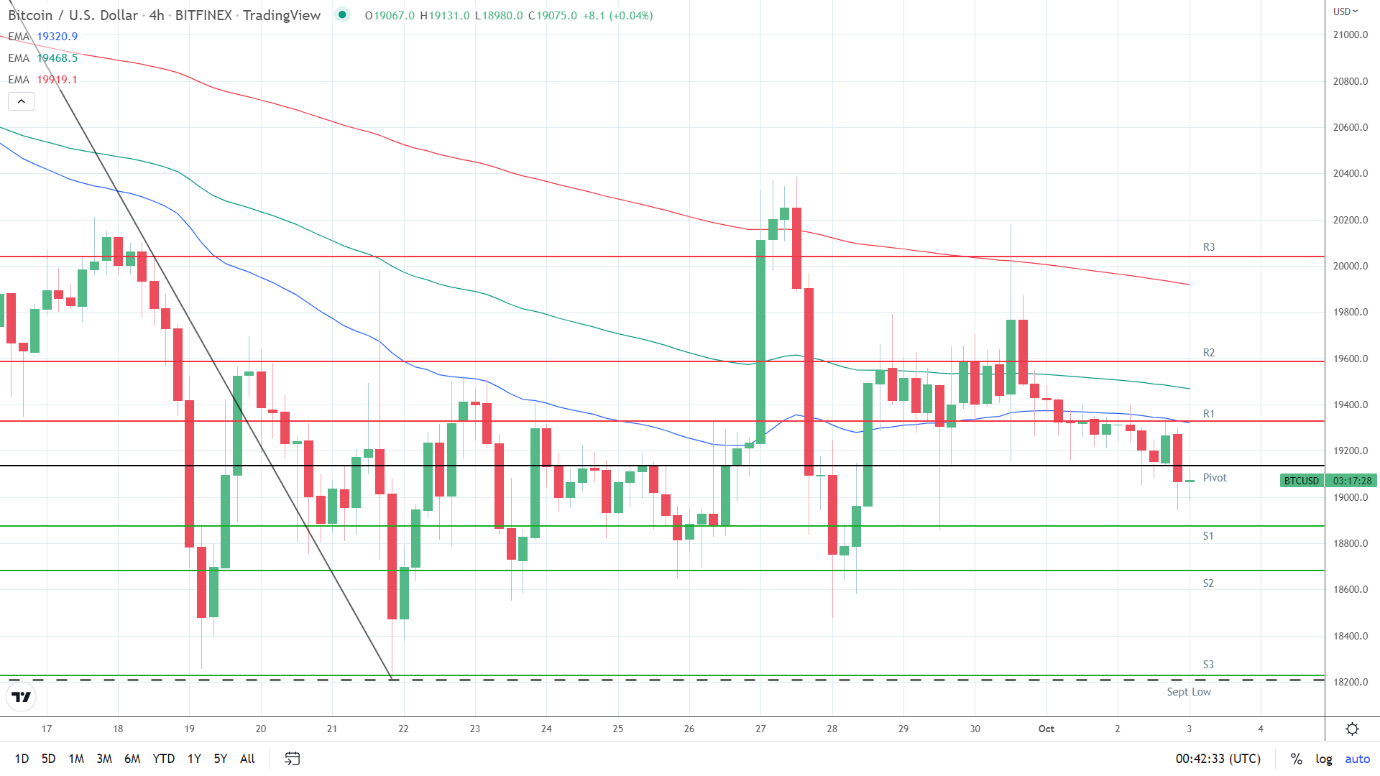
Looking at the EMAs and the 4-hourly candlestick chart (below), it was a bearish signal. This morning, bitcoin sat at the 50-day EMA, currently at $19,321. The 50-day EMA slipped back from the 100-day EMA, with the 100-day EMA easing back from the 200-day EMA, delivering bearish price signals.
A move through the 50-day ($19,321) EMA and R1 ($19,328) would give the bulls a run at the 100-day EMA ($19,469) and R2 ($19,588). The 200-day EMA sits at $19,919. However, a failure to move through the 50-day EMA ($19,321) would give the bears a run at the Major Support Levels.