
Key Insights
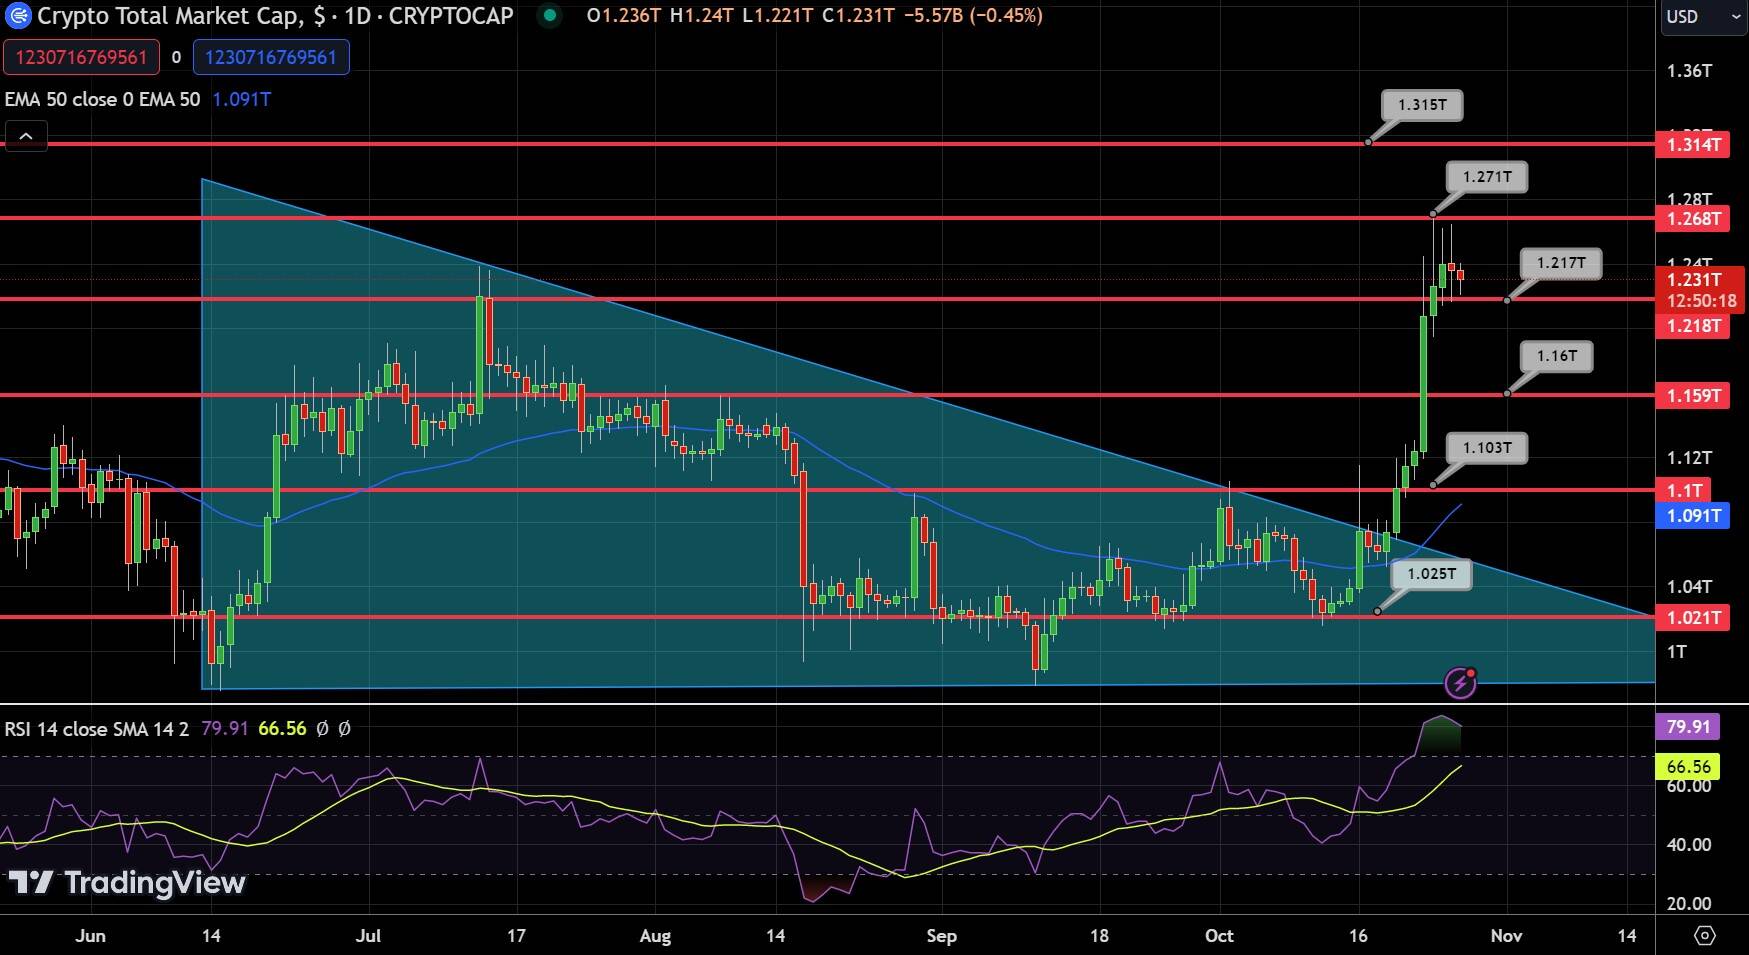
- Global cryptocurrency market cap drops 1.30% in the last day to stand at $1.3 trillion.
- Yearly market perspective reveals a robust growth of 27.15%.
- Stablecoins capture a notable $124 billion market cap, 9.52% of total crypto.
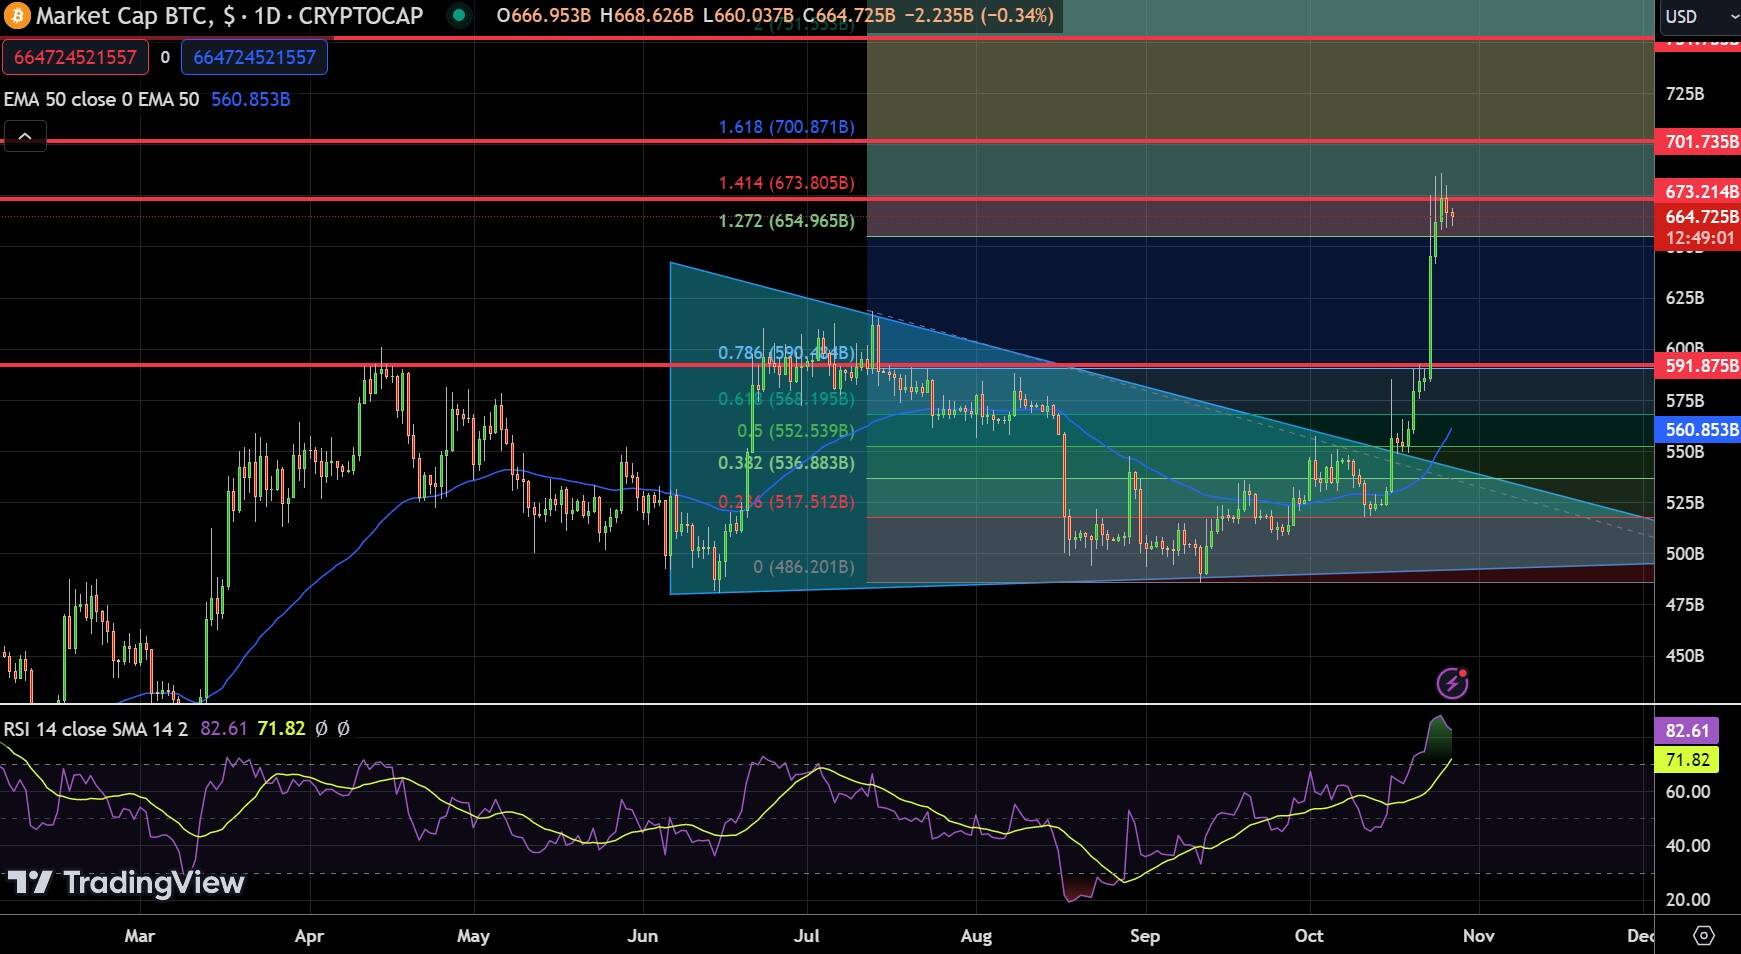
- Bitcoin’s market cap is $665 billion, marking 52.90% dominance in crypto.
- BTC’s position in the market is poised for growth, especially with a potential ETF.
Quick Fundamental Outlook
The global cryptocurrency market cap has slightly adjusted to stand at $1.3 trillion today, marking a decline of 1.30% within the last 24 hours. However, when zooming out to an annual perspective, the market exhibits a robust growth of 27.15%.
Furthermore, it’s worth noting the substantial market cap of Stablecoins, which stands at $124 Billion, securing a 9.52% chunk of the total cryptocurrency market cap.
Bitcoin Market Cap
Bitcoin (BTC) currently encapsulates a market cap of $665 billion, cementing its dominance at 52.90% of the total crypto market. This dominance is a testament to Bitcoin’s continued significance and stature in the crypto realm.
This dominance is a testament to Bitcoin’s continued significance and stature in the crypto realm.
Bitcoin Price Prediction
In today’s trading landscape, Bitcoin (BTC/USD) currently stands at $34,024.78, marking a 2.00% decrease over the past 24 hours. Despite this dip, it remains the leading asset on CoinMarketCap, with a robust market cap of $664.33 billion. The 4-hour chart reveals a pivotal point at $33,951, with immediate resistance anticipated at $35,225.
Should the bullish momentum continue, we could see further resistance at $36,101 and subsequently at $36,977. On the downside, support levels are earmarked at $33,144, followed by $32,442 and $31,826.
Bitcoin Price Forecast
Every new Bitcoin analysis as it publishes, today's technical signal and key levels, live price — on one page.
See all Bitcoin forecastsTechnical indicators offer further insights. The Relative Strength Index (RSI) currently sits at 50, signalling a neutral sentiment. Meanwhile, the price slightly hovers above the 50-day Exponential Moving Average (EMA50) of $33,430, hinting at a possible short-term bullish trend.
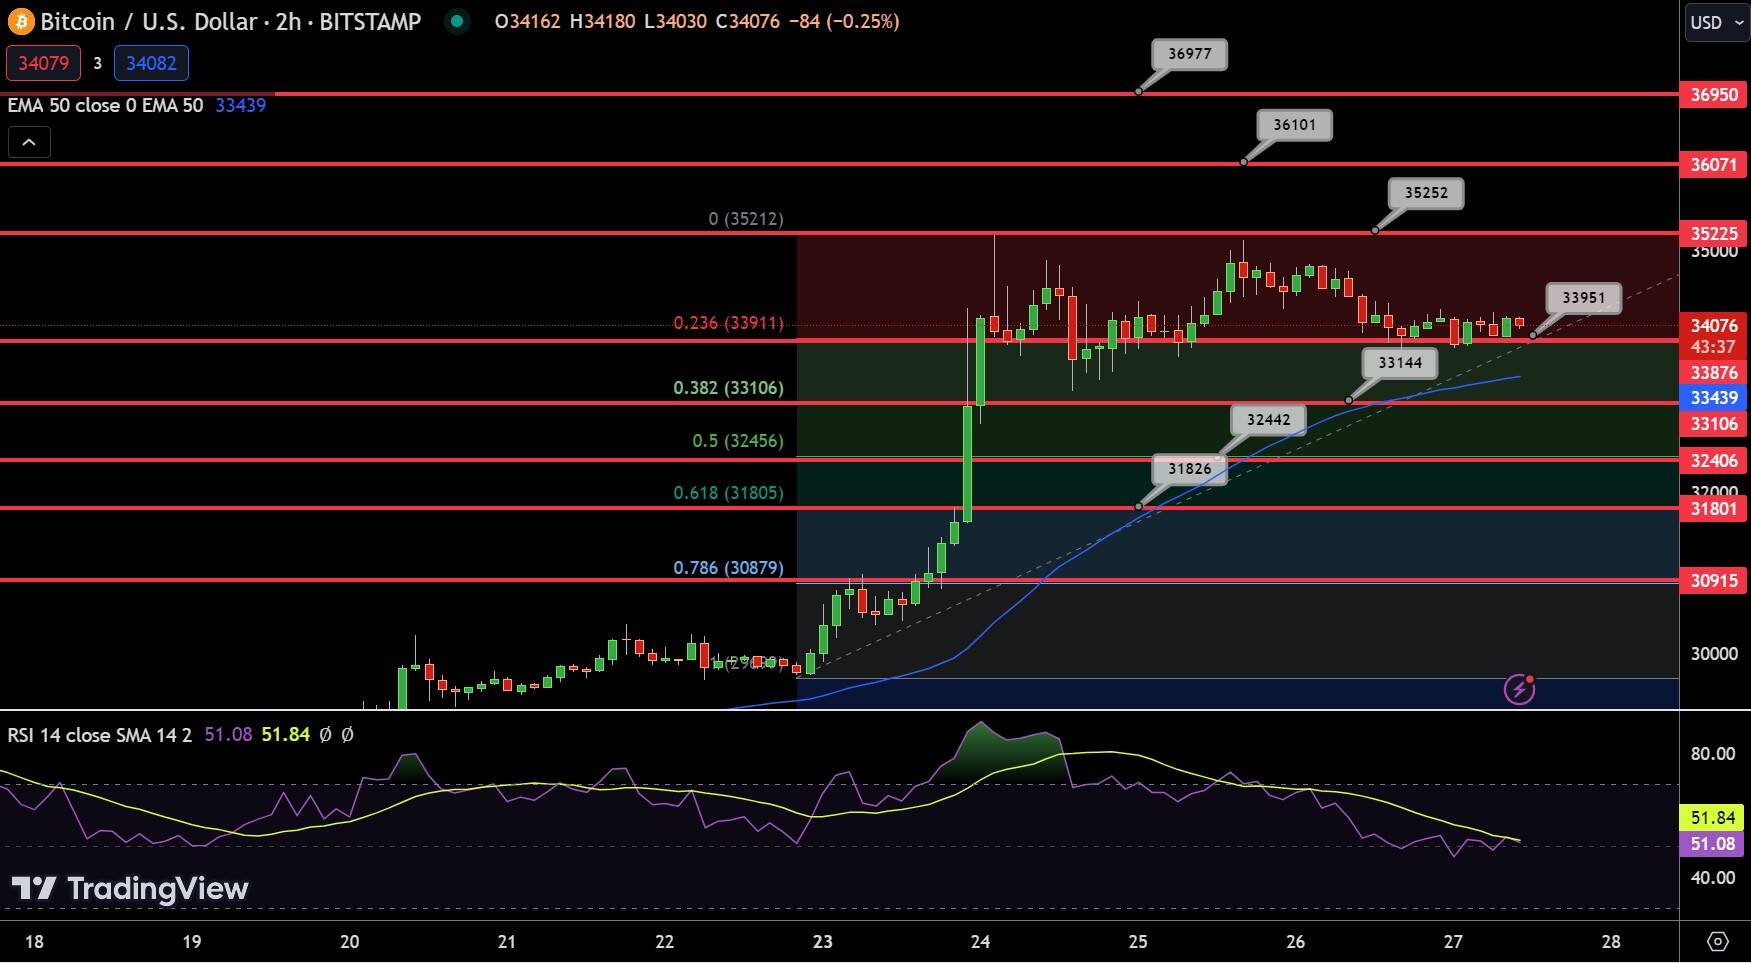
Chart patterns, especially the series of Doji candles above the 23.6% Fibonacci retracement level, suggest indecision among traders. A deeper look suggests immediate support around the 38.2% Fibo mark of $33,100.

In conclusion, the current trend for Bitcoin remains bullish as long as it trades above $33,850. Traders should remain vigilant for potential shifts in market dynamics.