
US crude oil prices dropped below $60 per barrel for the first time in nearly four years. The market has dropped over 15% since last Wednesday following President Trump’s announcement of broad new tariffs on major US trading partners. This sharp downturn highlights growing investor concerns about heightened trade tensions. These tensions could weaken global economic activity and reduce demand in key oil-consuming nations.
The latest tariffs include a 54% duty on China, the world’s largest oil importer, and a 20% levy targeting fentanyl-related trade. Trump also imposed a universal 10% baseline import duty and slashed nearly half the tariffs imposed by US trading partners. This escalation has significantly weakened the outlook for oil demand, as traders anticipate lower industrial activity and reduced fuel consumption globally.
While lower oil prices benefit consumers and reduce inflation, sustained weakness could hurt US oil producers. Companies may slow drilling, cut spending, or lay off workers—especially in energy-heavy states like Texas and New Mexico. Additionally, US energy firms face higher costs for essential materials like steel tubing, now subject to a 25% tariff. With global demand weakening and supply increasing, oil prices may remain under pressure in the near term.
Moreover, eight key OPEC+ producers agreed to raise oil output by 411,000 barrels per day starting in May, much higher than the expected 140,000-barrel increase. This decision triggered a sharp sell-off in oil markets, with Brent crude oil (BCO) dropping below $65 and WTI crude oil (CL) falling below $60 per barrel. The move reflects OPEC’s response to shifting global market conditions, including Trump’s new tariffs and US output pressure. The larger-than-expected supply increase has added bearish momentum to oil prices, intensifying volatility in the energy sector.

WTI Crude Oil (CL) Technical Analysis
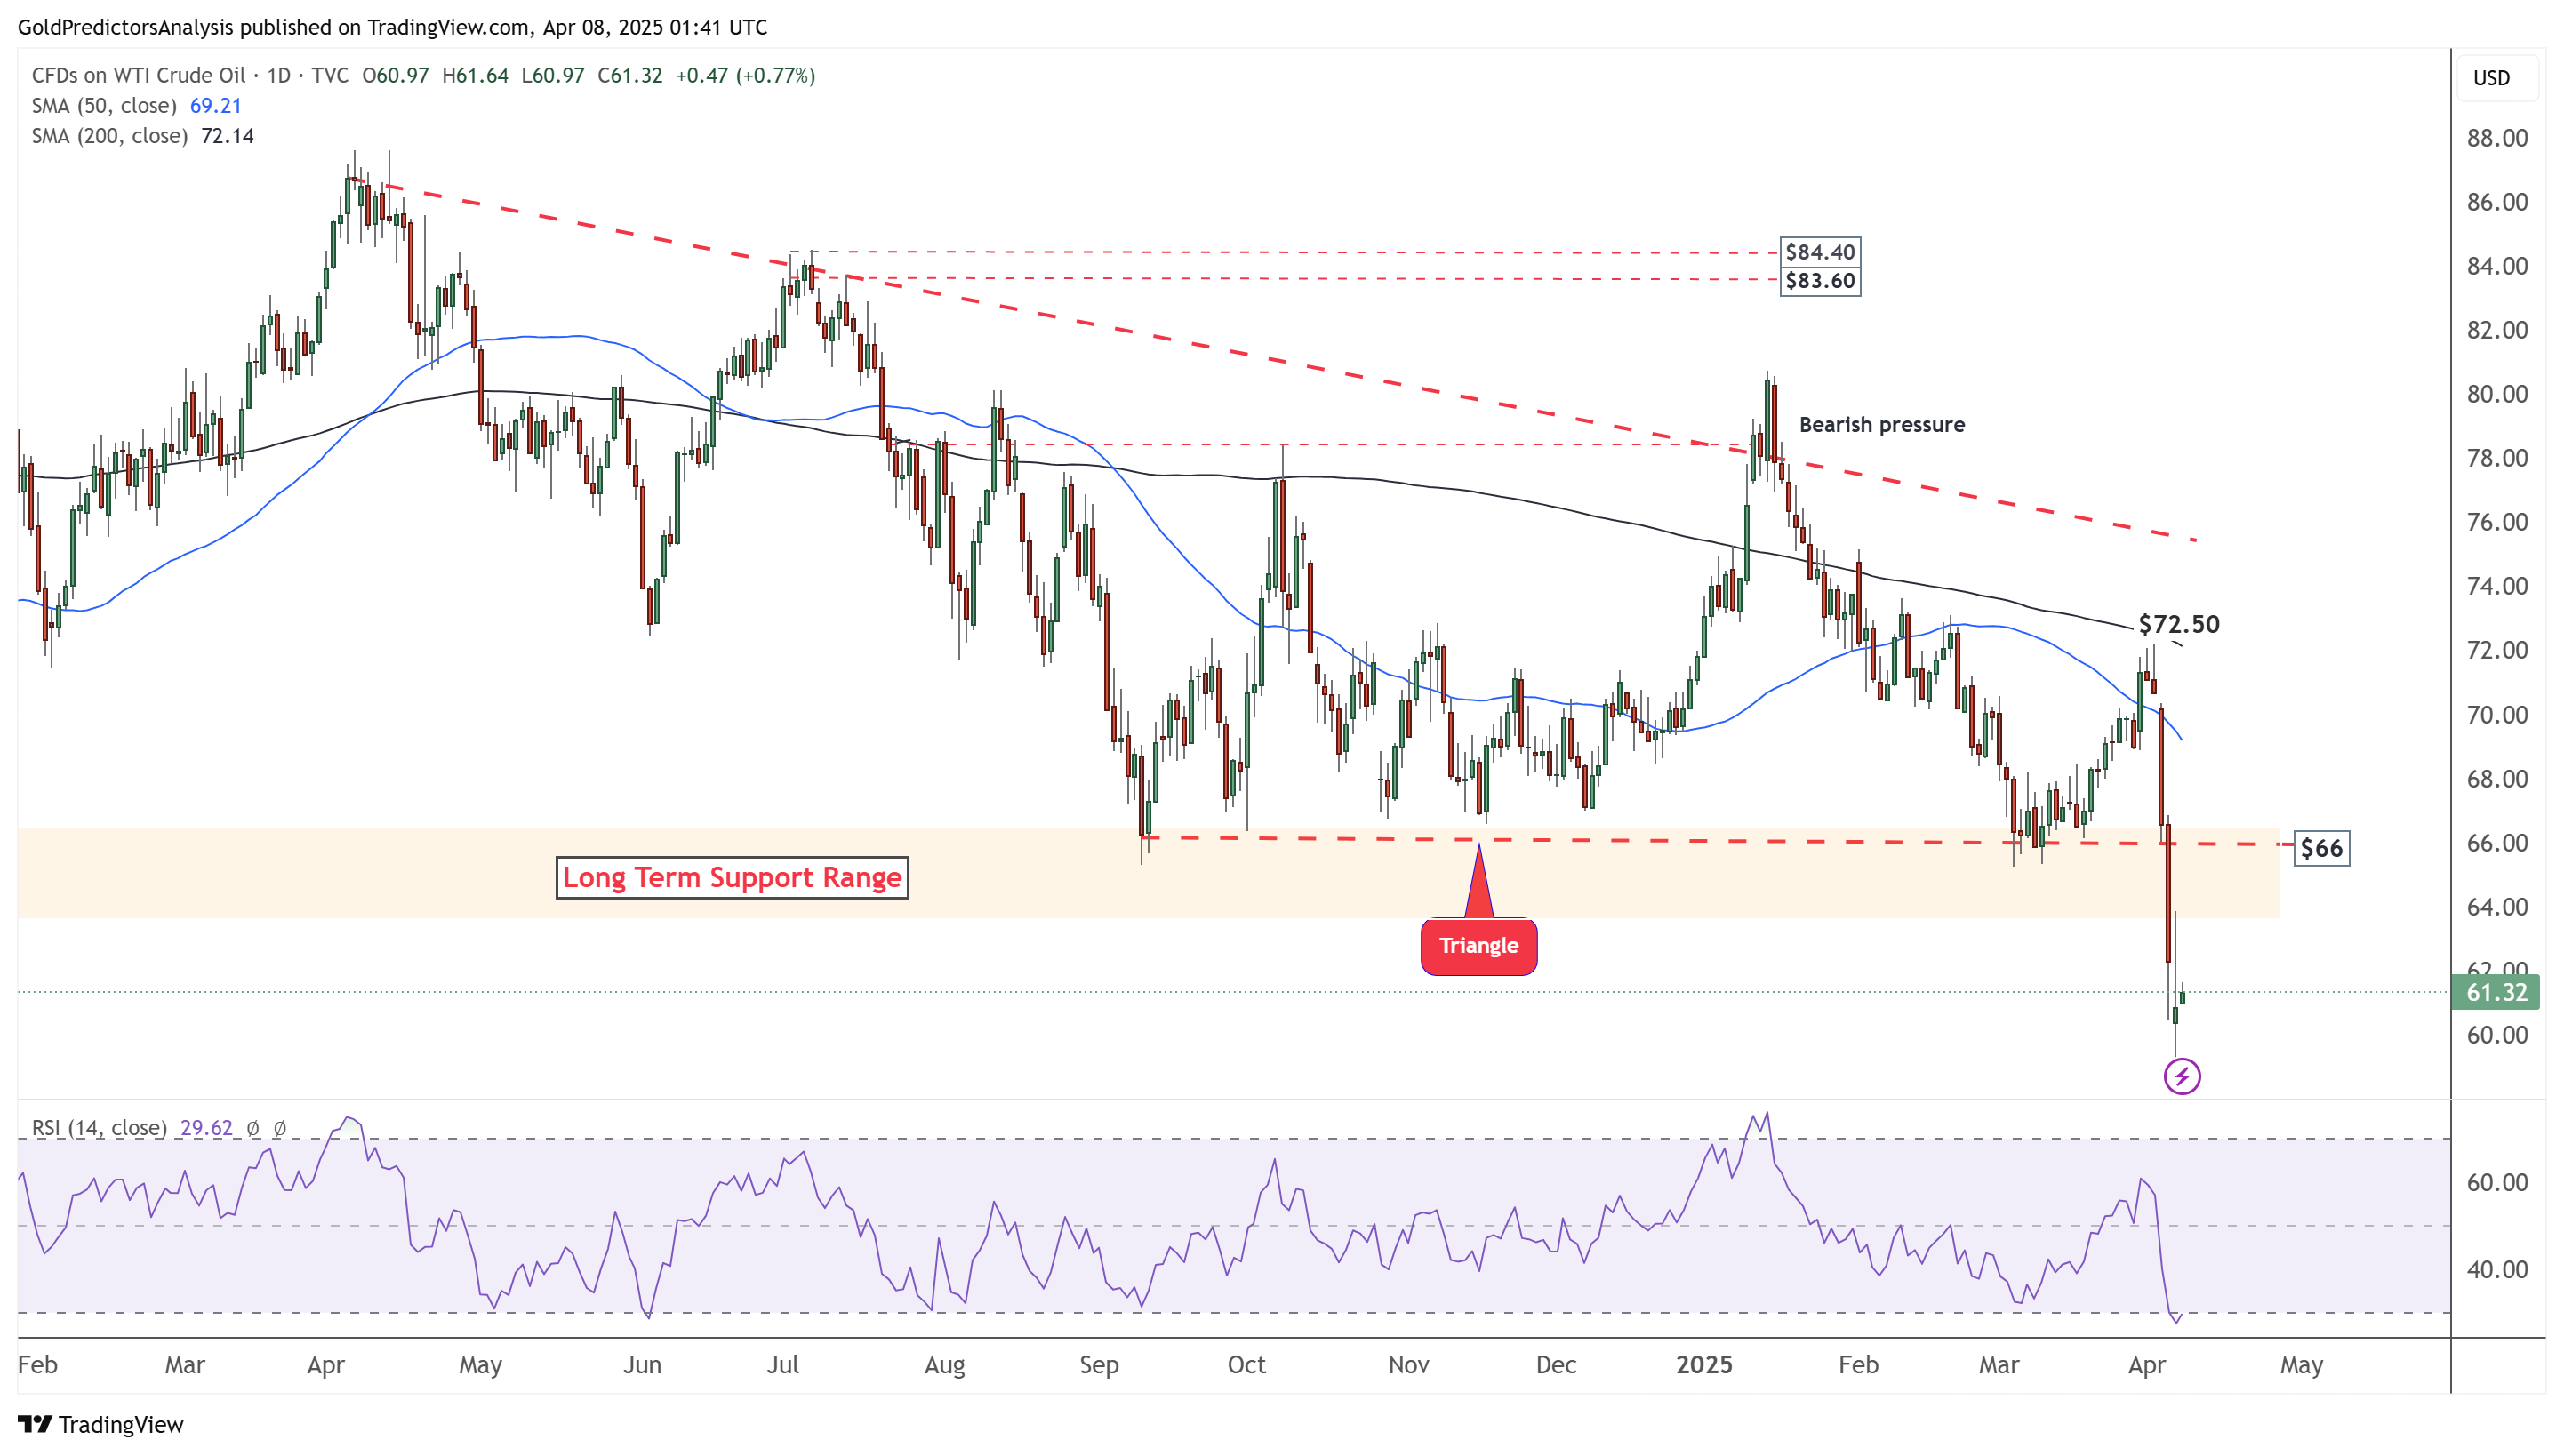
Oil Daily Chart – Long-Term Breakout
The daily chart for WTI crude oil shows that the price has broken below the long-term support range of $65-$66, initiating a strong decline. Prices have also broken the triangle pattern, as indicated by the red-dotted trendline, suggesting that further downside is likely. The 50-day and 200-day SMAs remain in a negative alignment, indicating that the broader trend remains bearish. The sharp drop has pushed WTI crude into oversold territory, possibly leading to a short-term rebound.
Brent Oil Price Forecast
Every new Brent Oil analysis as it publishes, today's technical signal and key levels, live price — on one page.
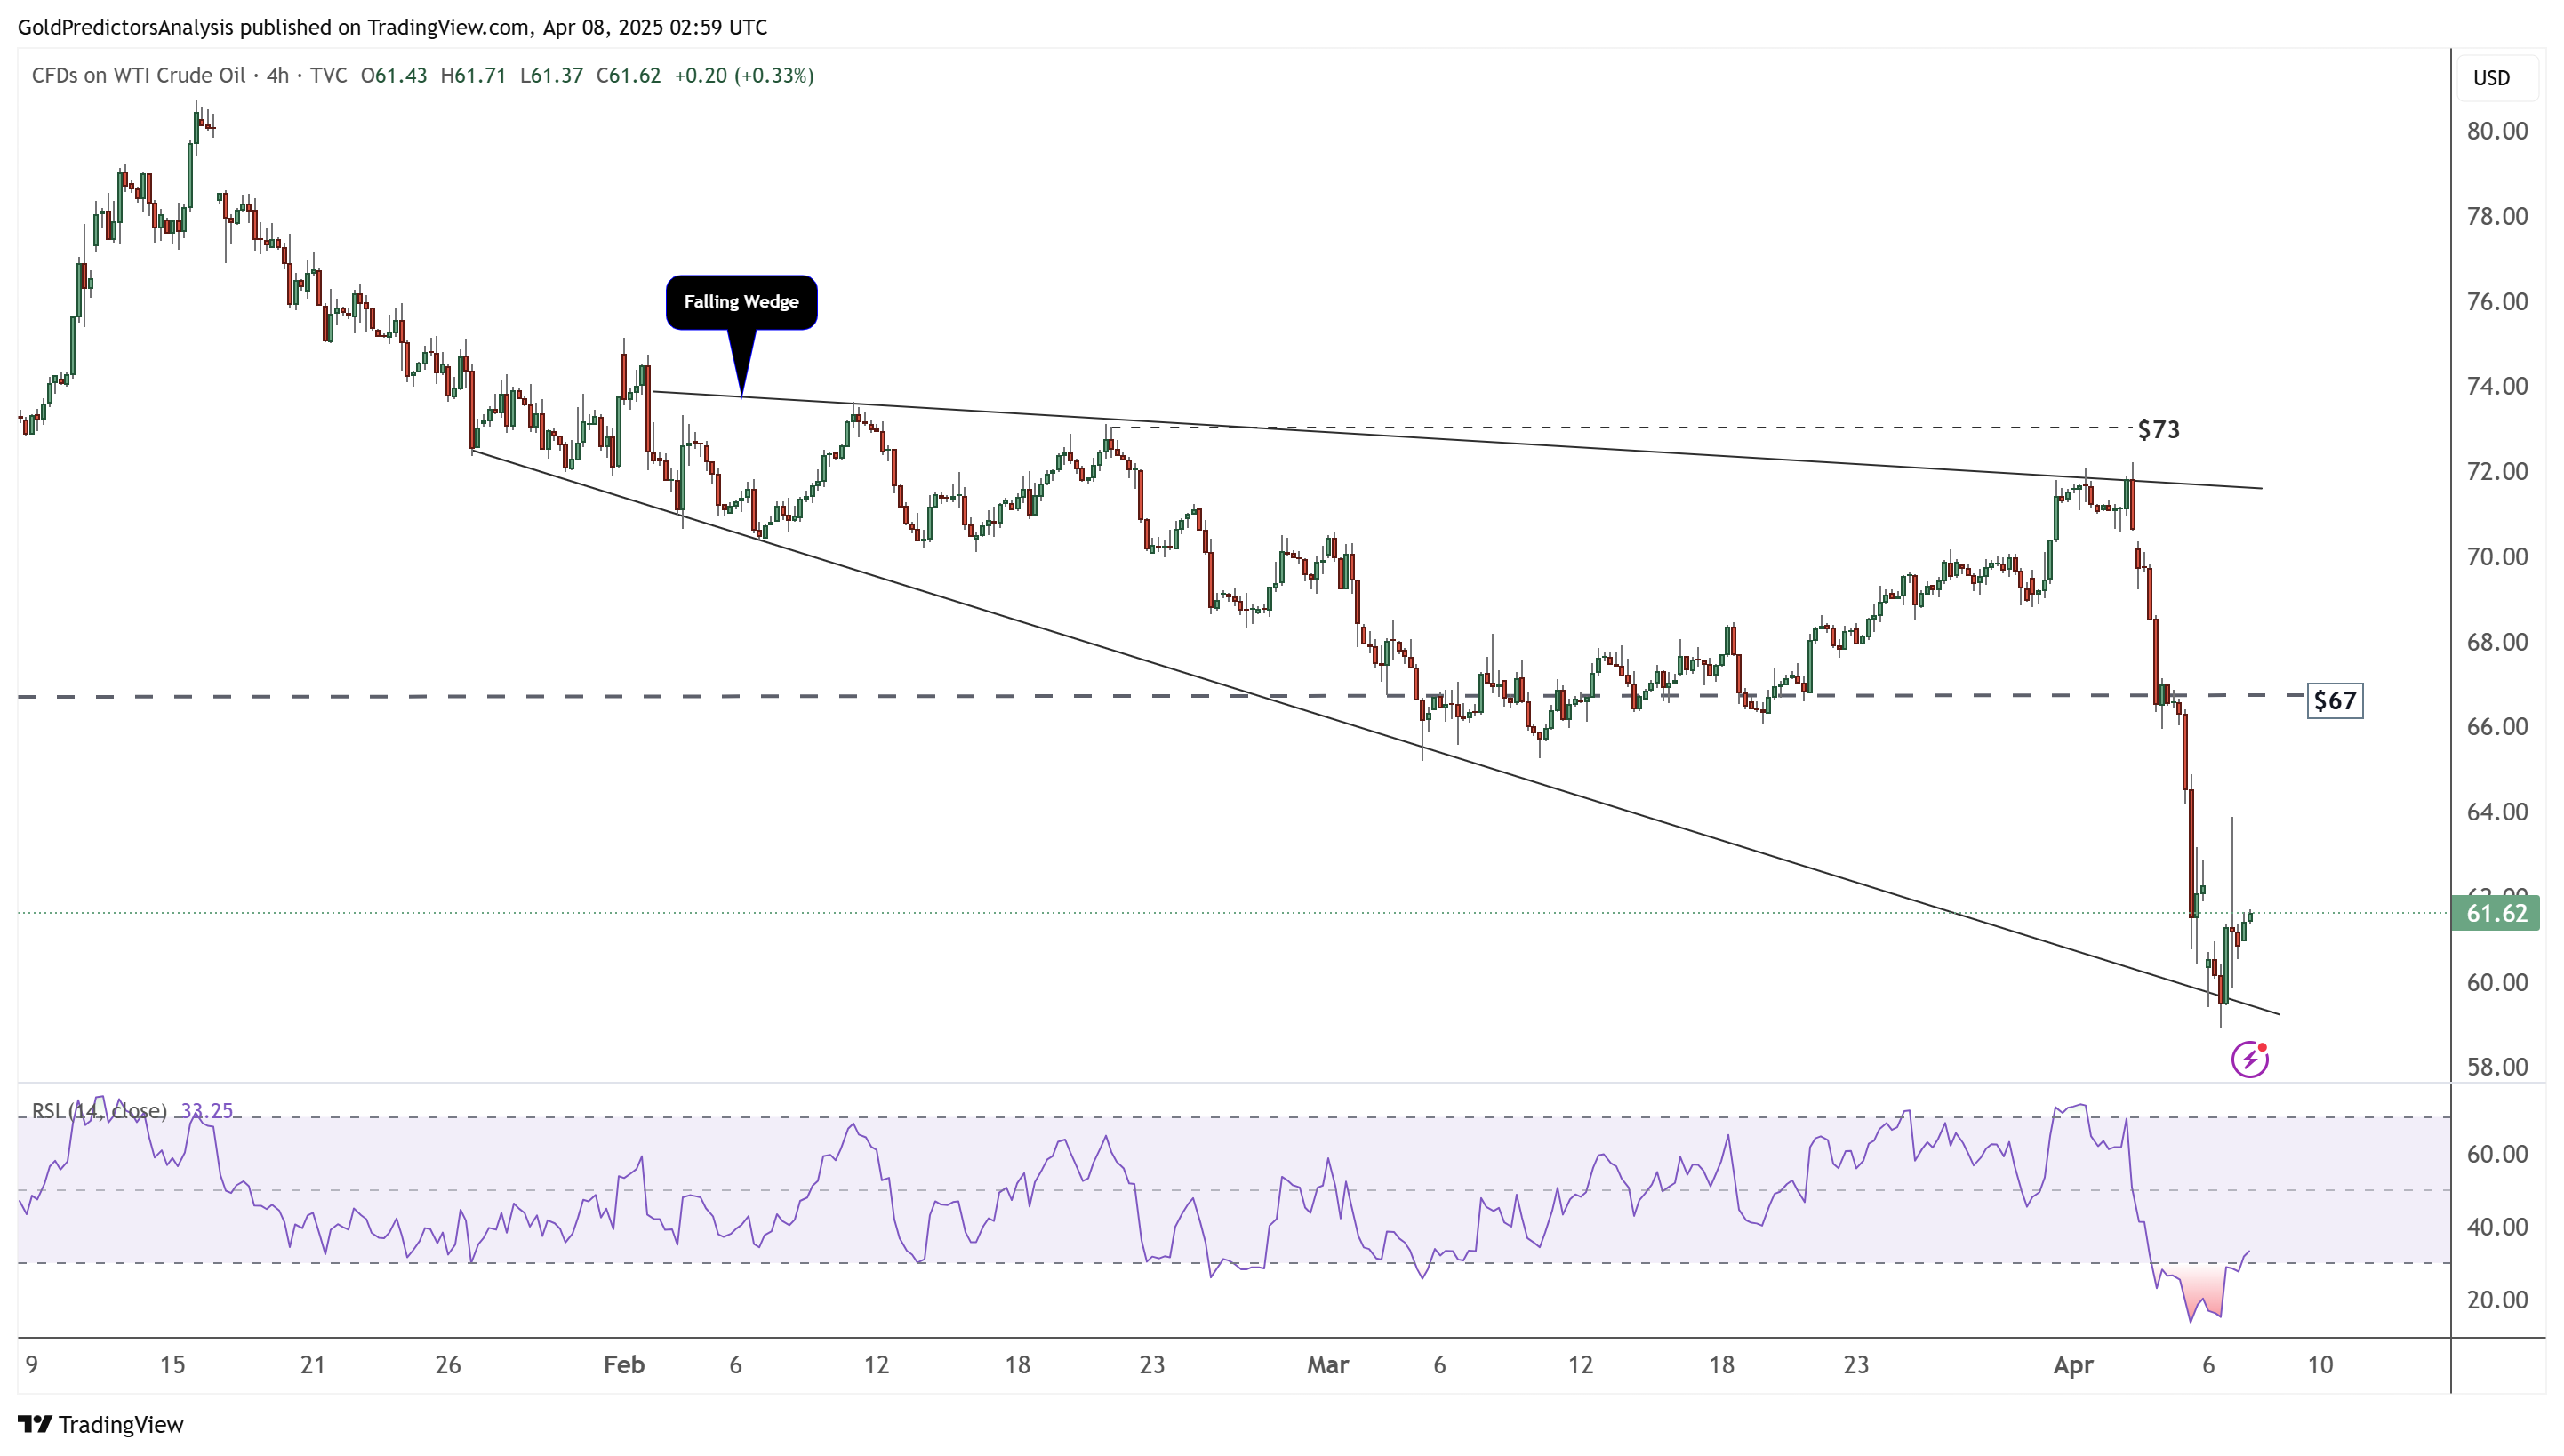
See all Brent Oil forecastsOil 4-Hour Chart – Oversold Levels
The 4-hour chart for WTI crude oil shows the formation of a falling wedge pattern, with prices reaching the lower boundary of the pattern at $59. The market became highly oversold at this support zone, indicating a potential short-term rebound. The RSI also confirms this oversold condition in the chart below.
Natural Gas (NG) Technical Analysis
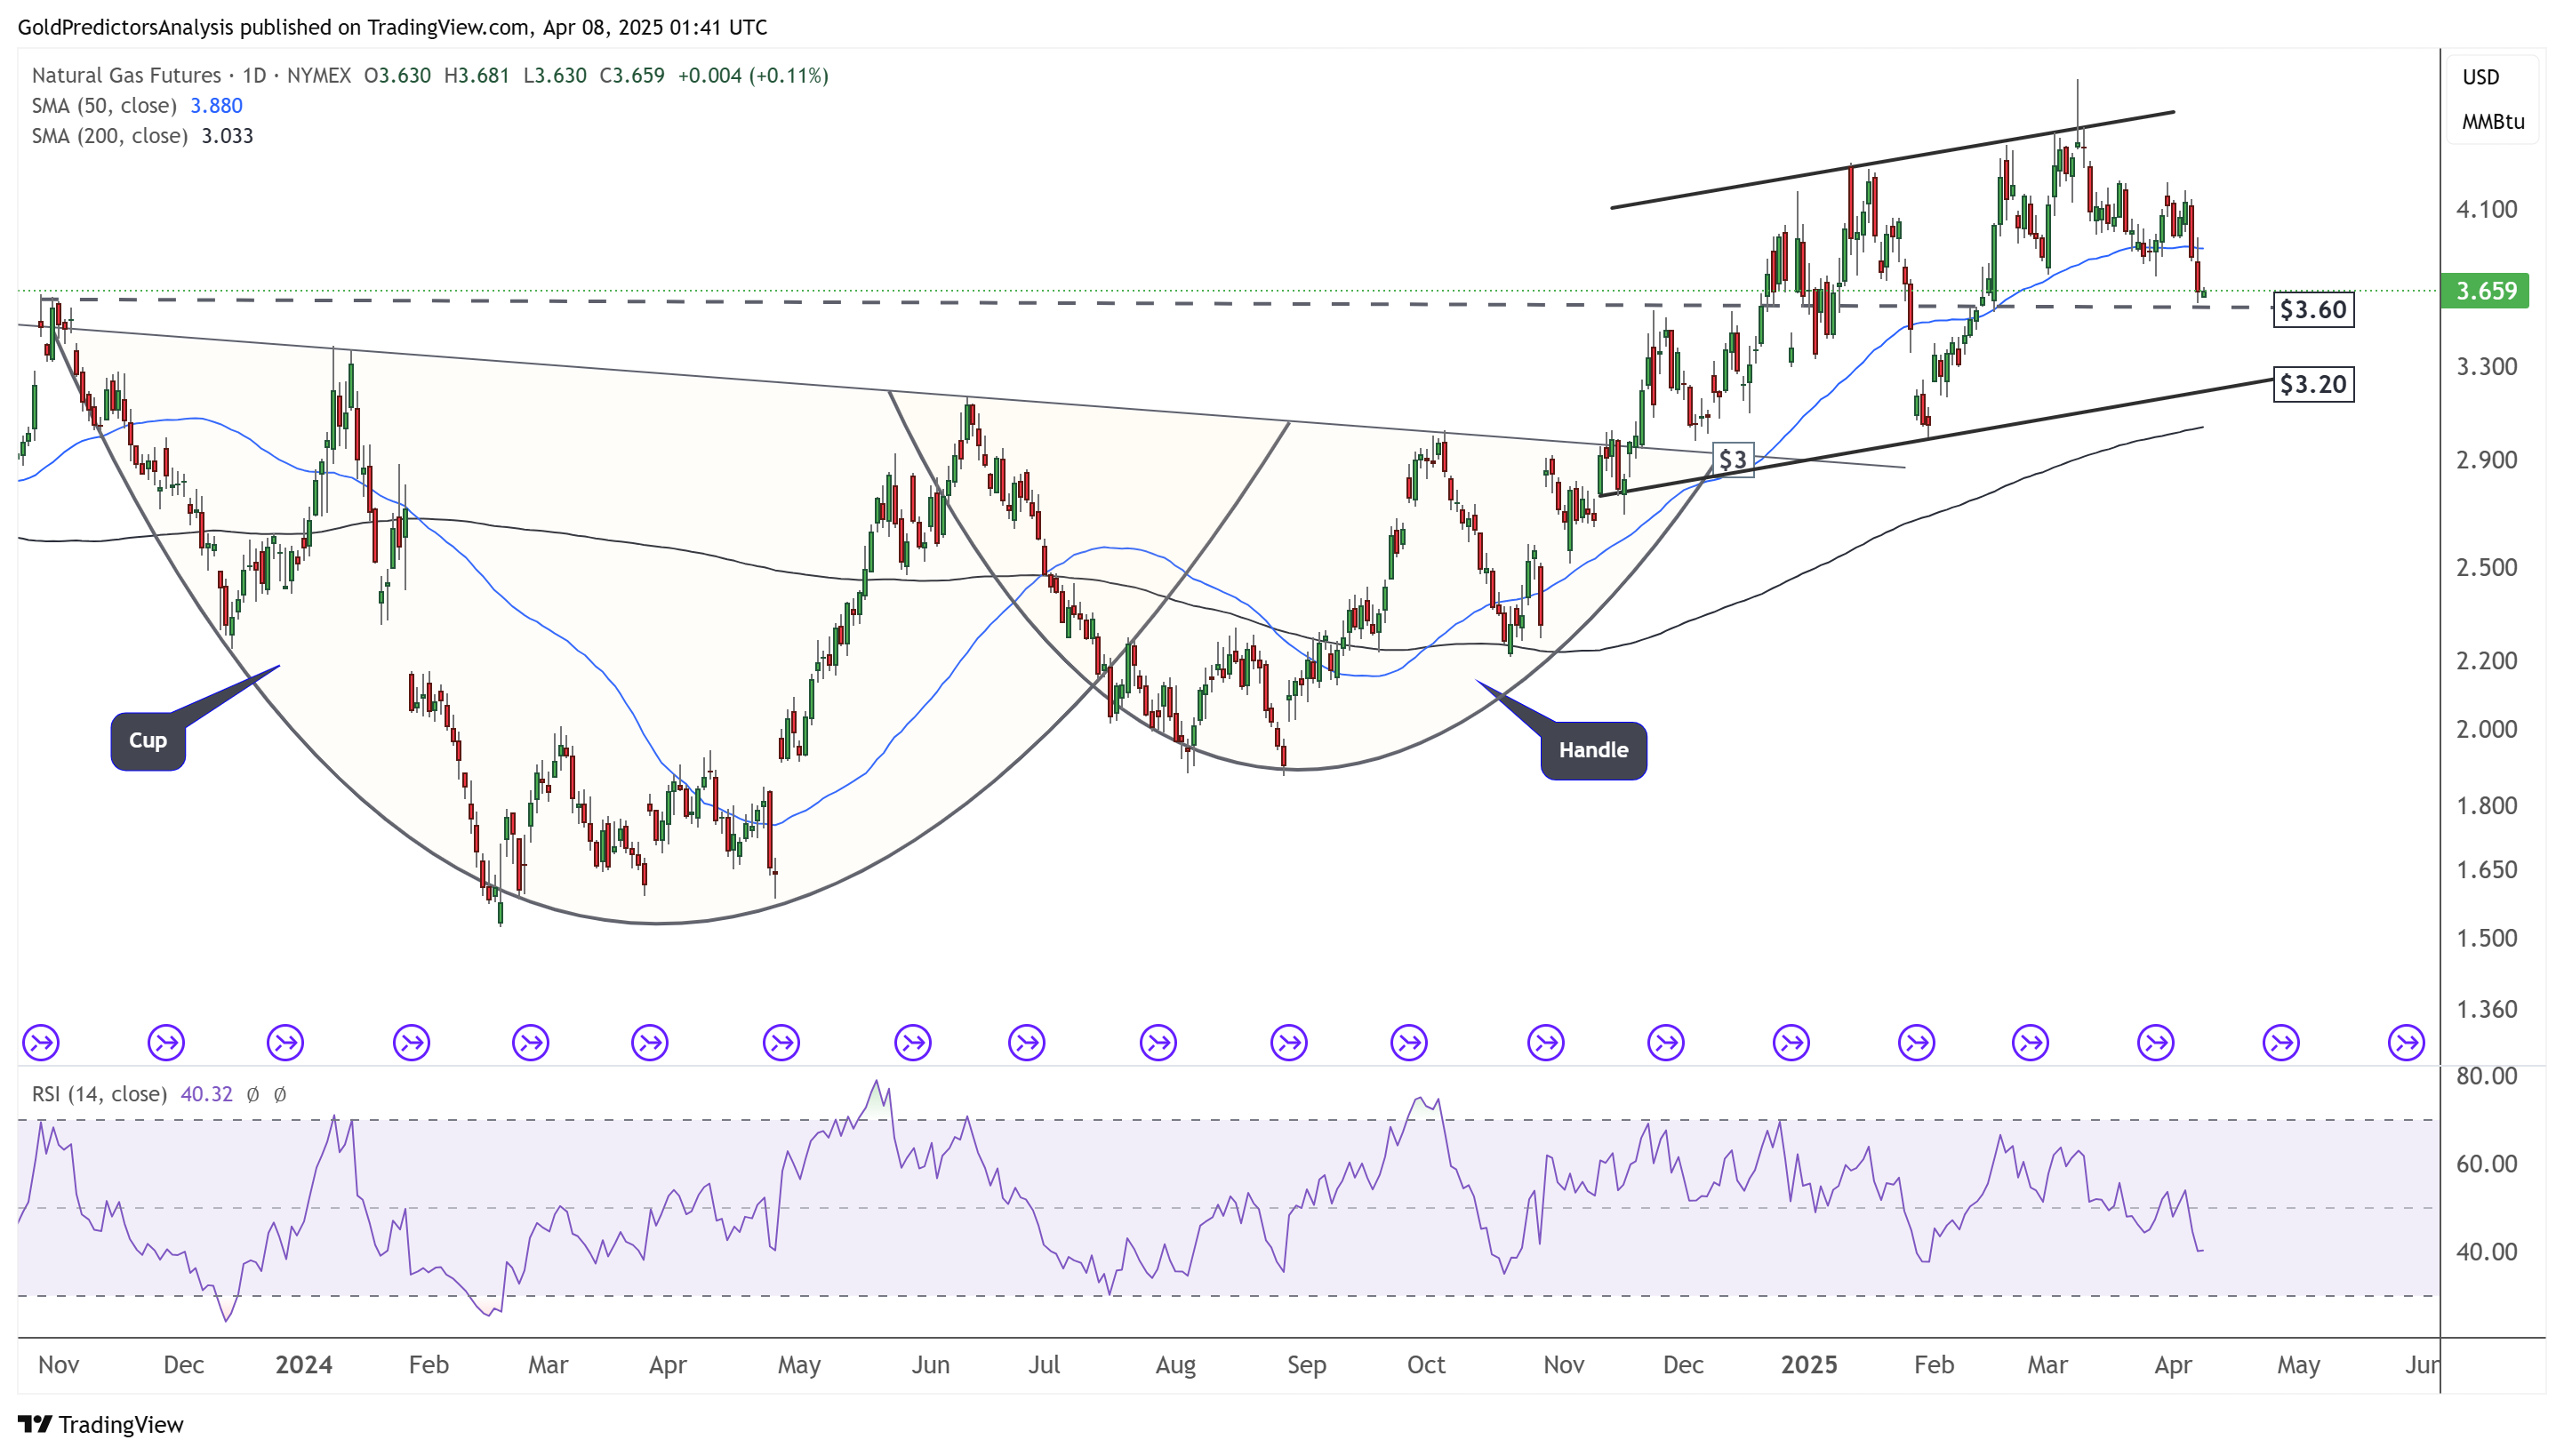
Natural Gas Daily Chart – Cup and Handle Formation
The daily chart for natural gas shows that the price is trading within an ascending channel after breaking out of a cup and handle pattern. This formation indicates that the overall trend remains positive. However, the price currently trades within the support band of $3.00 to $3.60, suggesting a potential rebound.
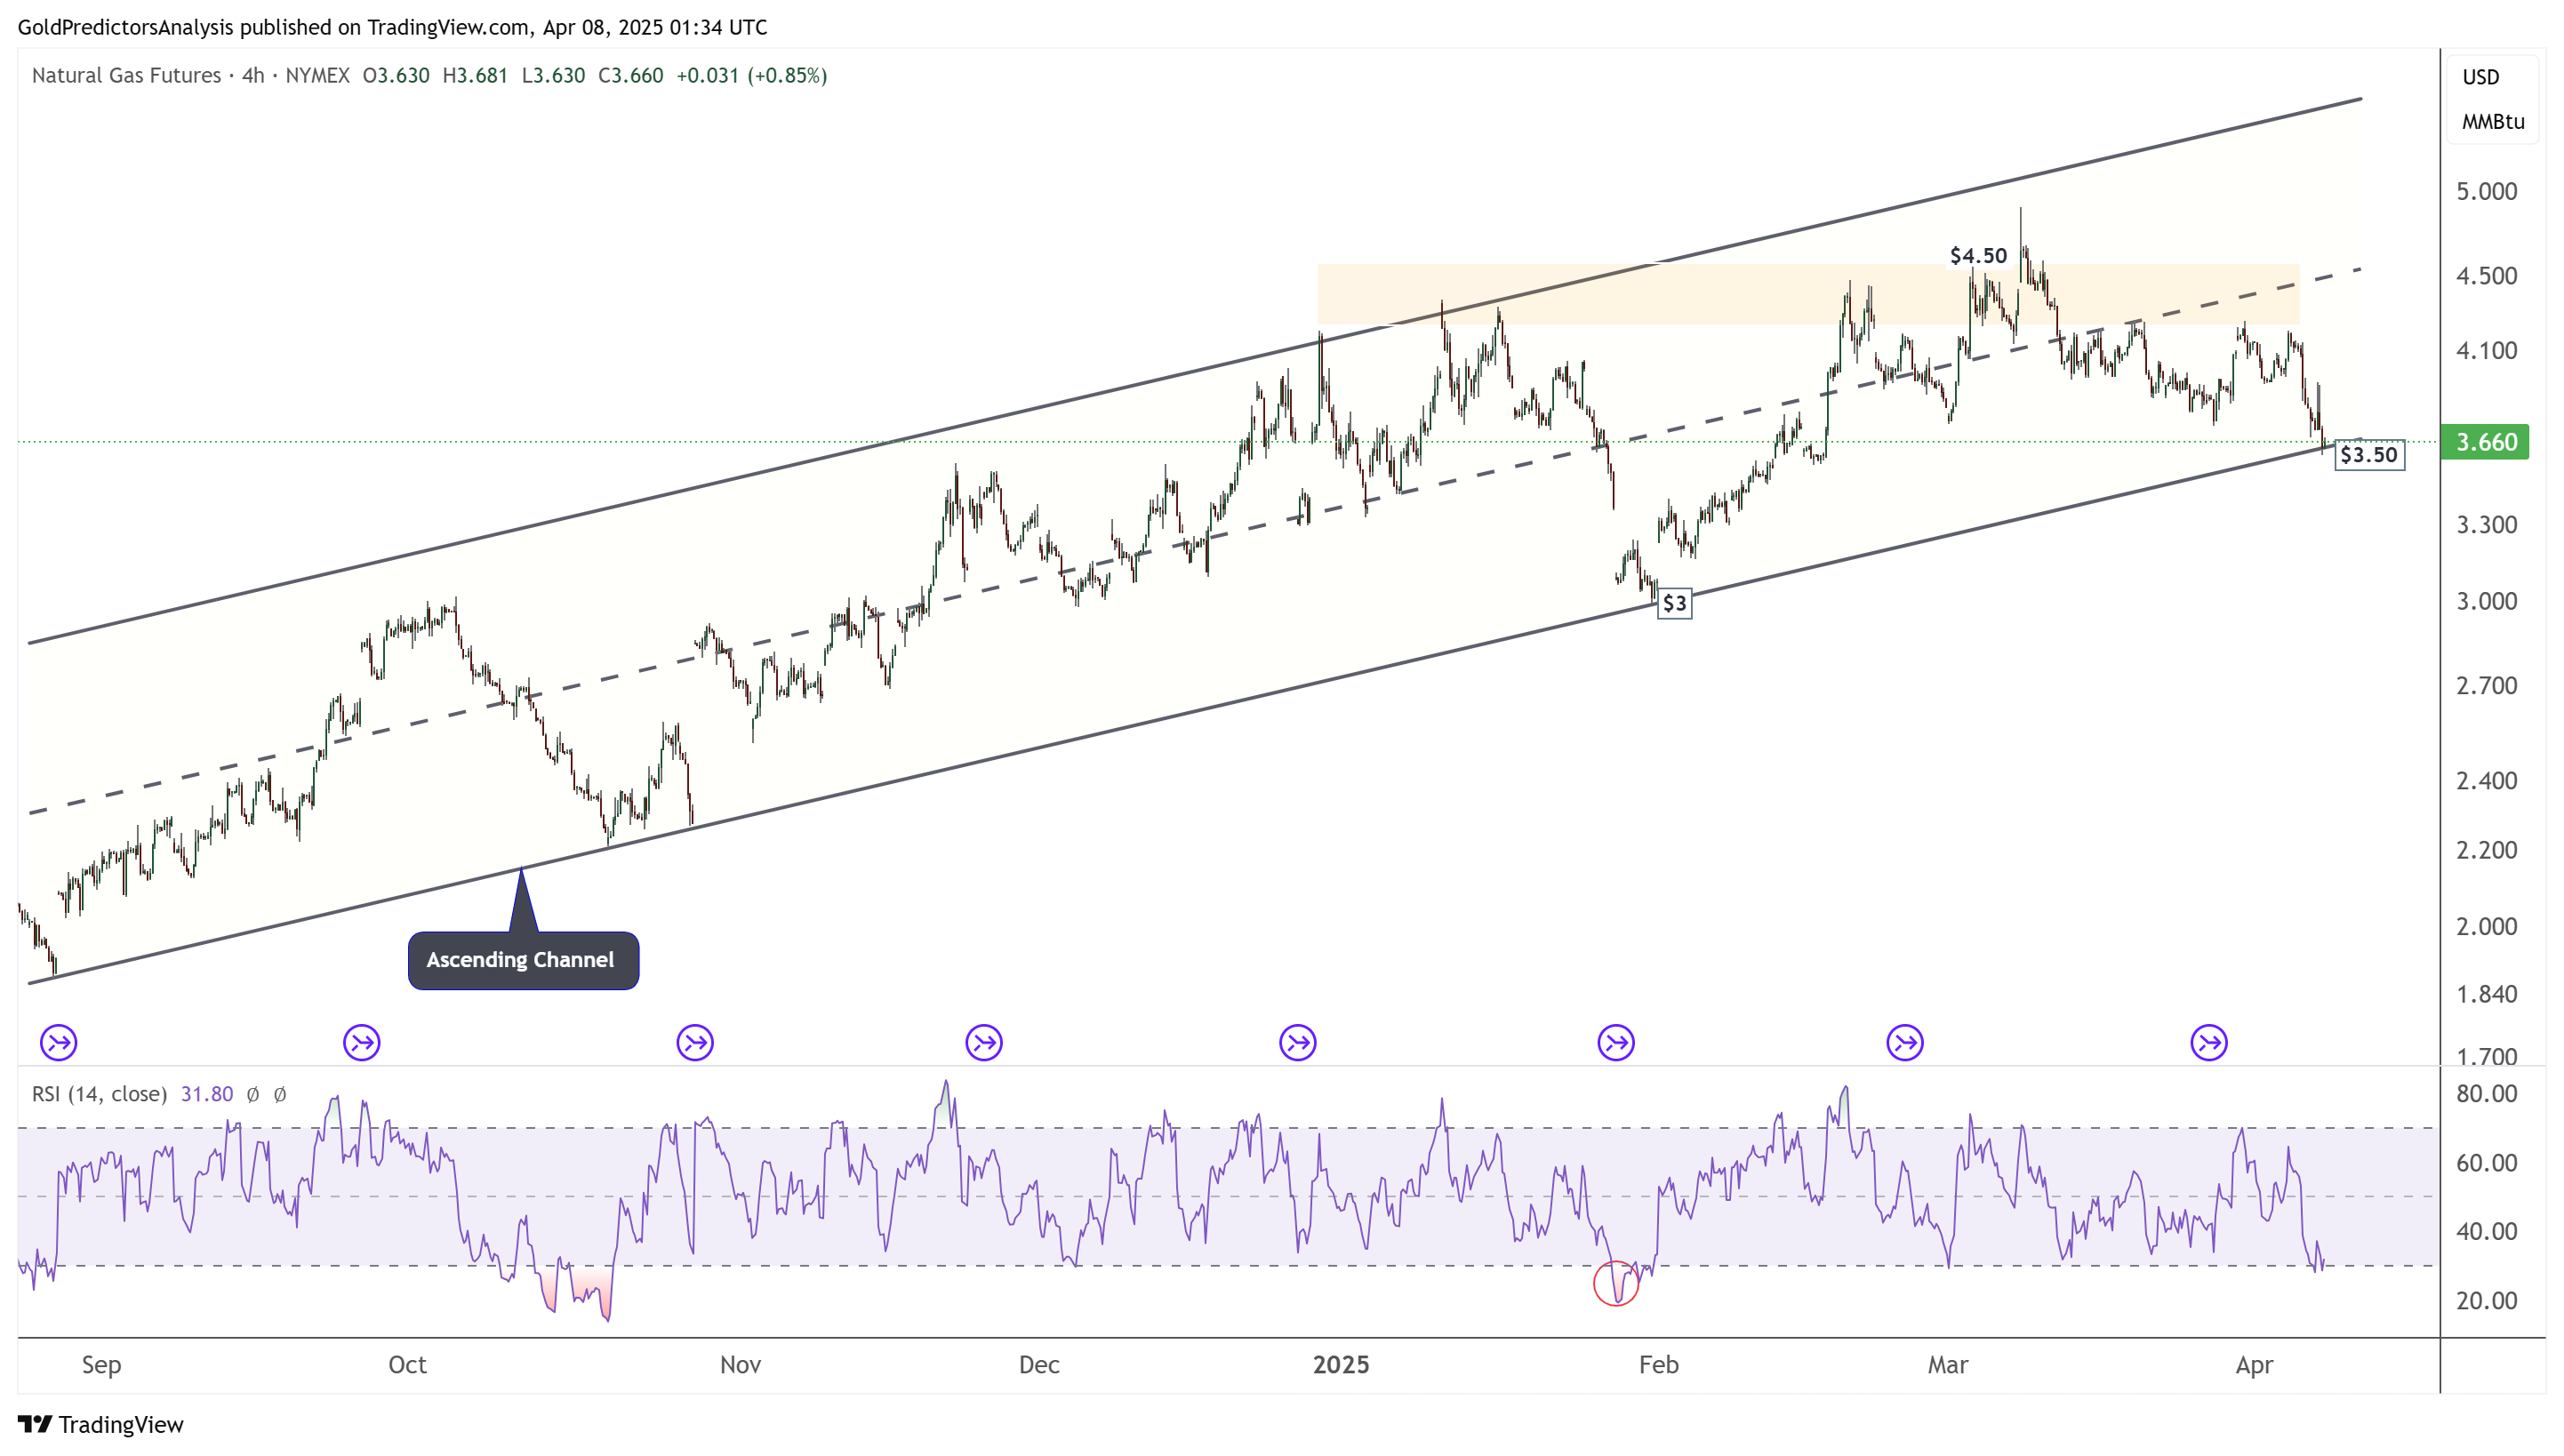
Natural Gas 4-Hour Chart – Ascending Channel
The 4-hour natural gas chart shows that the price is trading within an ascending channel, with support currently being tested at $3.60. A break below this level could push prices to $3.00, where a strong rally will likely begin.
US Dollar Technical Analysis
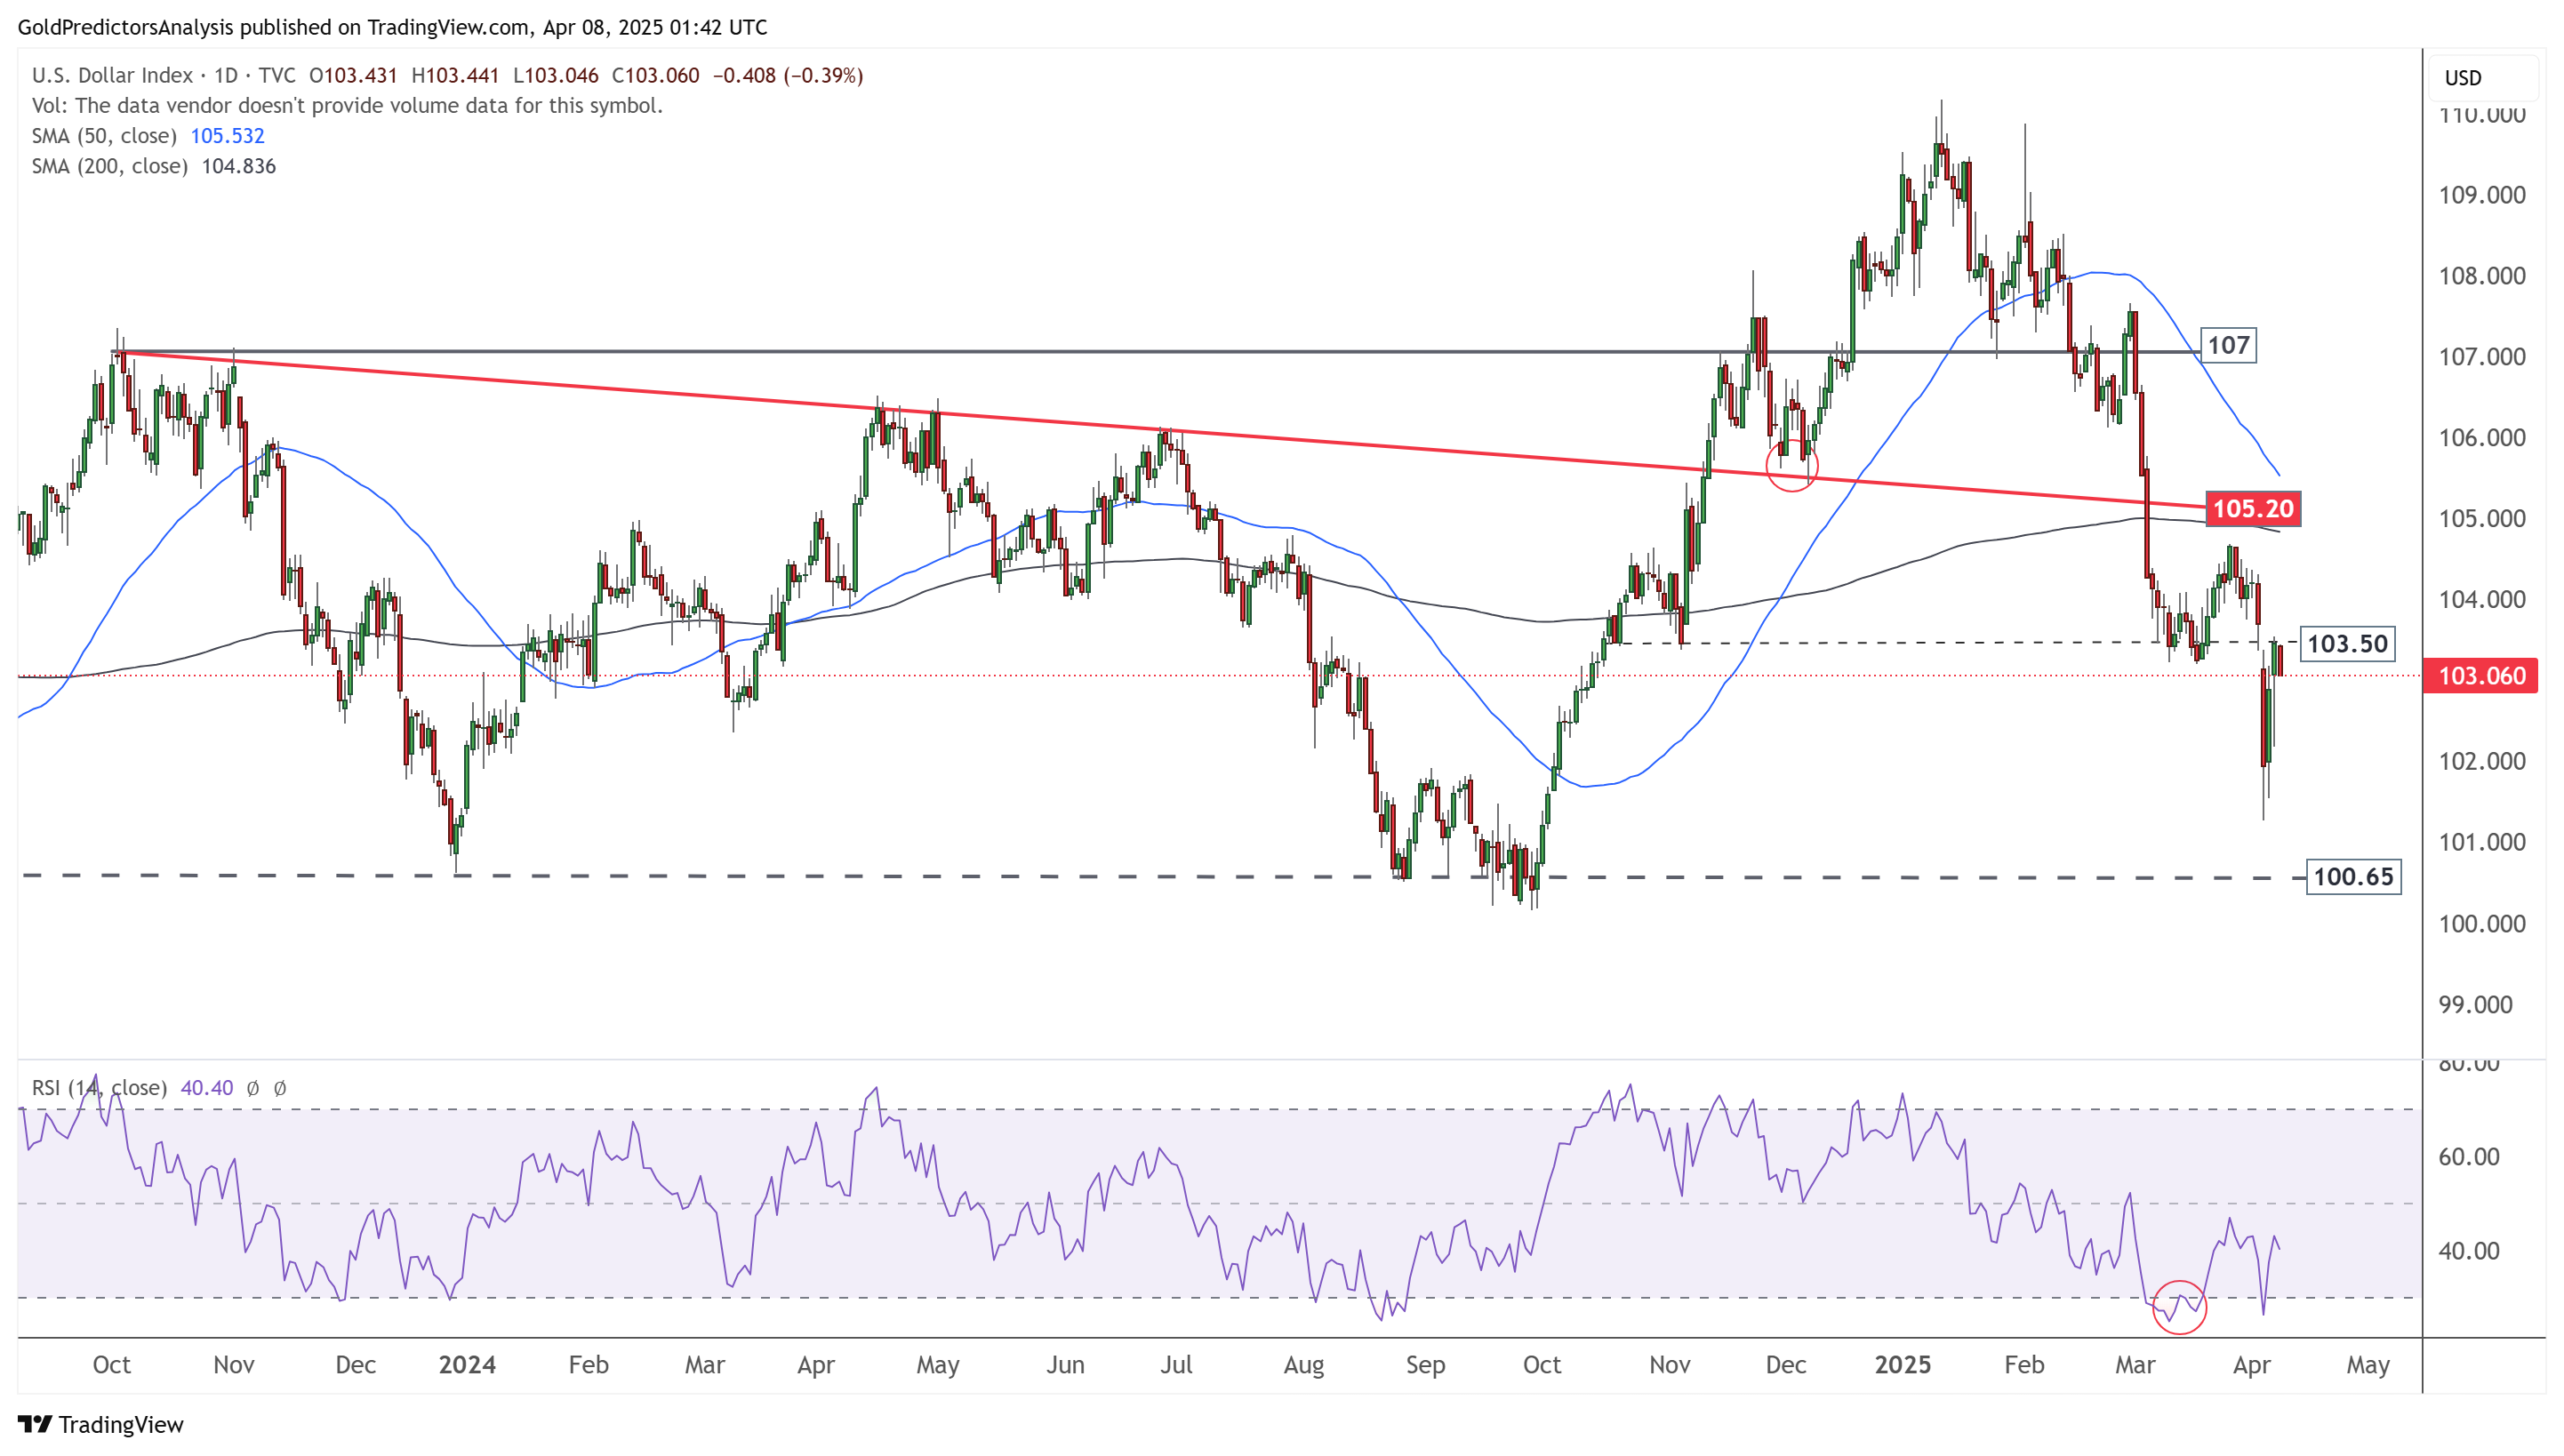
US Dollar Daily – Tests Resistance at 103.50
The daily chart for the US Dollar Index shows strong volatility within the 100.65 to 103.50 range. The index recently hit resistance at 103.50 and is now declining. The index will likely continue decreasing as long as it remains below 107.
US Dollar 4-Hour Chart – Descending Channel
The 4-hour chart for the US Dollar Index shows that it remains within a descending channel. The current rebound from the channel’s lower boundary pushes the index toward the daily resistance at 103.50. A break above this level may take the index back to 104.70, which remains the next resistance within the channel.