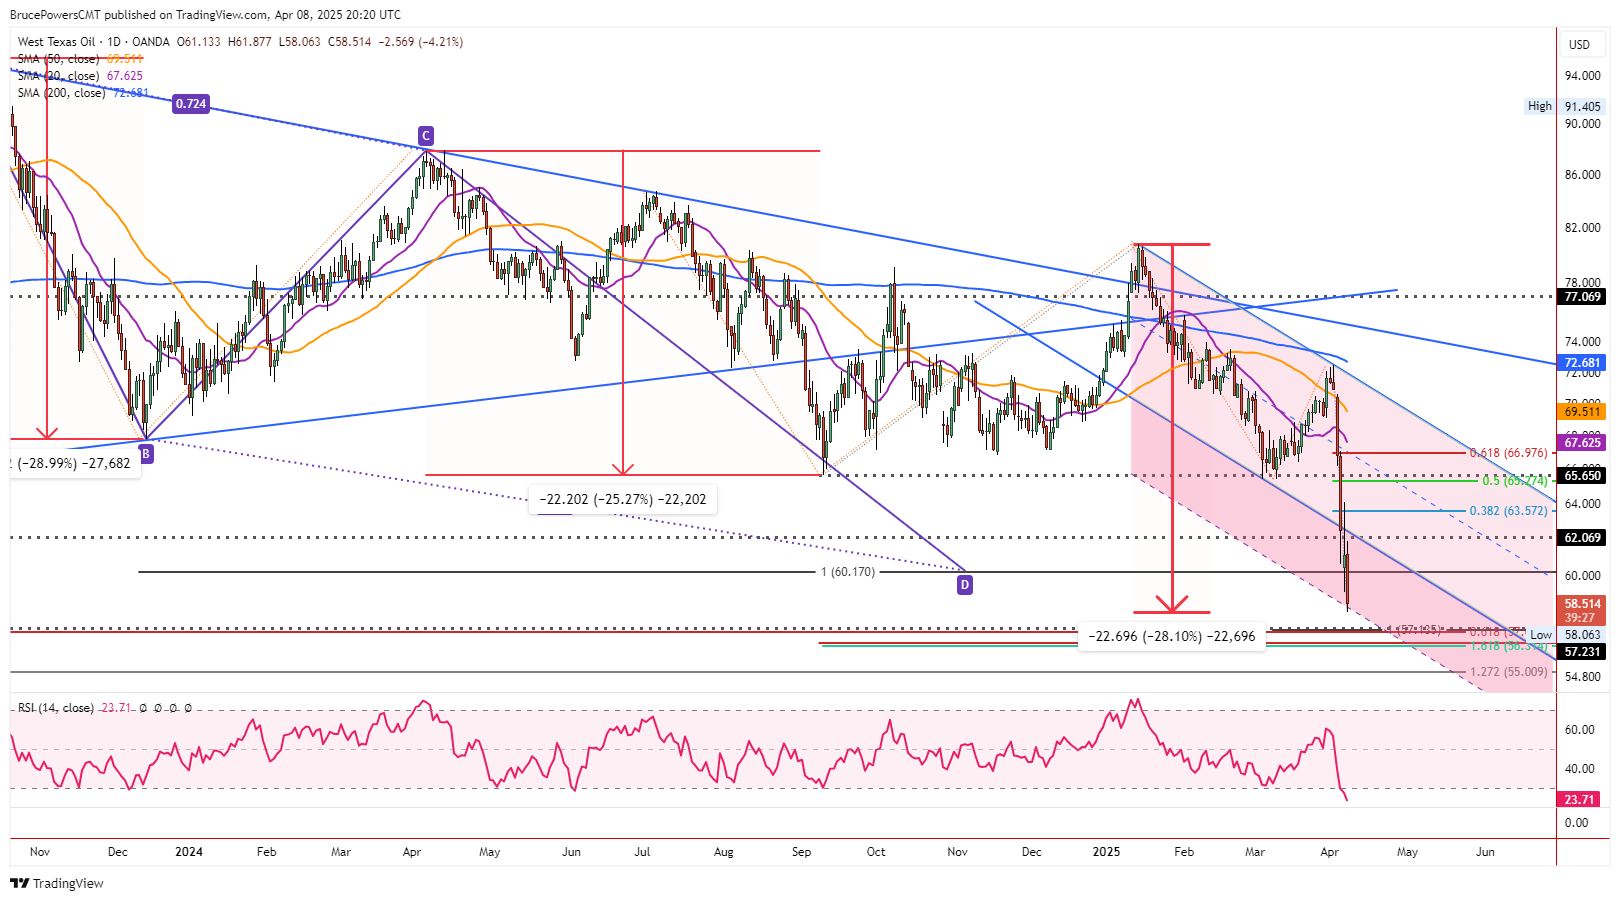
Crude oil triggered a continuation of its bearish correction on Tuesday, falling to a new 48-month low of $58.06, at the time of this writing. Trading continues near the lows of the day and will likely end in a bearish position, near the lows of the day. The high for the day was $61.88. Notice that crude is now testing support around the lower line of a declining trend channel.
That line is the 50% extension of the original channel bordered by blue trendlines. It may represent support but is too early to say. Furthermore, there are similarities between the current full decline from the January high at $80.76, and previous larger downswings when measured on a percentage basis.

Measured Moves Matched
As shown on the chart, there have been two previous large downswings since the 2023 peak of $95.50. The first (A) found a bottom after a 29% price correction and the second ended after a 25.3% decline. As of this week’s low, the current bearish correction has crude oil down by 28%. Once there is symmetry between the swings, there is a chance for signs of support and the completion of the correction. It is another piece of technical evidence identifying a potential short-term low in crude oil.
Reaching Oversold Conditions
The relative strength index (RSI) has fallen to oversold levels and the test of support near the lower end of the trend channel is also a sign that the price of crude may be oversold. Nonetheless, selling pressure remains as the closing price today will be a new low for the bearish correction.
Upside Potential?
I decisive advance above Tuesday’s high of $61.88 would be needed for signs of strength that may continue. Once the lower blue channel line is exceeded to the upside the 38.2% Fibonacci retracement at $63.57 becomes a target. Also, Monday’s high at $64.05 is close by. If strength can be maintained above that level, the next higher target zone is around previous price support and the 50% retracement level at $65.41 to $65.27, respectively.
Since that price zone may have greater significance given the previous long-term support level (now resistance), it looks like there is a good chance it is reached if there is a bullish reversal before new lows. Then, after the 50% level, the 61.8% Fibonacci retracement at $67.37 and the 20-Day MA, now at $67.69, become the next upside target.
WTI Crude Oil Price Forecast
Every new WTI Crude Oil analysis as it publishes, today's technical signal and key levels, live price — on one page.
See all WTI Crude Oil forecastsBearish Continuation would Target $57.21
On the downside, the next lower price zone identified for potential support is from $57.21 to $56.37. Crude is well on its way to reaching the price zone and therefore it may do so, and it may be soon.
For a look at all of today’s economic events, check out our economic calendar.