
ETH Price Analysis
The 4-hour ETH chart shows a strong uptrend after completing a higher degree wave 4 correction near $2,350 in August. A breakout from the symmetrical triangle led to a rally toward $4,075 on Dec. 6. However, an ascending pattern has emerged, signaling the weakening momentum and a potential pullback or trend reversal in the near term.
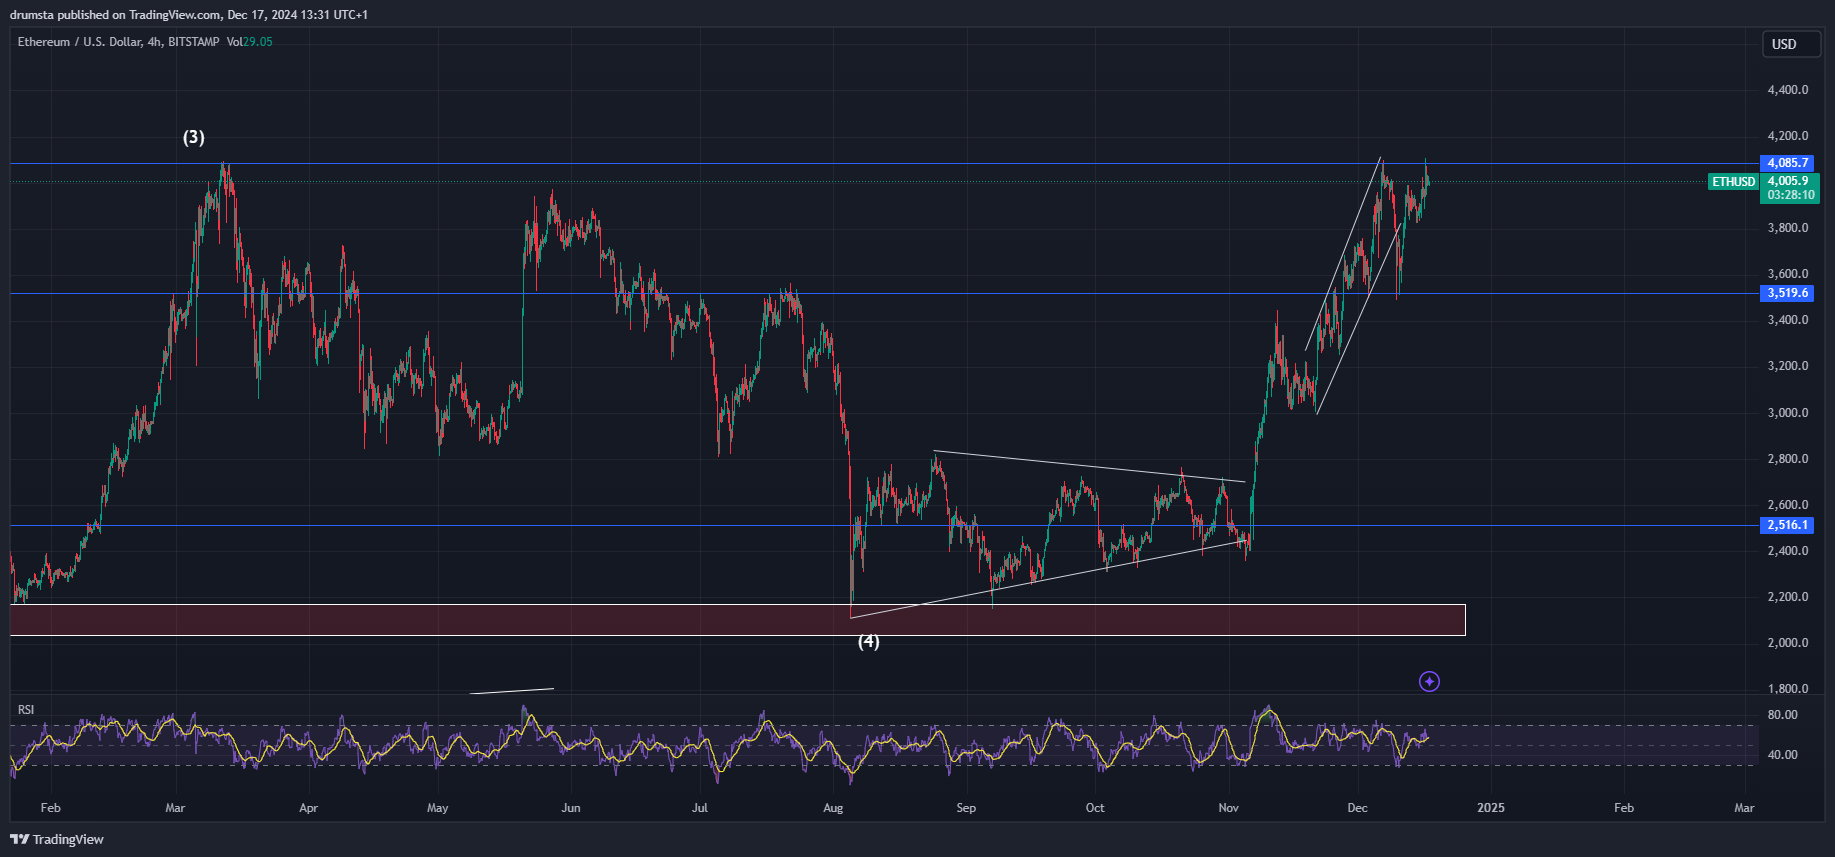
After a 16% sharp decline, ETH rose back up and retested its yearly high on Dec. 16 but encountered resistance again. If it fails to hold above $4,000 that could imply it didn’t have the strength to proceed past this resistance and is now set for another downturn.
The Relative Strength Index (RSI) remains elevated in overbought territory, indicating waning momentum and a higher likelihood of corrective pressure.

ETH Price Prediction
The ETH 1-hour chart indicates a completed 5-wave Elliott structure until Dec. 6, with the price peaking at $4,075. An ABC correction appears underway, with the price retracing from its yesterday’s resistance interaction.
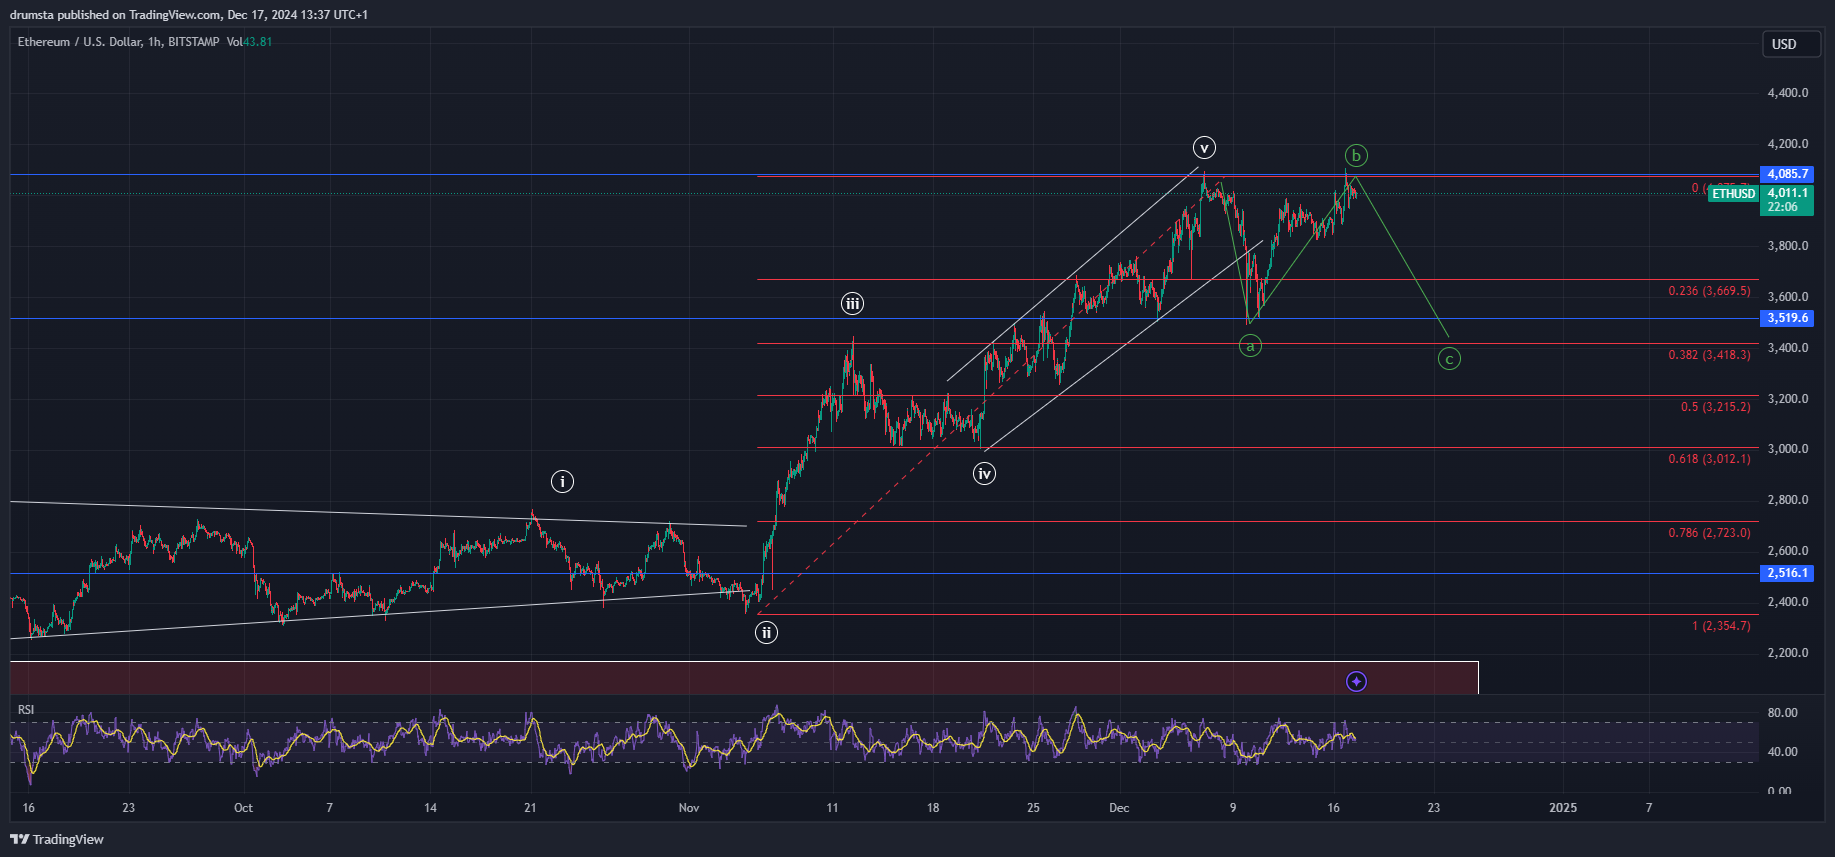
If ETH breaks below $3,669, further declines toward $3,418 (0.382 Fib) and $3,215 (0.5 Fib) are likely. The C wave of the correction could extend to $3,012 (0.618 Fib). The RSI shows a slight downtrend, reflecting weakening momentum and favoring continued downside pressure.
Alternatively, the ascending channel could be its wave 4, with its Dec. 10 low of $3,500 being the completion of this corrective stage. According to this scenario, the following rise could be its developing wave 5, meaning that it should lead to a new yearly high.
Ethereum Price Forecast
Every new Ethereum analysis as it publishes, today's technical signal and key levels, live price — on one page.
See all Ethereum forecastsFor bullish continuation, ETH must reclaim the $4,075 resistance. Failure to hold above key supports, particularly $3,418, could confirm the corrective phase and drive the price lower, targeting $3,012 or deeper levels.
Key Levels to Watch
- Resistance: $4,075 (recent high).
- Immediate Support: $3,669 (0.236 Fib retracement).
- Lower Supports: $3,418 (0.382 Fib), $3,215 (0.5 Fib), and $3,012 (0.618 Fib).
- RSI Insight: Weakening momentum favors correction toward $3,418–$3,215.
- Bullish Continuation: Breakout above $4,075 required to resume upward momentum.