
Advertisement
Advertisement

Gold Price Forecast: Gold Miners Look Bullish Despite Spiking Bond Yields

By: 
AG Thorson
Gold bullion and coins

Key Points:

  • Treasury yields are soaring, and markets could break if they keep rising at this pace.
  • Gold bottomed mid-year and is experiencing its first meaningful pullback. Spot prices need to close above $4,400 to signal an end to this correction.
  • Gold miners also bottomed out mid-year, and their charts are impressive, with many rallying more than 50% in just over a month. The current pullback may be forming a bull flag, potentially supporting a 25%+ rally into November if a breakout is confirmed.

Mounting Bond Markets Stress

The MOVE Index measures bond market stress. As of Thursday, it surged to 104 and is threatening to break out of a three-year downtrend, suggesting significant market risk ahead.

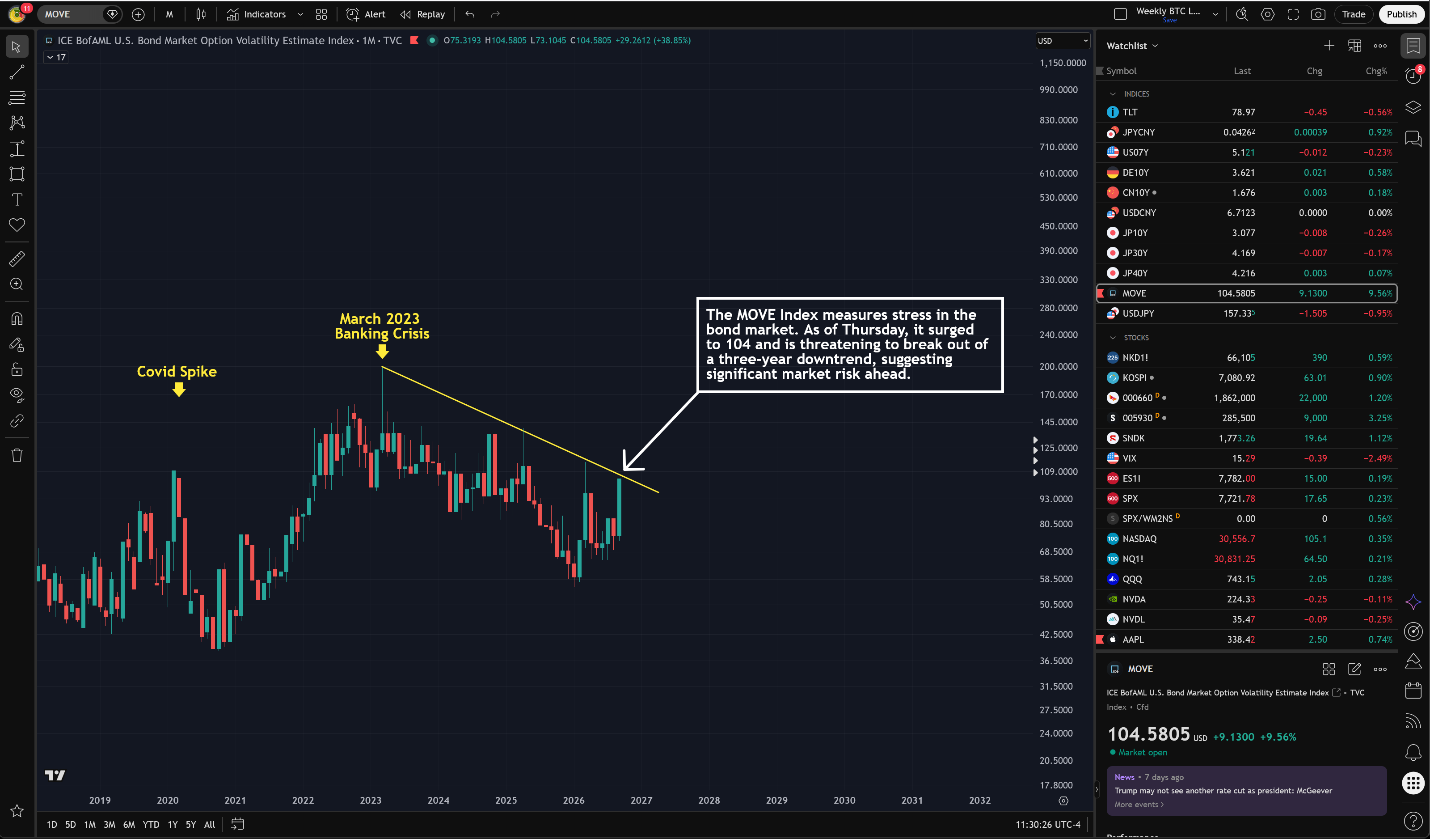
Monthly candlestick chart of the ICE BofAML MOVE Index displaying past peaks at the COVID spike and the March 2023 banking crisis, with the index testing a multi-year descending trendline at 104.58.
Monthly chart of the MOVE Index showing a recent rebound to 104.58 against a downtrend line connecting to the March 2023 peak of 200+.

10-Year Yield

The 10-year yield sliced through 5.00% and the 2023 high. If it continues rising at this pace, something is likely to break in financial markets.
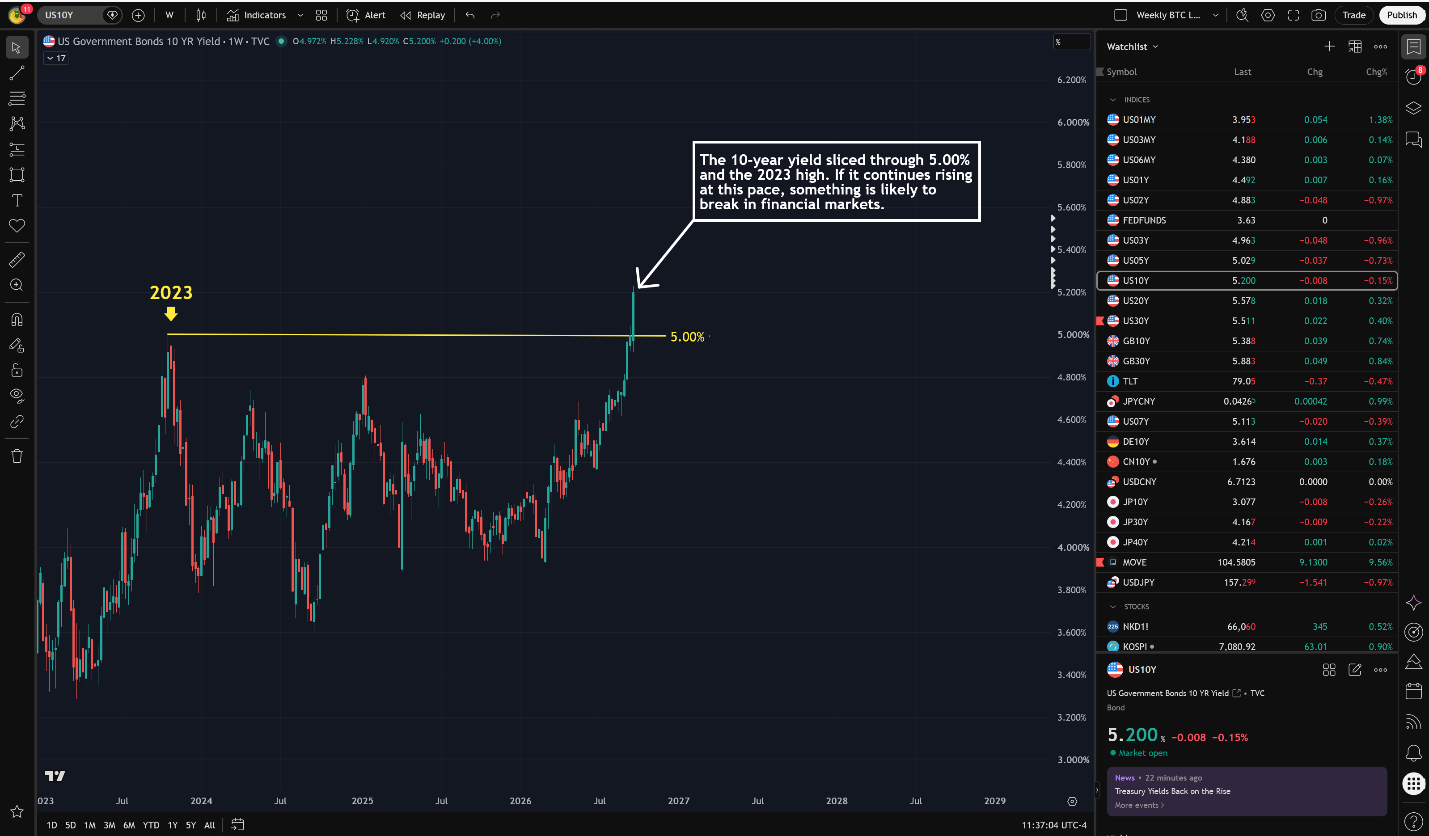
Weekly candlestick chart of the US 10-year Treasury yield showing a sharp breakout above the horizontal 5.00% level and the 2023 high, reaching 5.200%.
Weekly chart of US 10-year Treasury yields breaking past the previous 2023 peak above 5.00% to trade at 5.200%.

Gold Big Picture

A little more downside is possible, but overall, I believe we are at the halfway point of a 10-year bull run that will take gold above $10,000 by the end of the decade. In hindsight, the current pullback will likely be barely noticeable.
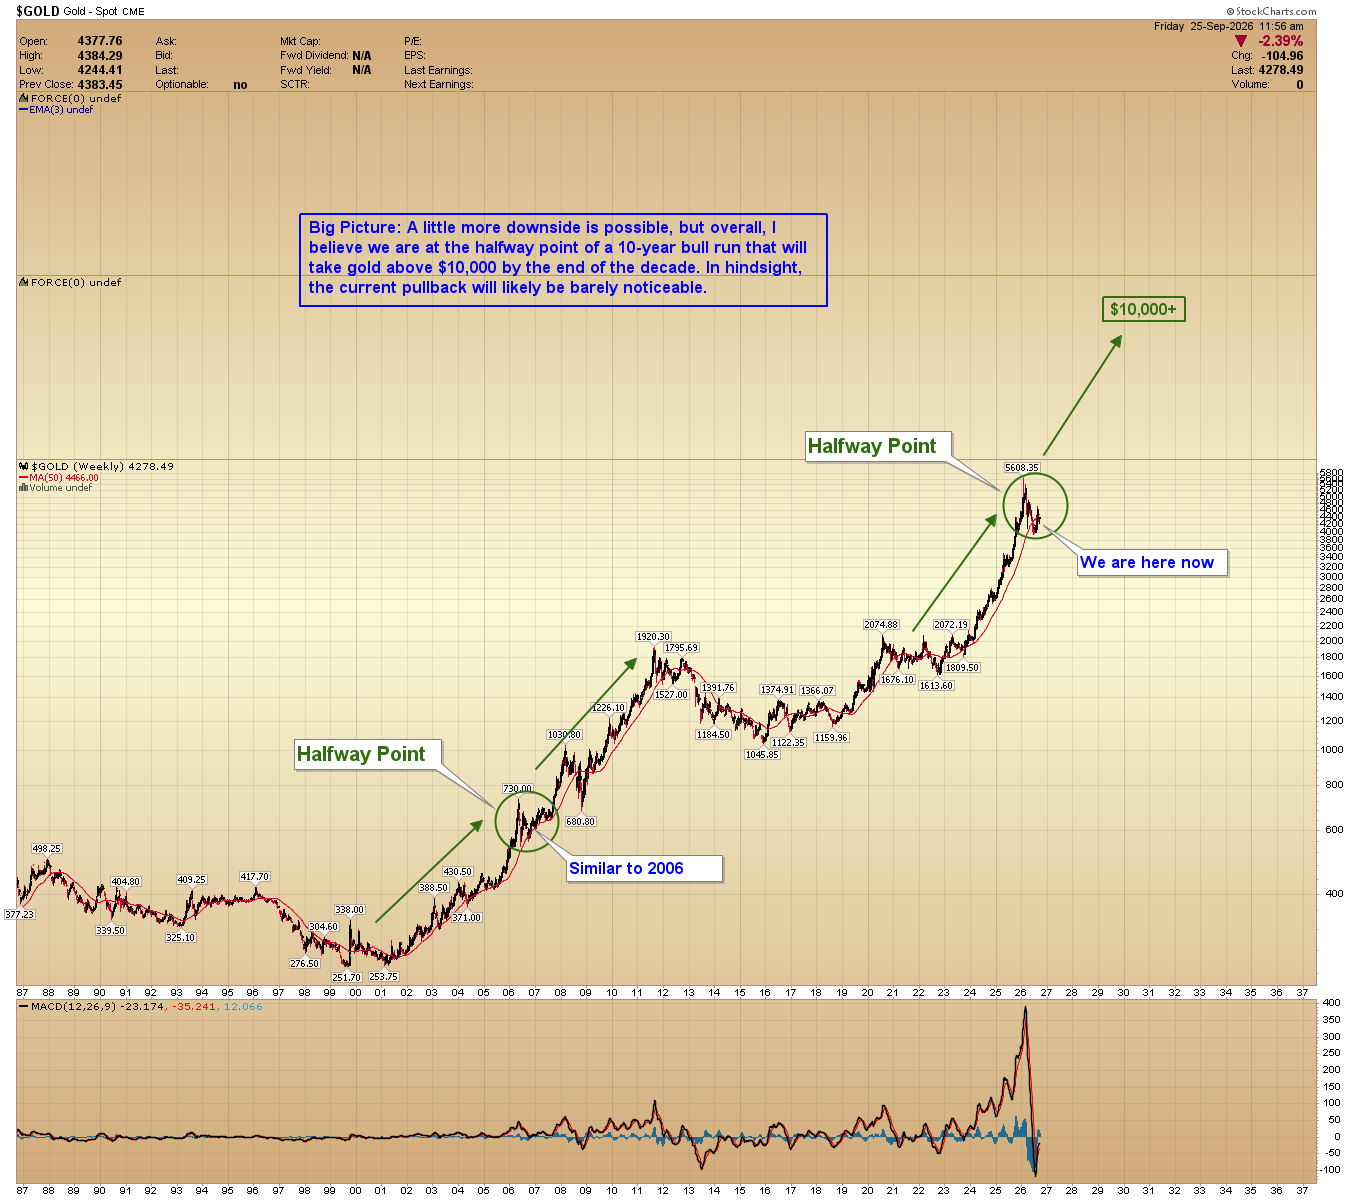
Long-term weekly chart of spot gold highlighting a pullback from a recent peak of $5,608.35 down to $4,278.49, labeled as a halfway point analogous to 2006 on a projected path toward $10,000+
Weekly chart of spot gold tracking its correction to $4,278.49 after reaching a high of $5,608.35, with annotations mapping the move against the 2006 cycle toward a $10,000+ target.

Gold

Spot gold must close above $4,400 in the coming days or weeks to confirm an end to the current pullback. A break below $4,200 would risk triggering another round of selling into October.
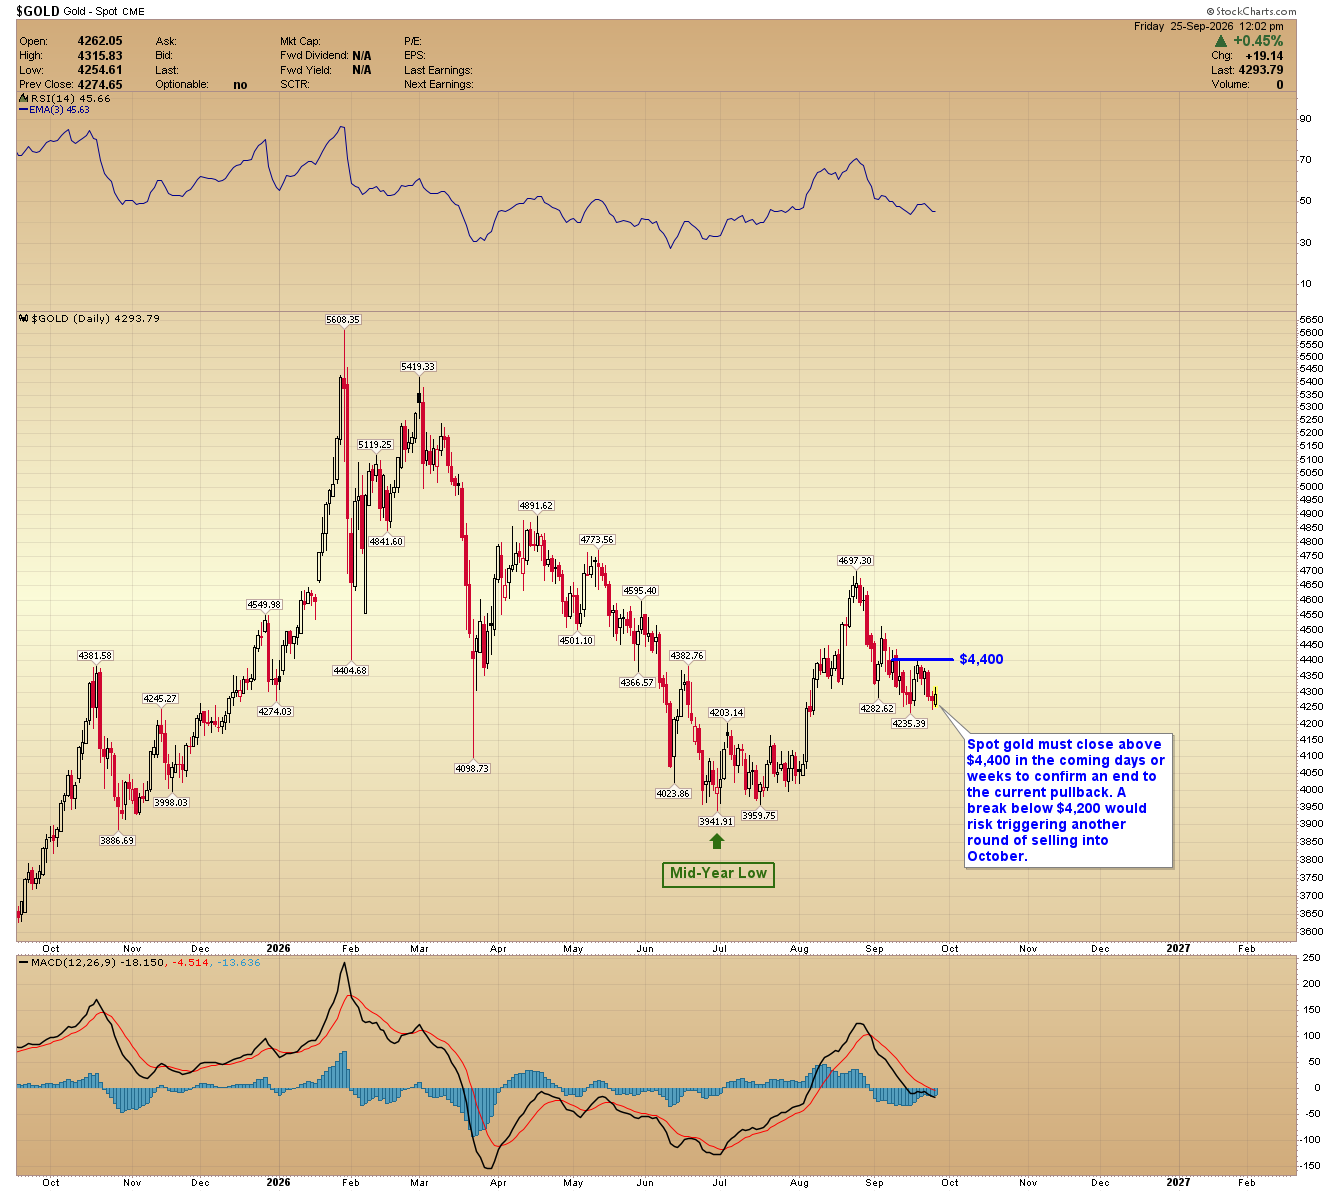
Daily candlestick chart of spot gold showing prices consolidating at $4,293.79 between the $4,400 resistance level and a $4,200 support threshold, following a peak of $5,608.35 earlier in the year.
Daily chart of spot gold tracking recent price action at $4,293.79, bounded between resistance at $4,400 and support at $4,200.

Silver

Silver needs to close above $67.50 to confirm an interim low. Progressive closes below $62.00 would open the door to further downside in October.

Gold Price Forecast

Every new Gold analysis as it publishes, today's technical signal and key levels, live price — on one page.

See all Gold forecasts
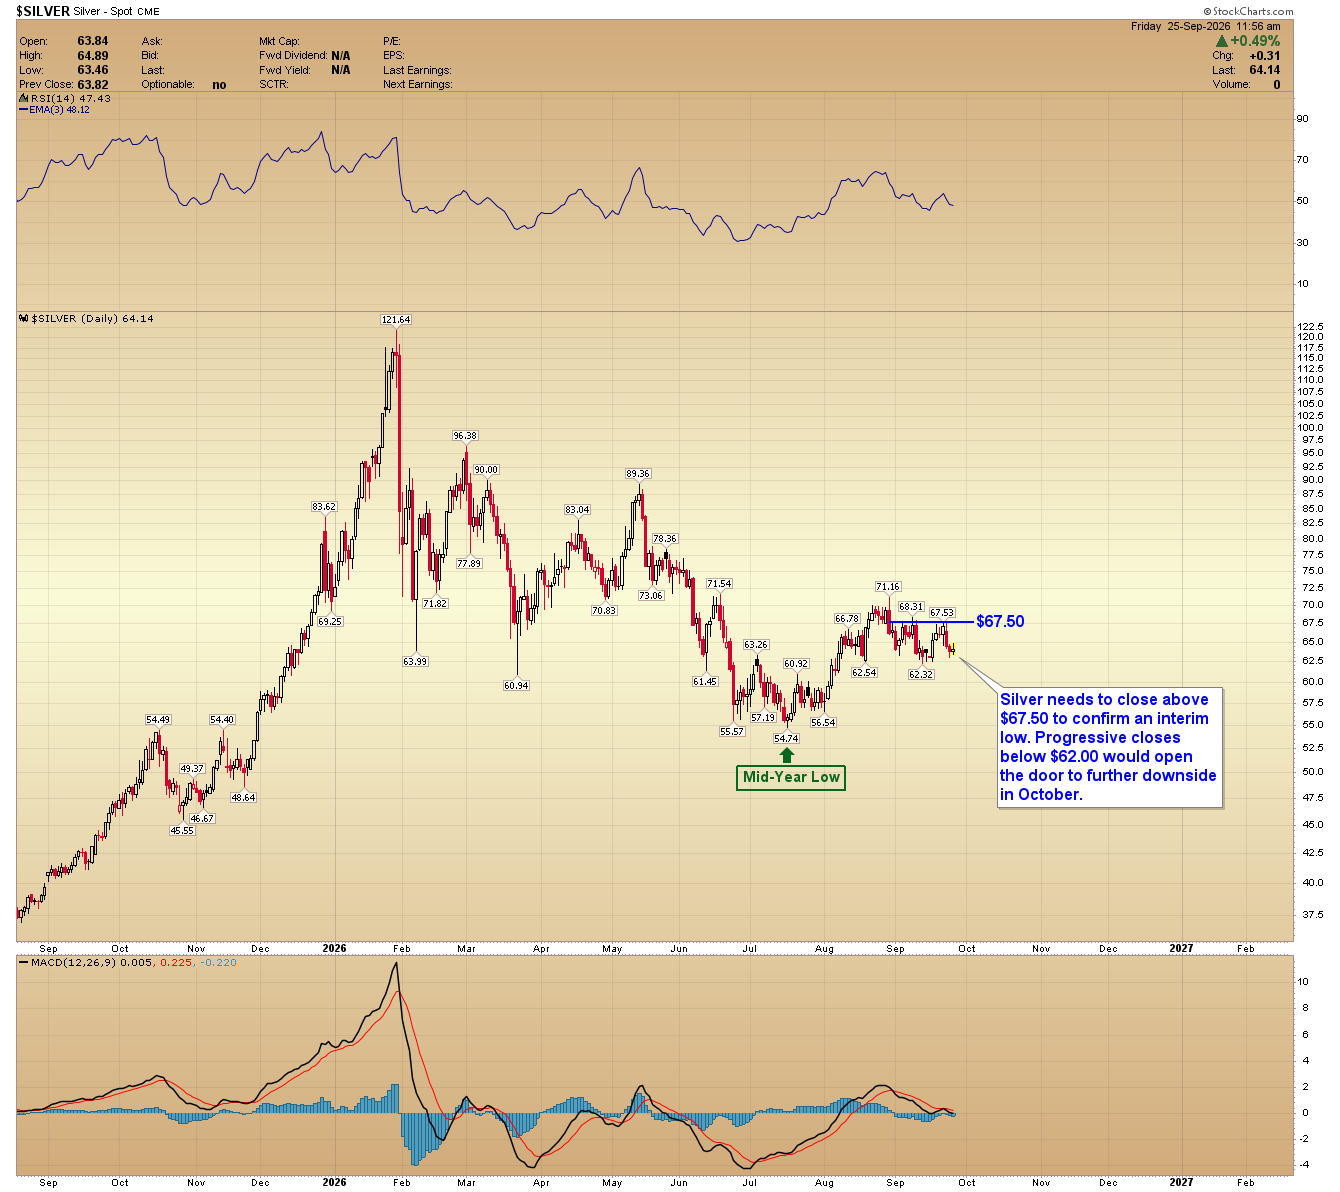
Daily candlestick chart of spot silver consolidating at $64.14 below resistance at $67.50, well off its earlier high of $121.64.
Daily chart of spot silver trading at $64.14, showing consolidation between resistance at $67.50 and support above the $54.74 mid-year low.

Platinum

Platinum needs consecutive closes above the cycle downtrend line near $1,900 to confirm a bottom. Slipping below $1,700 would signal a secondary breakdown and renewed weakness into October.
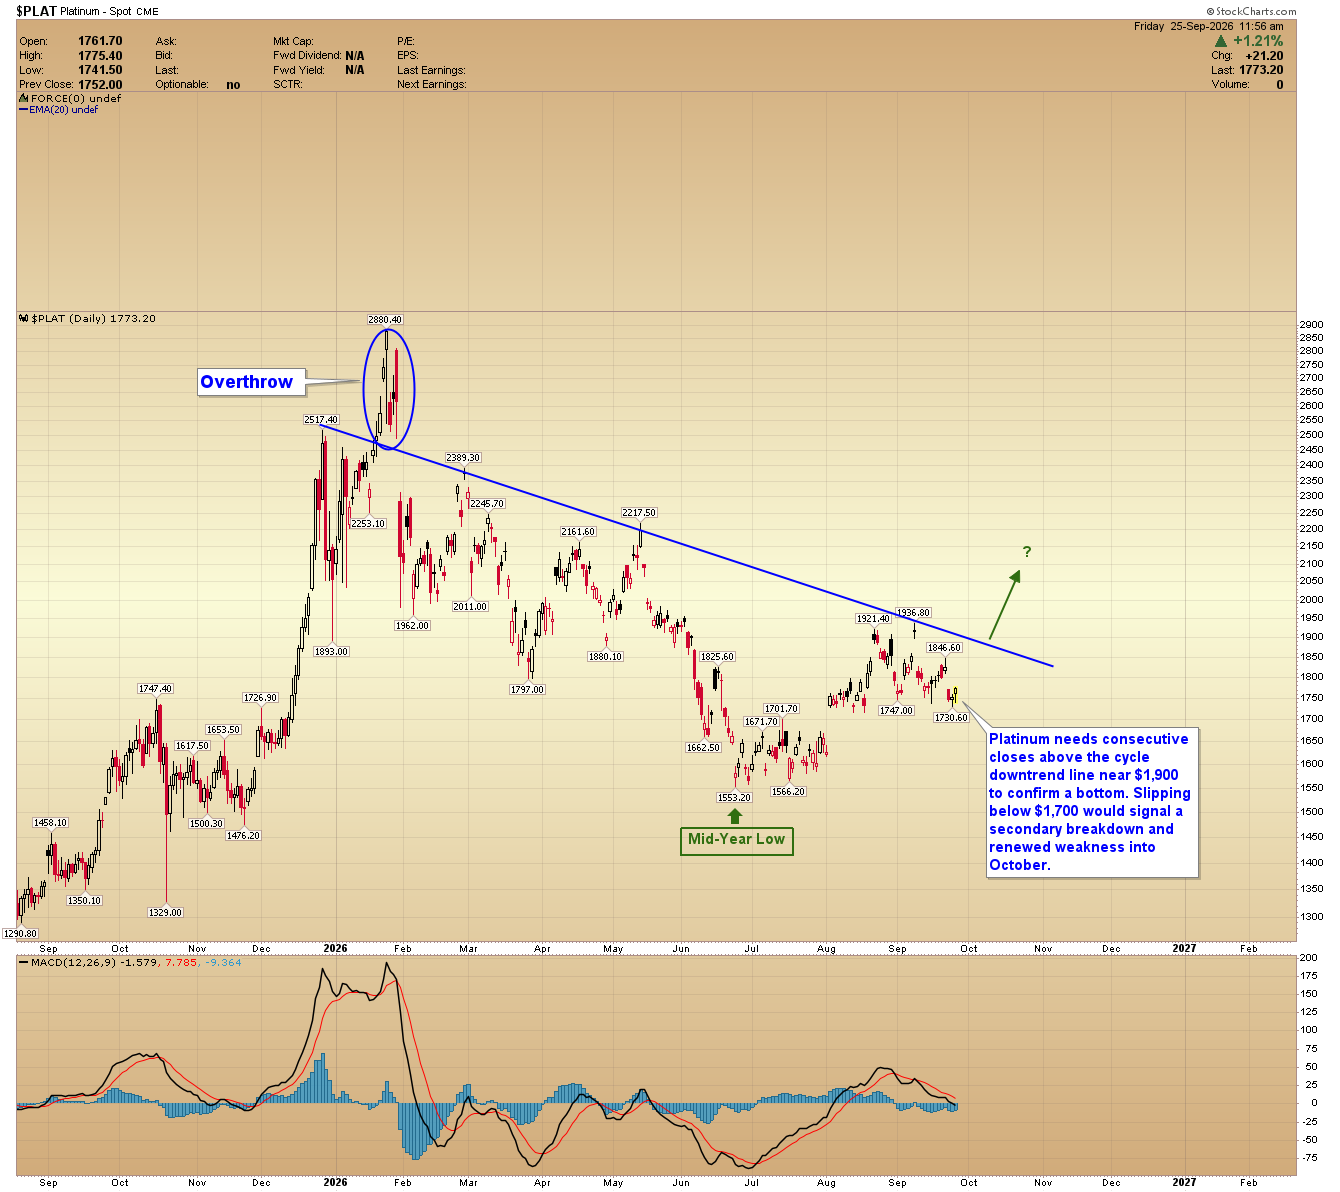
Daily candlestick chart of spot platinum trading at $1,773.20 below a descending trendline drawn from the early 2026 peak of $2,880.40, with resistance near $1,900 and support marked at $1,700.
Daily chart of spot platinum consolidating at $1,773.20 between downward trendline resistance around $1,900 and key support at $1,700.

GDX

Miners bottomed mid-year as forecast and rallied more than 50% in just over a month. The current pullback appears to be forming a bull flag, supporting a medium-term target of $135 – $140 upon a confirmed breakout.
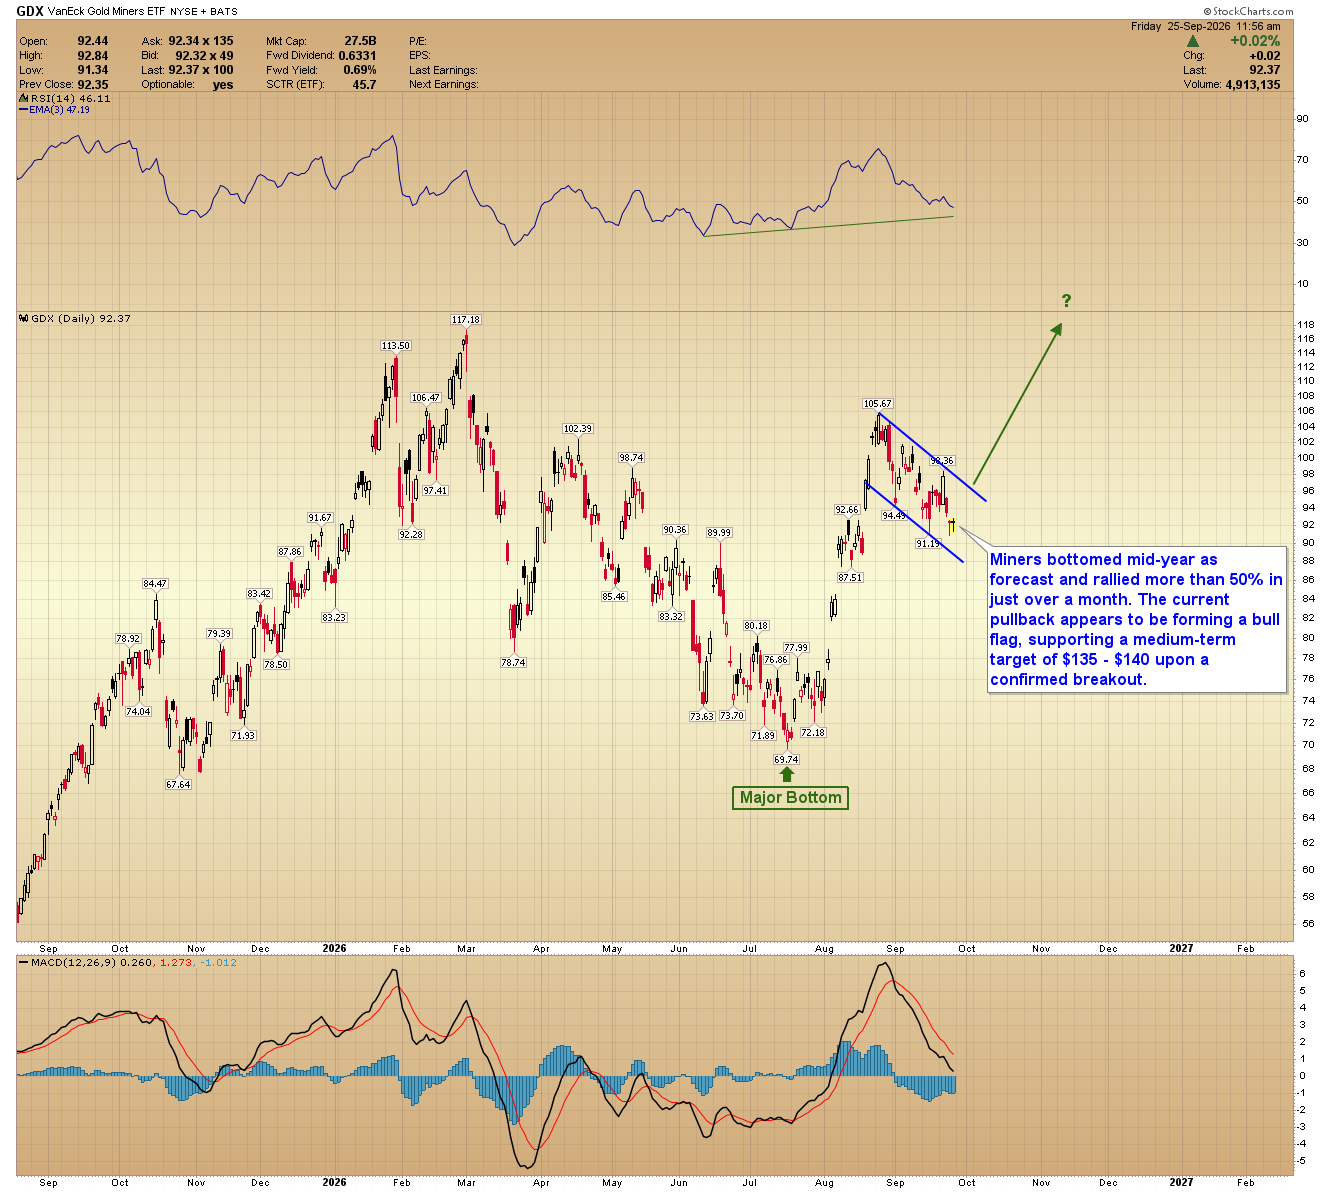
Daily candlestick chart of the VanEck Gold Miners ETF (GDX) trading at $92.37 inside a downward consolidation channel off the $105.67 peak, above its $69.74 mid-year low.
Daily chart of GDX consolidating at $92.37 within a downward channel between the recent $105.67 high and the $69.74 major low.

GDXJ

Gold juniors may also be forming a bull flag, which projects a surge toward $175 upon a confirmed breakout in October.
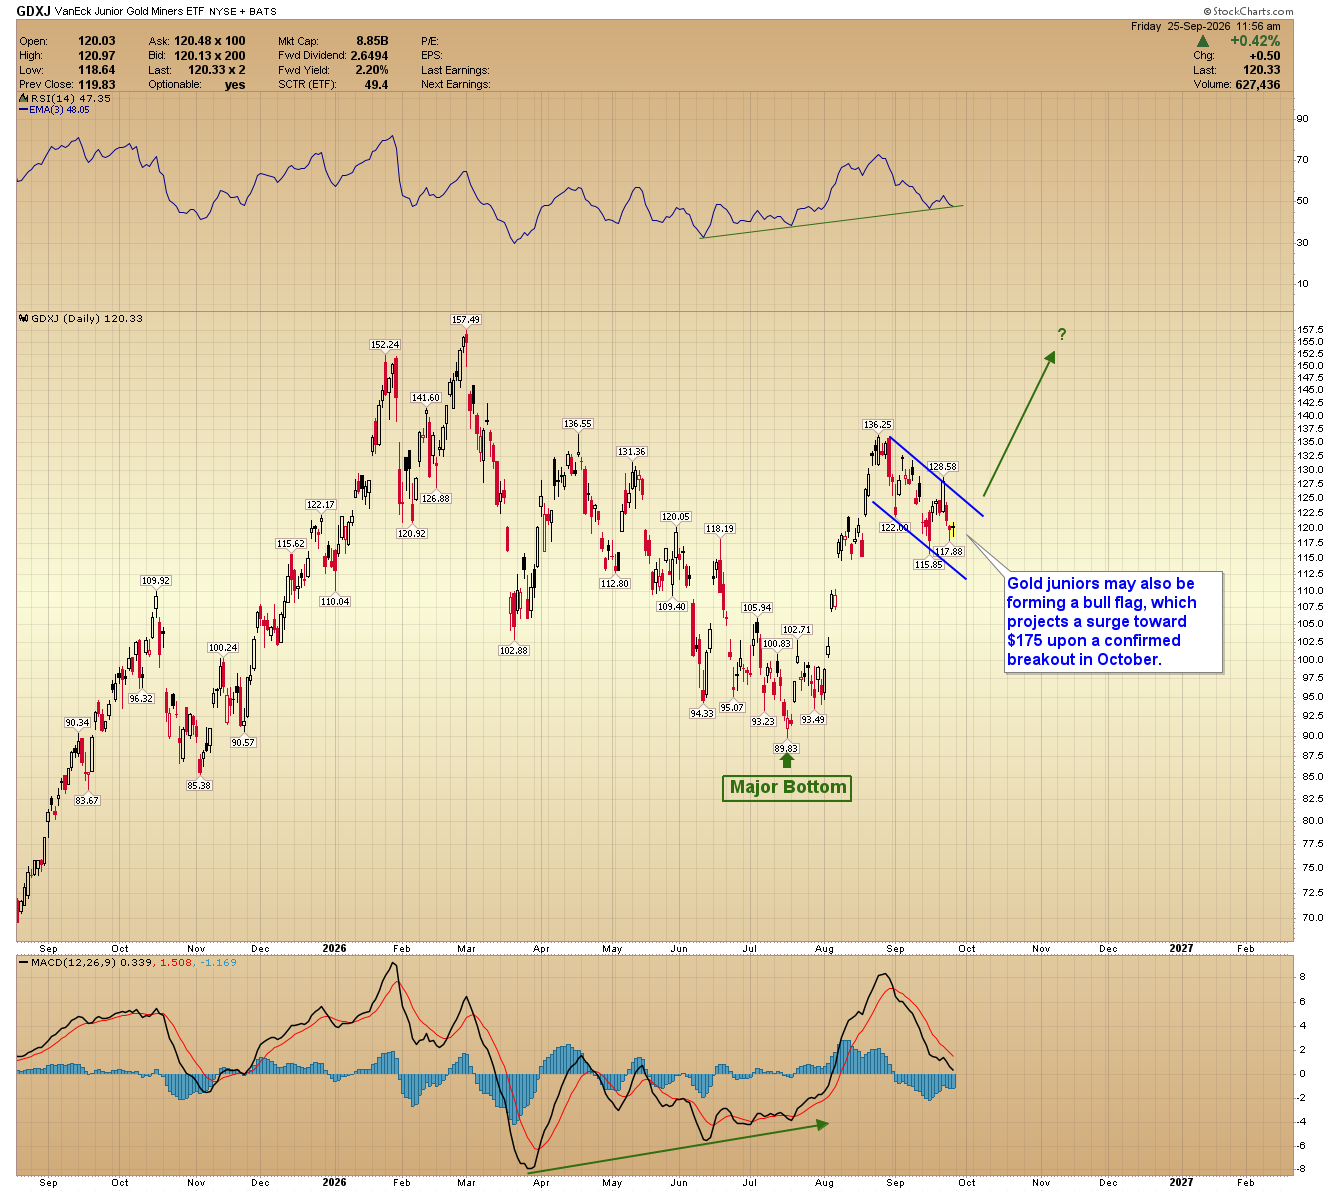
Daily candlestick chart of the VanEck Junior Gold Miners ETF (GDXJ) trading at $120.33 within a downward sloping flag pattern off the $136.25 high, well above its $89.83 major bottom.
Daily chart of GDXJ consolidating at $120.33 inside a downward channel between the $136.25 recent peak and the $89.83 mid-year low.

SILJ

Silver juniors must break decisively above $31.00 to confirm a bull flag, targeting $40.00+ potentially in November.
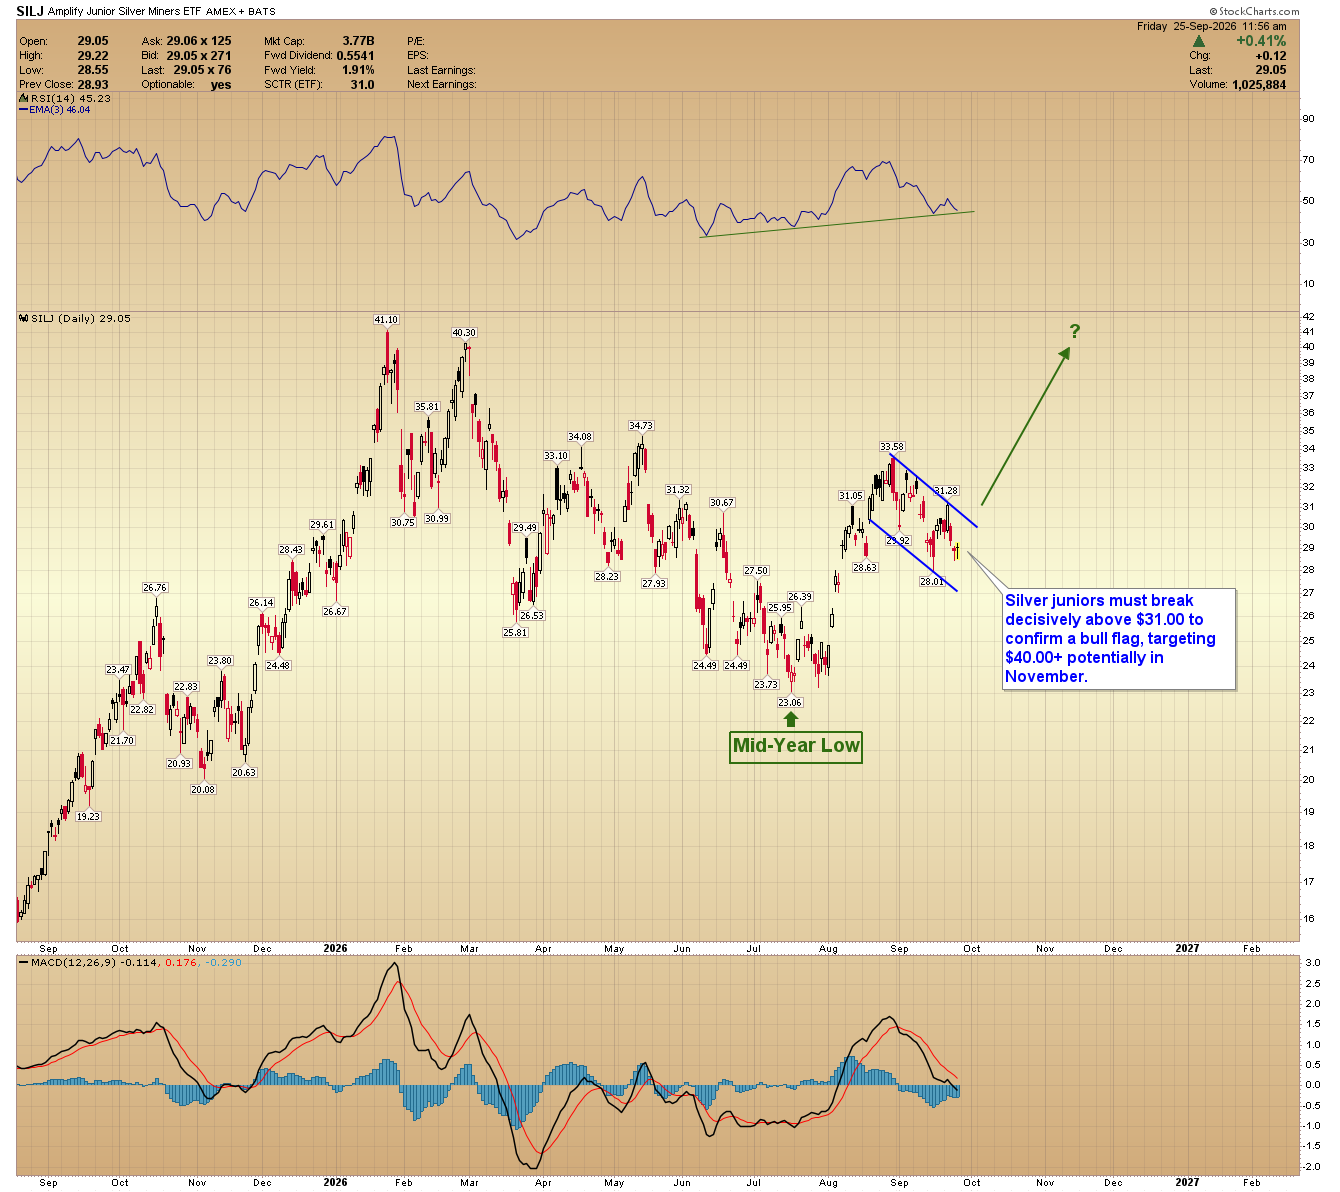
Daily candlestick chart of Amplify Junior Silver Miners ETF (SILJ) consolidating at $29.05 inside a downward-sloping channel off its $33.58 peak, well above the $23.06 mid-year low.
Daily chart of SILJ trading at $29.05 within a downward consolidation channel between the $33.58 local high and the $23.06 mid-year low.

Bitcoin Weekly

Bitcoin surged in recent months, exceeding the May highs. The historic four-year cycle did not project a final bottom until October or November. For that pattern to be fulfilled, the current action would need to develop into a broadening bottom formation, with a lower low in Q4. A weekly close below $75,000 in October would bolster this potential.
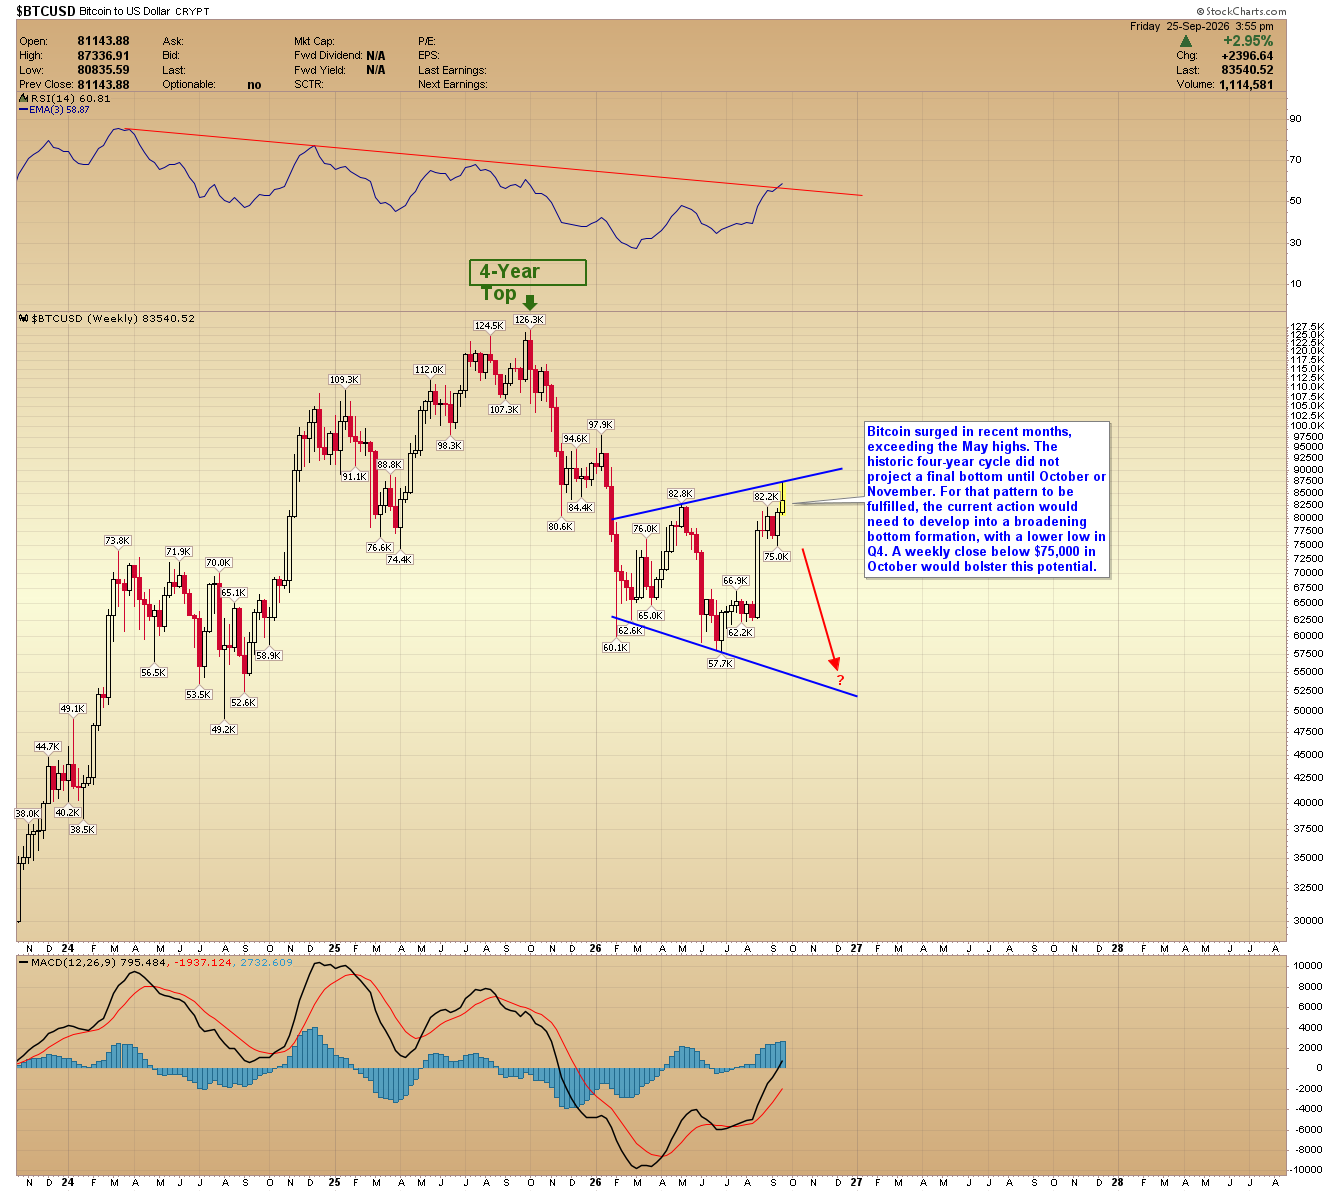
Weekly candlestick chart of Bitcoin to US Dollar (BTC/USD) trading at $83,540.52 within a widening channel, below its 4-year cycle top at $126.3K.
Weekly chart of BTC/USD rebounding to $83,540.52 inside a broadening formation off the $57.7K low and below the $126.3K peak.

Final Thoughts

Next week’s price action—particularly Wednesday’s PCE inflation and Friday’s nonfarm payrolls report—will be critical for gold’s near-term outlook.

A continued spike in Treasury yields could create a headwind for precious metals and miners. However, we would view any such weakness as temporary within the broader uptrend.

Gold miners remain a key area of focus. I believe they could be the next market leaders, and I’ll be watching their price action closely for clues about the broader trend.

For more price predictions and daily market commentary, consider subscribing at www.GoldPredict.com.

About the Author

AG Thorsoncontributor

AG Thorson is a registered CMT and expert in technical analysis. He believes we are in the final stages of a global debt super-cycle that will begin to unravel in 2020.

Advertisement